
Published: March 18th, 2026
Zcash (ZEC) broke over the declining pattern earlier this week and is currently trading above the crucial 250.00 level. While strong momentum is evident in the technical chart, on-chain and derivatives statistics point to a mixed future with a modestly optimistic slant.
According to CryptoQuant's summary statistics, the market's massive whale orders point to a somewhat promising future for ZEC. Nonetheless, activity in both the spot and futures exchanges points to the domination of selling.
A favorable prognosis is supported on the derivatives side by ZEC's positive funding and growing long bets. According to the on-chain data, the measure turned positive and is currently at 0.0077%, suggesting that longs are outperforming shorts.
Furthermore, ZEC's long-to-short ratio within the same time frame is 1.06. The fact that this ratio is greater than 1 indicates that most traders are betting on an increase in the asset's price.
Let's see the complete price outlook from the ZEC/USDT market analysis:
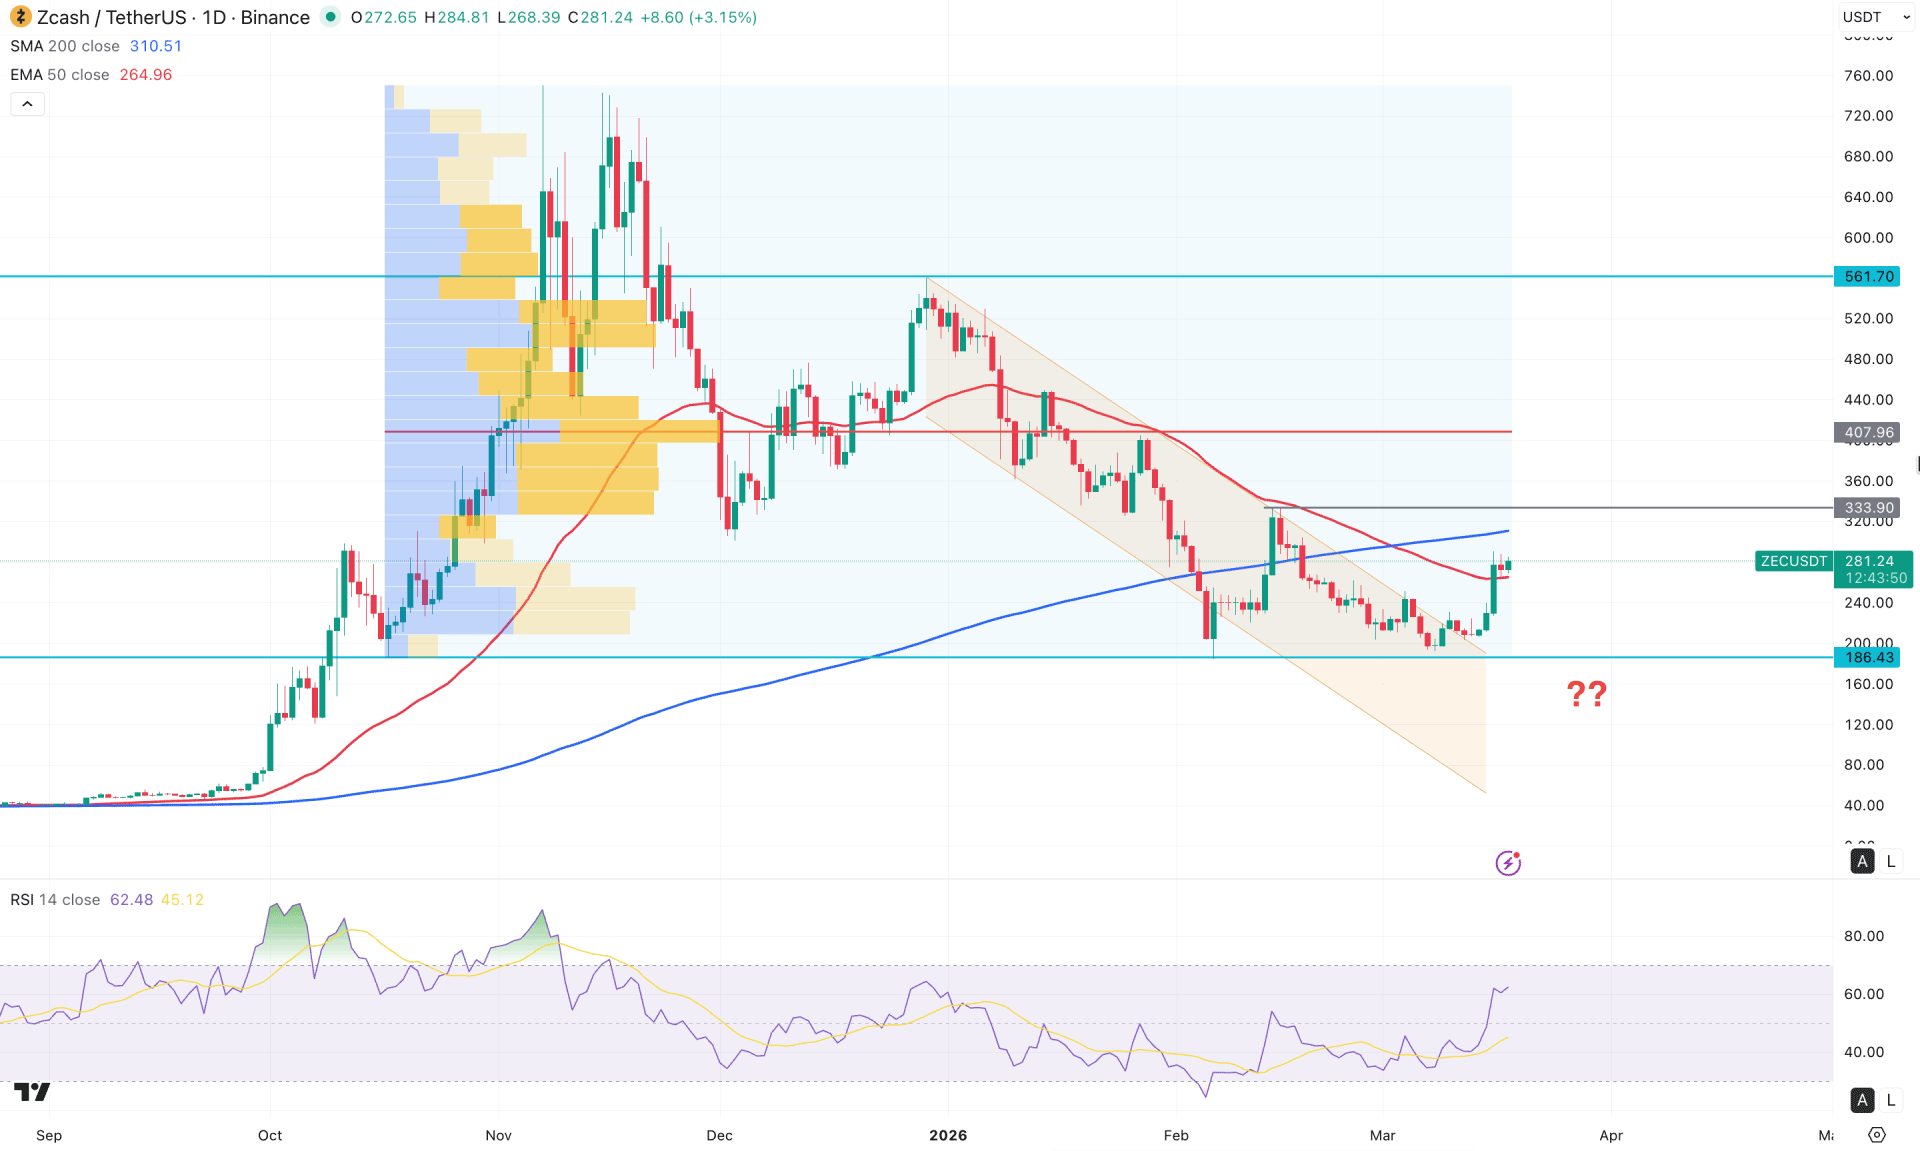
In the daily chart of ZEC/USDT, the near-term market momentum appears bullish, as the price is currently holding above the $250.00 trendline following a successful breakout. At present, the price is approaching a crucial resistance zone, which must be cleared with strong institutional volume to confirm a valid breakout.
On the higher timeframe, the broader structure remains challenging for buyers, as the current monthly candle is still trading within the key resistance zone around $302.10. However, the weekly chart shows a bullish structure, with price rising for two consecutive weeks and supported by a breakout from an engulfing pattern.
In terms of volume, conditions remain favorable, as the highest activity level since November 2025 is positioned above the current price. Although there is no significant volume support at lower levels, the recent bullish momentum suggests there is sufficient room for the price to rally approximately 46% toward the high-volume area.
On the main price chart, the price has reclaimed the 50-day EMA with a daily close, indicating that further bullish continuation is possible. However, a death cross is also present, with the 50-day EMA crossing below the 200-day SMA, signaling a potential challenge for buyers. Based on this, any short-term pullback from the current premium zone could present a stronger opportunity, provided the 200-day SMA remains intact.
Momentum indicators also support the bullish outlook. The Relative Strength Index (RSI) is currently above 60.00, indicating strong buying pressure. Additionally, the MACD signal line is in positive territory and histogram bars are expanding, further confirming bullish momentum. The trend strength is also improving, as the Average Directional Index (ADX) has rebounded above 20.00, signaling a potential emerging trend.
Based on the daily outlook, the immediate resistance is located at the $300.00 psychological level, slightly above the $298.00 100-day EMA. A confirmed daily close above the $333.90 resistance level could further strengthen the bullish case and pave the way for a recovery above the $407.96 high.
On the downside, investors should closely monitor how the price behaves around the $250.00 psychological level. Immediate horizontal support is located at $242.49. If the price fails to maintain buying pressure above this zone, a deeper pullback may occur before a renewed bullish structure develops.
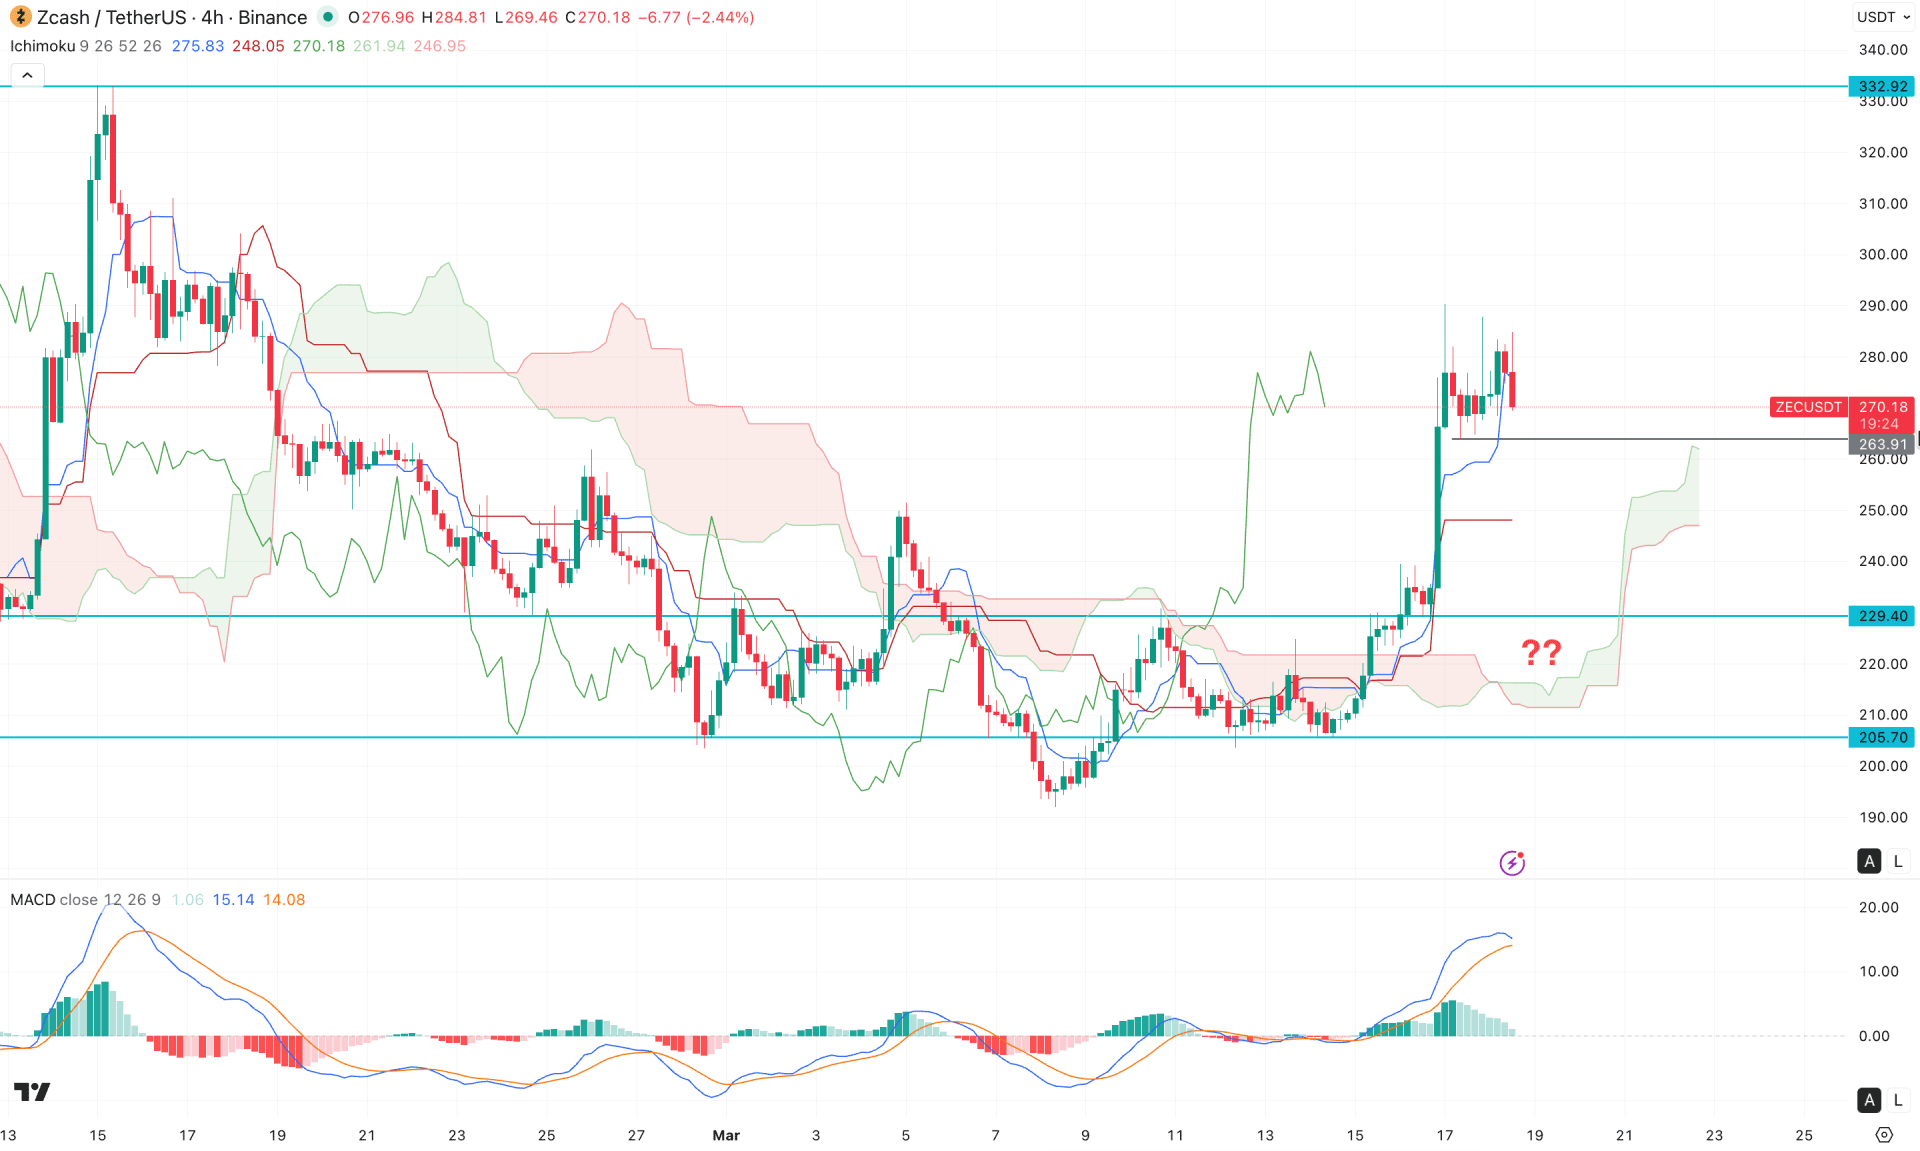
In the H4 timeframe, ZEC/USDT is trading in a bullish trend following a valid range breakout, with the current price holding above the recent session high. However, a sideways consolidation phase is evident after breaking above the $251.71 swing high, signaling a potential short-term correction.
A bearish four-hour candle has formed below the Kijun-sen level, while the future cloud remains supportive for buyers. At the same time, the MACD signal line is elevated, and a potential squeeze in the MACD histogram could signal a downside correction, pending confirmation from price action.
Based on the four-hour market structure, the overall bias remains bullish as long as the price holds above the cloud support. A more extended downside correction would be validated if a four-hour bearish candle closes below the $250.00 psychological level.
On the bullish side, continued buying pressure could push the price toward the $300.00–$305.00 psychological zone in the near term. However, stronger long-term bullish momentum is likely to emerge only after a confirmed breakout above the $332.92 swing high.
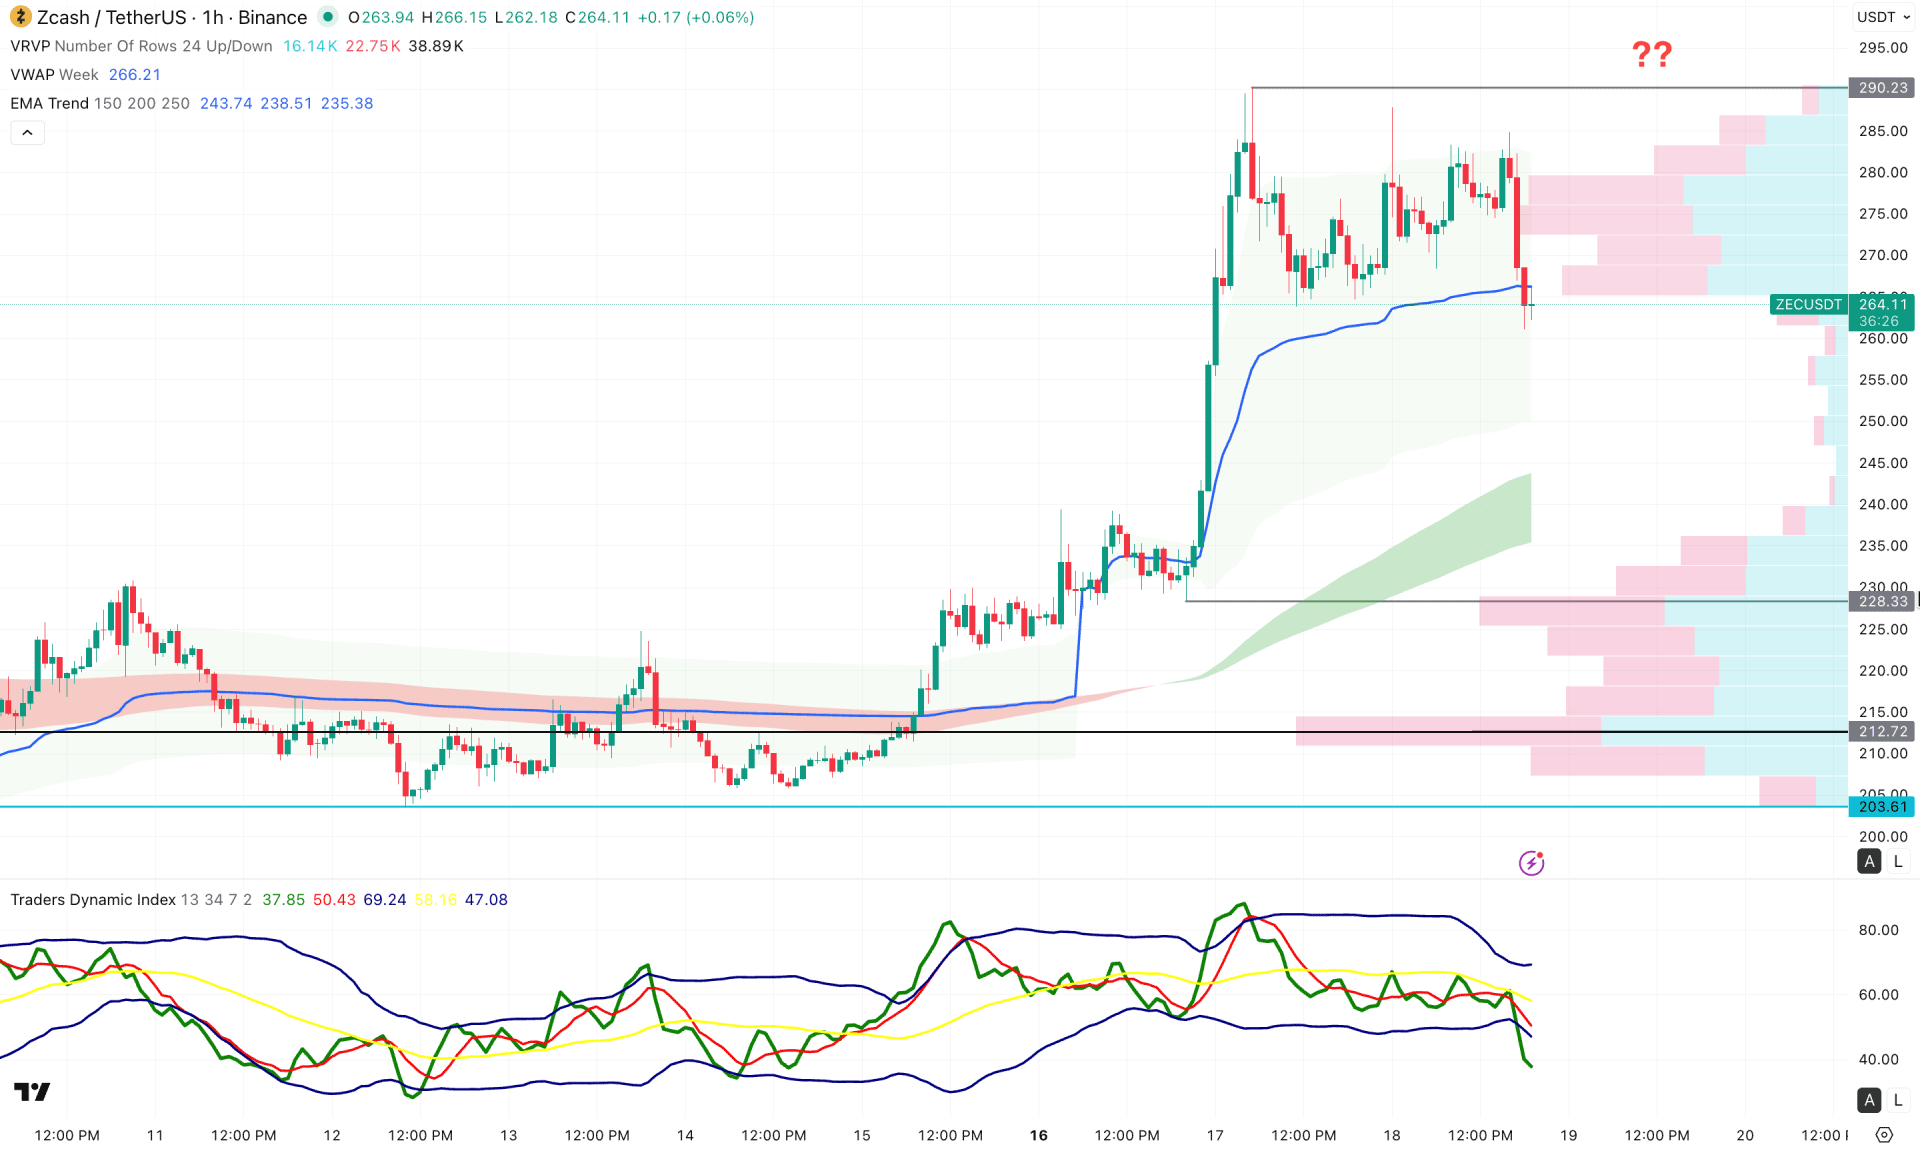
In the hourly timeframe, the current price is facing selling pressure at the top, suggesting a decent downside correction. Moreover, a bearish H1 candle is visible below the weekly VWAP line, signalling a confluence of selling pressure.
In the indicator window, the Traders Dynamic Index (TDI) is in an oversold area, suggesting an extreme bearish condition.
Based on this outlook, the price is more likely to aim lower as a mean-reversion to the EMA wave area. However, a bullish rebound is possible as long as the price trades above the 228.33 support level, which could offer a bullish opportunity at any time.
Based on the overall market structure, the ZEC/USDT is more likely to extend the current bearish pressure until the 300.00 psychological line is broken. As the intraday price is at the peak, a decent downside correction might offer a long opportunity from a bottom formation.


