Published: October 9th, 2025
Although the sharp increase in the price of gold over previous years has been well reported, Platinum has subtly outperformed gold and is up about 75% in Australian dollars during the same time frame.
Although the value of gold has been steadily rising over the last 12 months, the price of platinum has been fluctuating until late May, when it began to rise sharply.
Given that geographic demand shifts were exacerbating almost two and a half years of market deficits. At the same time, the US struggled with tariff issues, and China increased imports; price increases were not shocking.
According to the Council's study, the supply outlook is still bleak, and the worldwide platinum market is predicted to be in short supply by 850,000 ounces this year.
Due to manufacturers' inability to replicate the 2024 drop in work-in-progress stock, mining supply is expected to decline by 6% annually. Significantly, the amount of recycling would rise by 6% a year in 2025, with some indication that rising pricing for platinum group metals may encourage more recycling.
Let's see the further outlook from the XPTUSD price analysis:
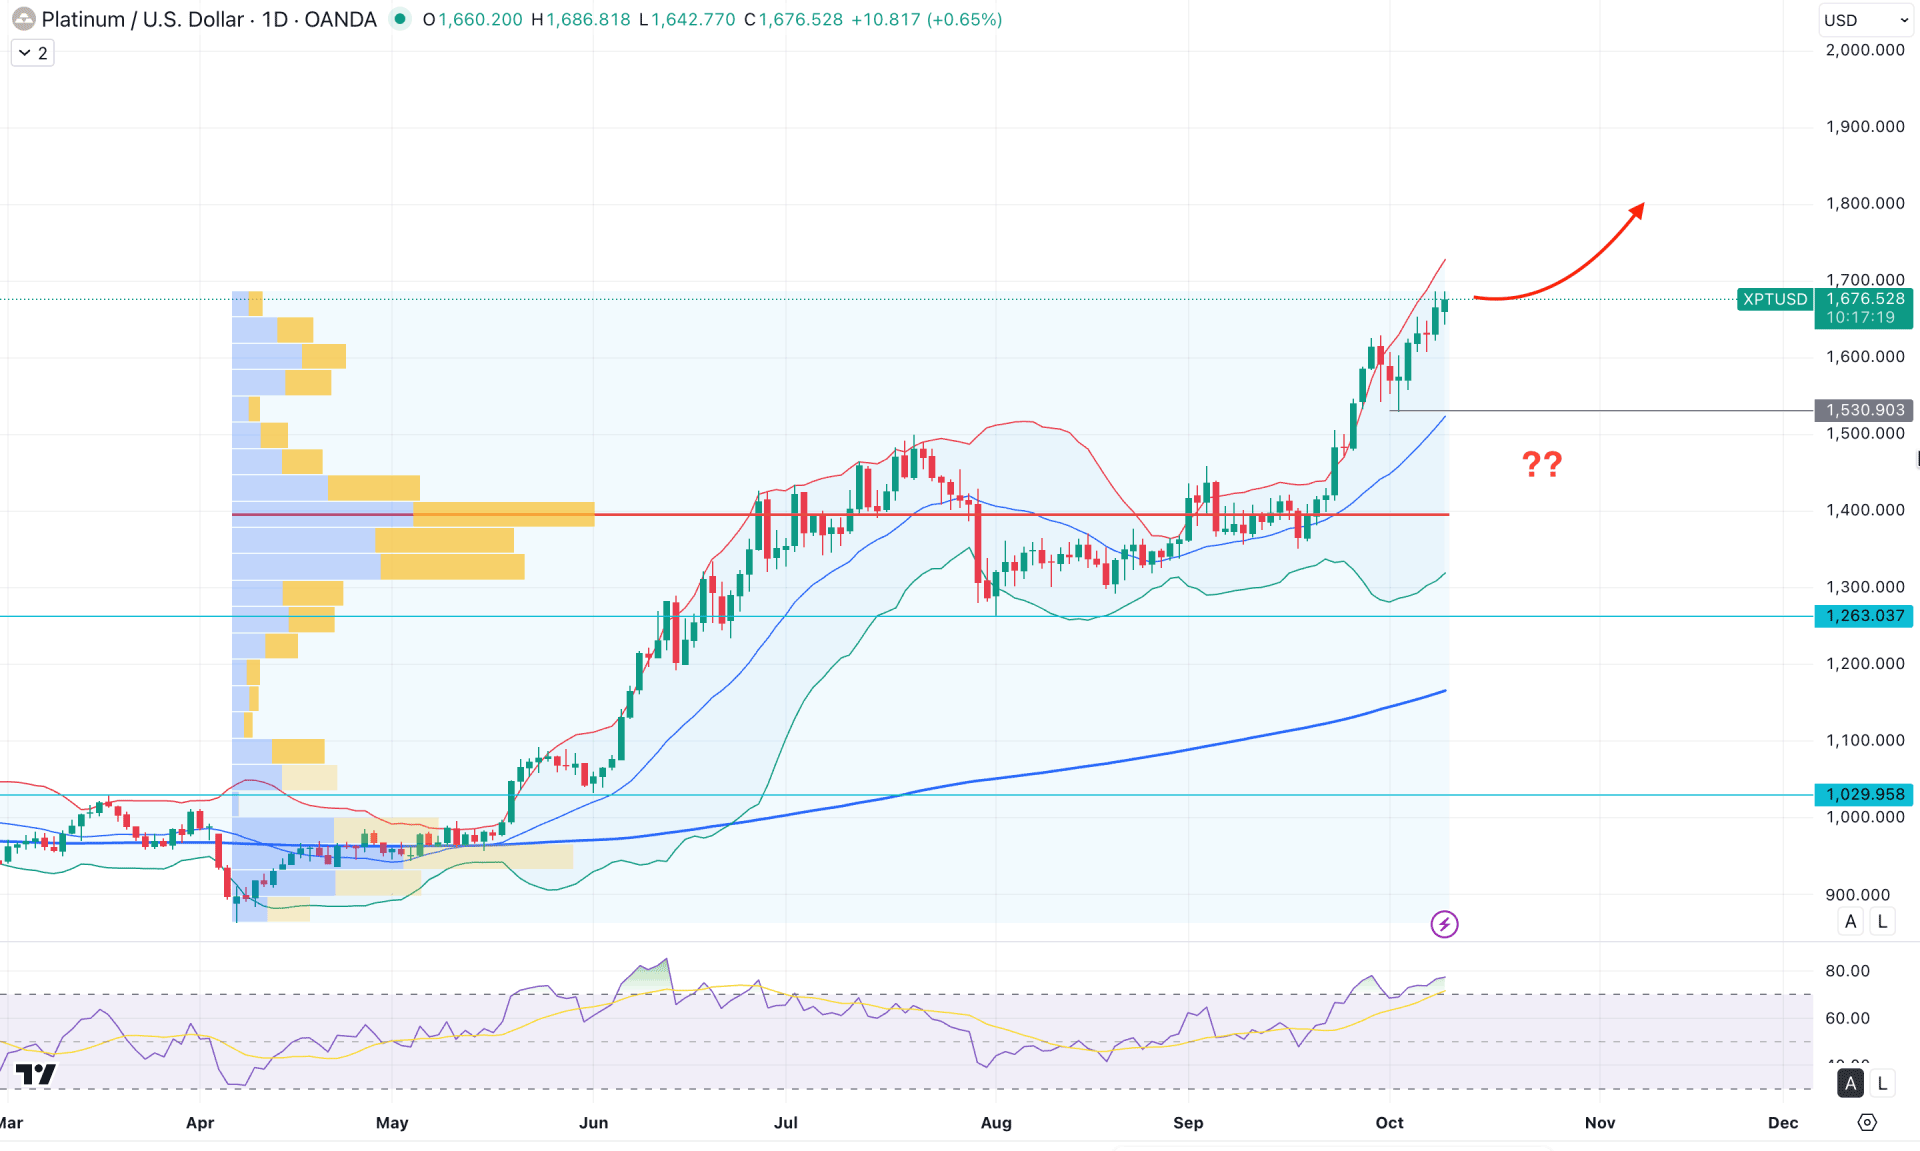
In the daily chart of Platinum (XPT), an ongoing bullish momentum is present as the price continues to trade higher within a bullish impulsive wave. In this case, the price is likely to extend the buying pressure until exhaustion appears at the top.
In the higher timeframe, the Platinum is already trading near a multi-year high with no significant signs of bearish recovery. The bullish inside-bar breakout in August 2025 continued the buying pressure and pushed the price above the 2014 high. Since the most recent price is still trading above the September 2025 high, we may expect a decent bullish continuation opportunity.
In the weekly timeframe, the price formed a bullish breakout after a downside correction in July 2025. As the price is now hovering above the 161.8% Fibonacci extension level of the July–August swing, there is a higher possibility of continued buying pressure.
From a volume perspective, the bullish momentum is also valid, as the largest activity level seen in April 2025 is below the current price. Although the high-volume bullish breakout emerged from a valid range, the gap between the higher level and the current price has widened. In that case, investors should closely monitor the market, as any sign of a valid top formation could indicate a potential bearish correction opportunity.
In the indicator window, the bullish pressure remains valid as the price has continued to move higher above the mid-Bollinger Band line for more than a month. However, the upper Bollinger Band line is still above the current price, signalling that a top has not yet been formed.
In a broader perspective, the gap between the current price and the 200-day SMA has widened, indicating a potential mean reversion or corrective pullback.
The Relative Strength Index (RSI) tells a similar story, with the current RSI remaining above the 70.00 line for the first time in four months. Investors should closely monitor how long the RSI stays above this level, as a potential divergence could be the first sign of a bearish correction.
Based on the overall market structure, bullish continuation opportunities remain valid, with the upper Bollinger Band line acting as the immediate resistance target. In this structure, the 1607.60 level could serve as a major support area. As long as the price hovers above this level, we may expect it to move toward the 1800.00 psychological mark.
However, further confirmation is needed before anticipating a recovery, which might come from a solid RSI divergence. If the price breaks below the 1607.60 level with a counter-impulsive bearish momentum, it could open a short opportunity targeting the 1500.00 level.
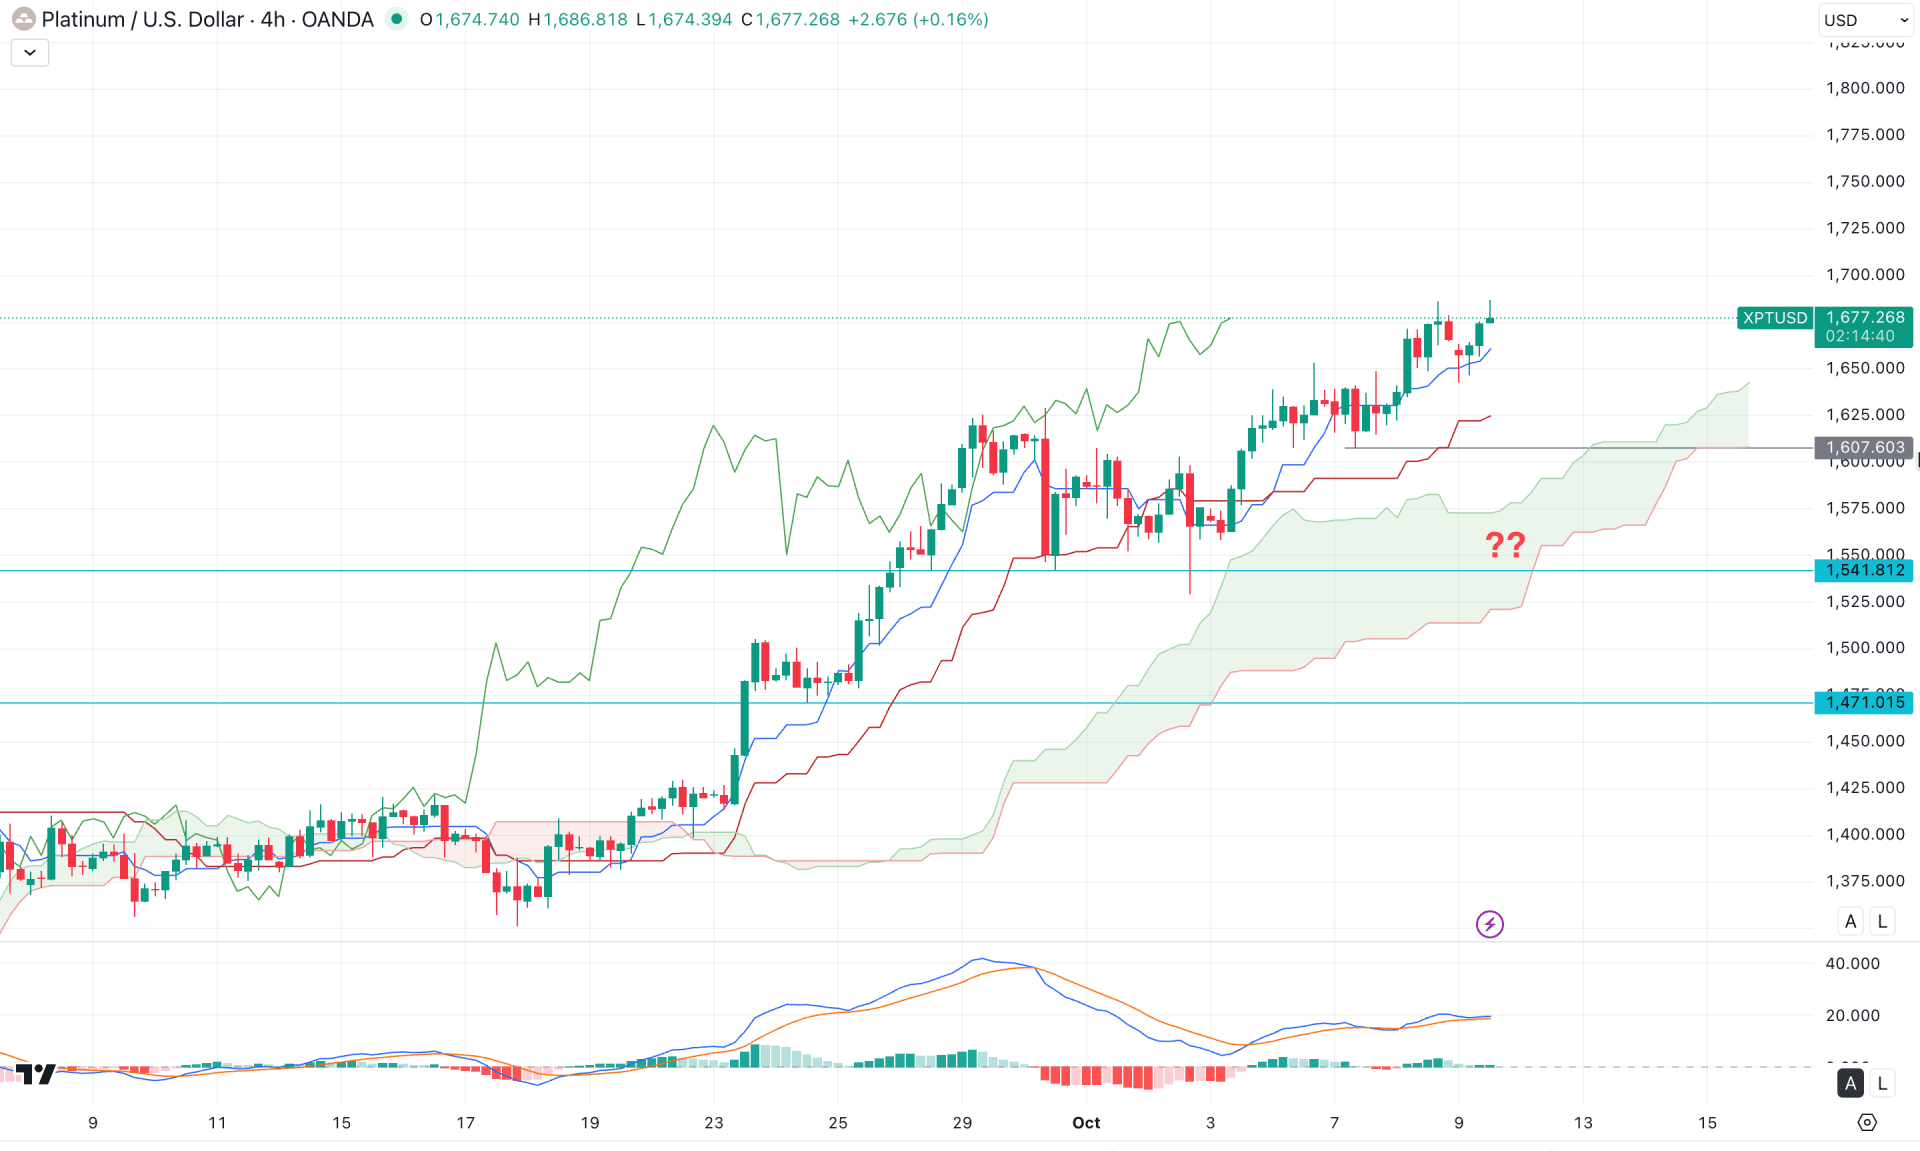
In the four-hour timeframe, ongoing buying pressure is evident, with the Kumo Cloud acting as a strong trend-trading signal. After setting a new high in September 2025, the price moved lower but failed to break below the Kumo Cloud area.
Instead, it found exhaustion at the 1541.81 support level and continued to move higher following a valid range breakout. As the current price is trading within an ongoing bullish pressure, further upside momentum could develop.
In the future cloud, both Senkou Span lines are heading upward, signalling a possible correction followed by a bullish continuation from the dynamic support area.
On the other hand, a potential MACD divergence has formed, as the signal line failed to follow the bullish momentum. However, the histogram remains above the neutral line, indicating that more confirmation is needed before anticipating a bearish scenario.
Based on the H4 market outlook, the primary focus should be on long opportunities as long as the Kijun-sen remains below the current price. On the bullish side, the 1700.00 psychological level serves as the immediate target, with potential to extend further toward the 1775.00 resistance level.
Conversely, immediate support is located at the 1607.60 level, from where another buying opportunity could arise after a short-term corrective pullback.
Alternatively, an extended selling pressure accompanied by consolidation below the 1541.81 level could signal a trend reversal. In that case, the ultimate downside target would be the 1479.01 support level, with potential to move further below the 1400.00 psychological mark.
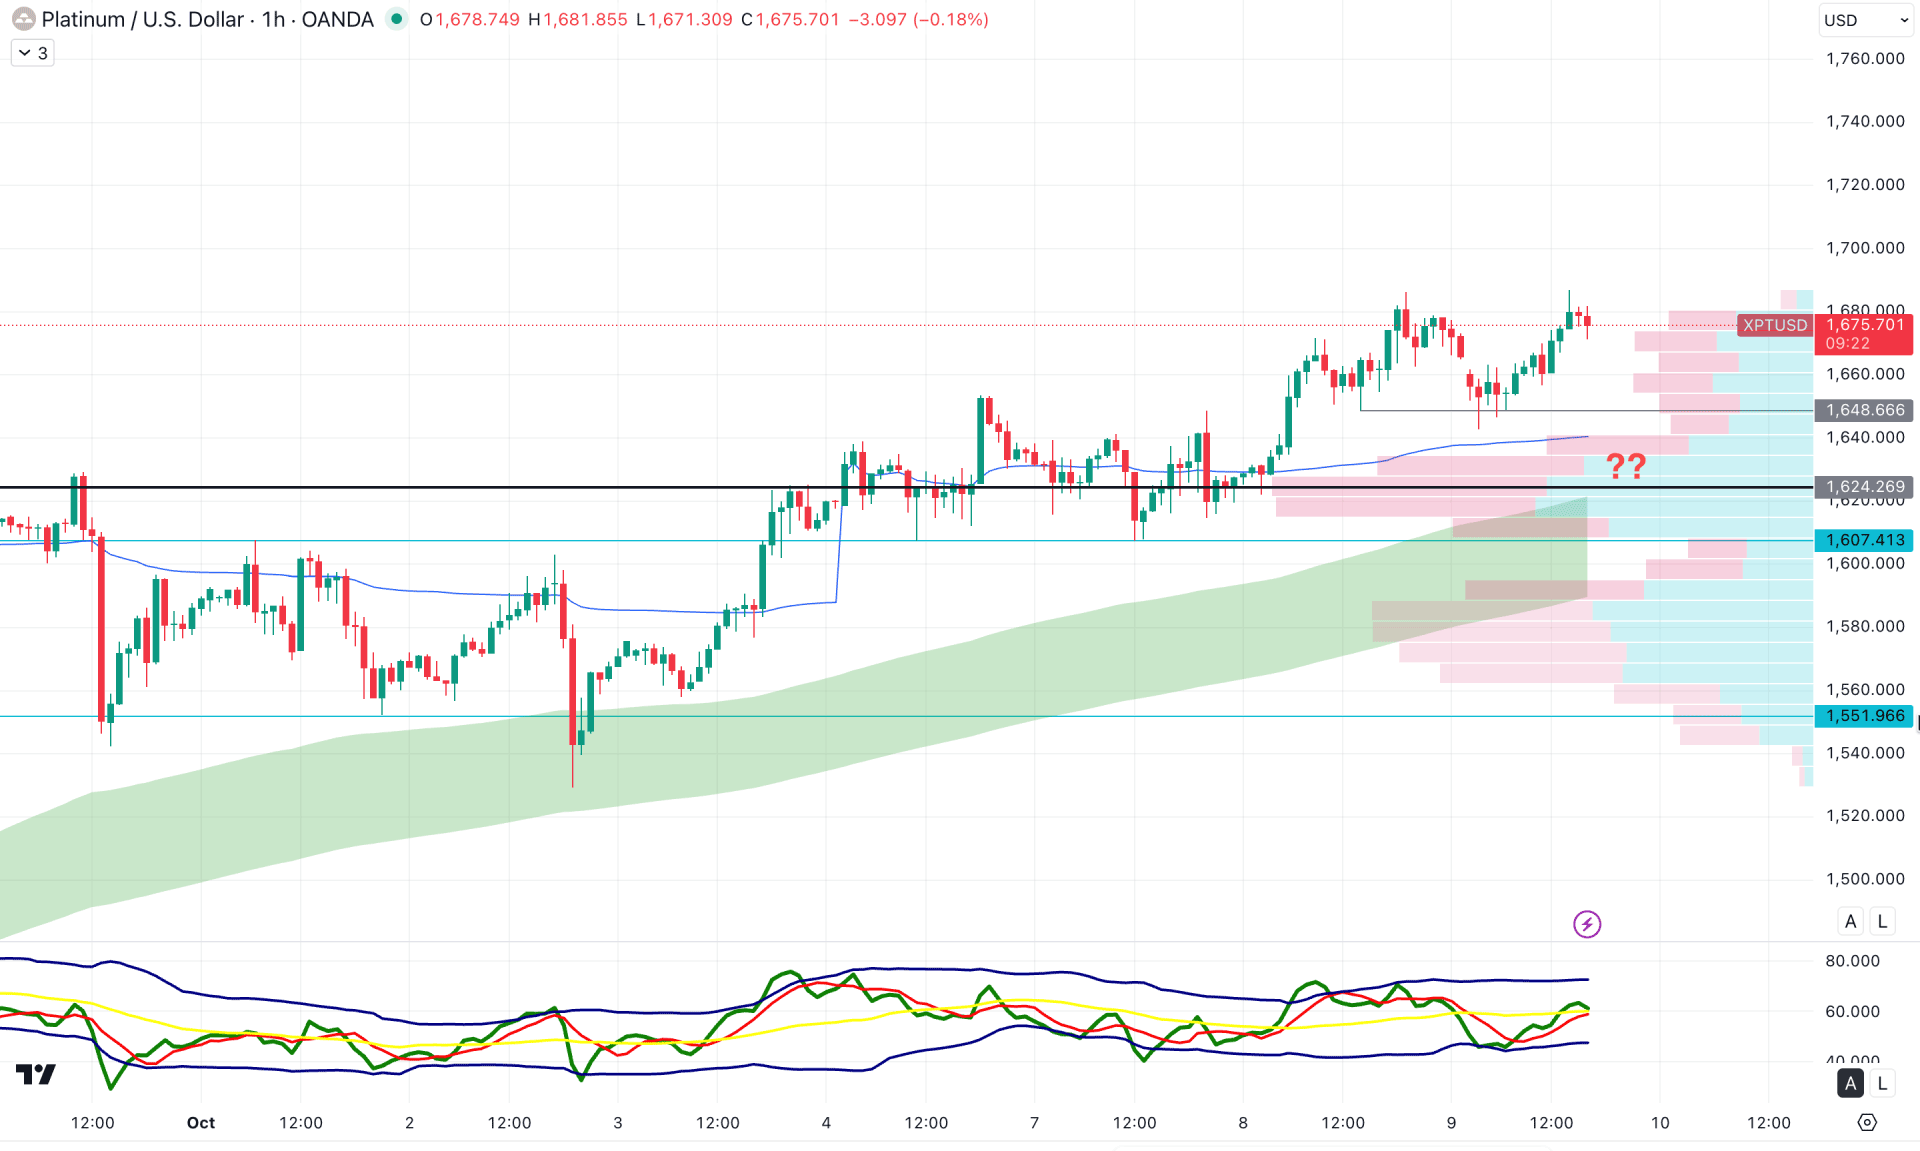
In the hourly timeframe, the ongoing market momentum is bullish, where the current price is trading at the intraday high. Moreover, the Visible Range High volume line is closer to the current price, working as a crucial support, above the EMA wave area.
In the indicator window, the Trader's Dynamic Index (TDI) is hovering at the neutral 50.00 line, while both up and down lines are sideways. It is a sign of a corrective market pressure, where a potential range formation could come.
Based on this outlook, the primary aim for this instrument is to anticipate a bullish continuation as long as the 1648.66 support level is untouched. Below this line, the next support level is at the 1607.41 level, from where another long opportunity awaits.
On the bearish side, an extended selling pressure, with a consolidation below the 1624.25 high volume line, could be a short opportunity, targeting the 1551.96 support level.
The market outlook shows ongoing demand for safe-haven assets, and the surge in industrial demand signals a strong long-term upside potential for platinum. However, the price is already trading near a multi-year high, where the bullish continuation remains strong until a clear exhaustion appears at the top.


