
Published: June 18th, 2026
Due to pressure from a more solid US dollar following the Federal Reserve's indication of increasing support for higher interest rates this year, platinum futures dropped below $1,770 per ounce and returned to six-month lows.
Nine Fed members now anticipate a rate increase by the final year of 2026, despite the central bank keeping its policy rate constant.
Kevin Warsh, the next Fed Chair, emphasized that inflation has stayed over the central bank's target and reaffirmed the Fed's commitment to re-establishing price stability. However, he abstained from offering advice on the next course of action.
In the meantime, after US President Trump announced an interim deal to halt the war with Iran, which might reopen the Strait of Hormuz and ease concerns about inflation, losses were limited as oil prices continued to drop.
Due to aging mines, high prices, and disruptions brought on by sanctions, the output of key suppliers, Russia and South Africa, is still limited, making the platinum market structurally tight.
Let's see the further outlook from the XPTUSD technical analysis:
In the daily timeframe, XPTUSD is trading within an active bearish pressure boosted by the hawkish sentiment from the Federal Reserve chairman. As the price is dropping from a valid top, more downside correction is pending before following the long-term bullish structure.
Looking at the higher timeframe, the price is trading with extremely volatile conditions, as the monthly candle is trading below the four-month low after testing the all-time high level in 2026. Primarily, an active downside correction is present from the monthly structure, and near-term price action is within a potential liquidity zone. The weekly timeframe shows a bearish continuation opportunity, while seven consecutive bearish candles are visible. As no bottom is formed, the primary anticipation would be to look for short trades only.
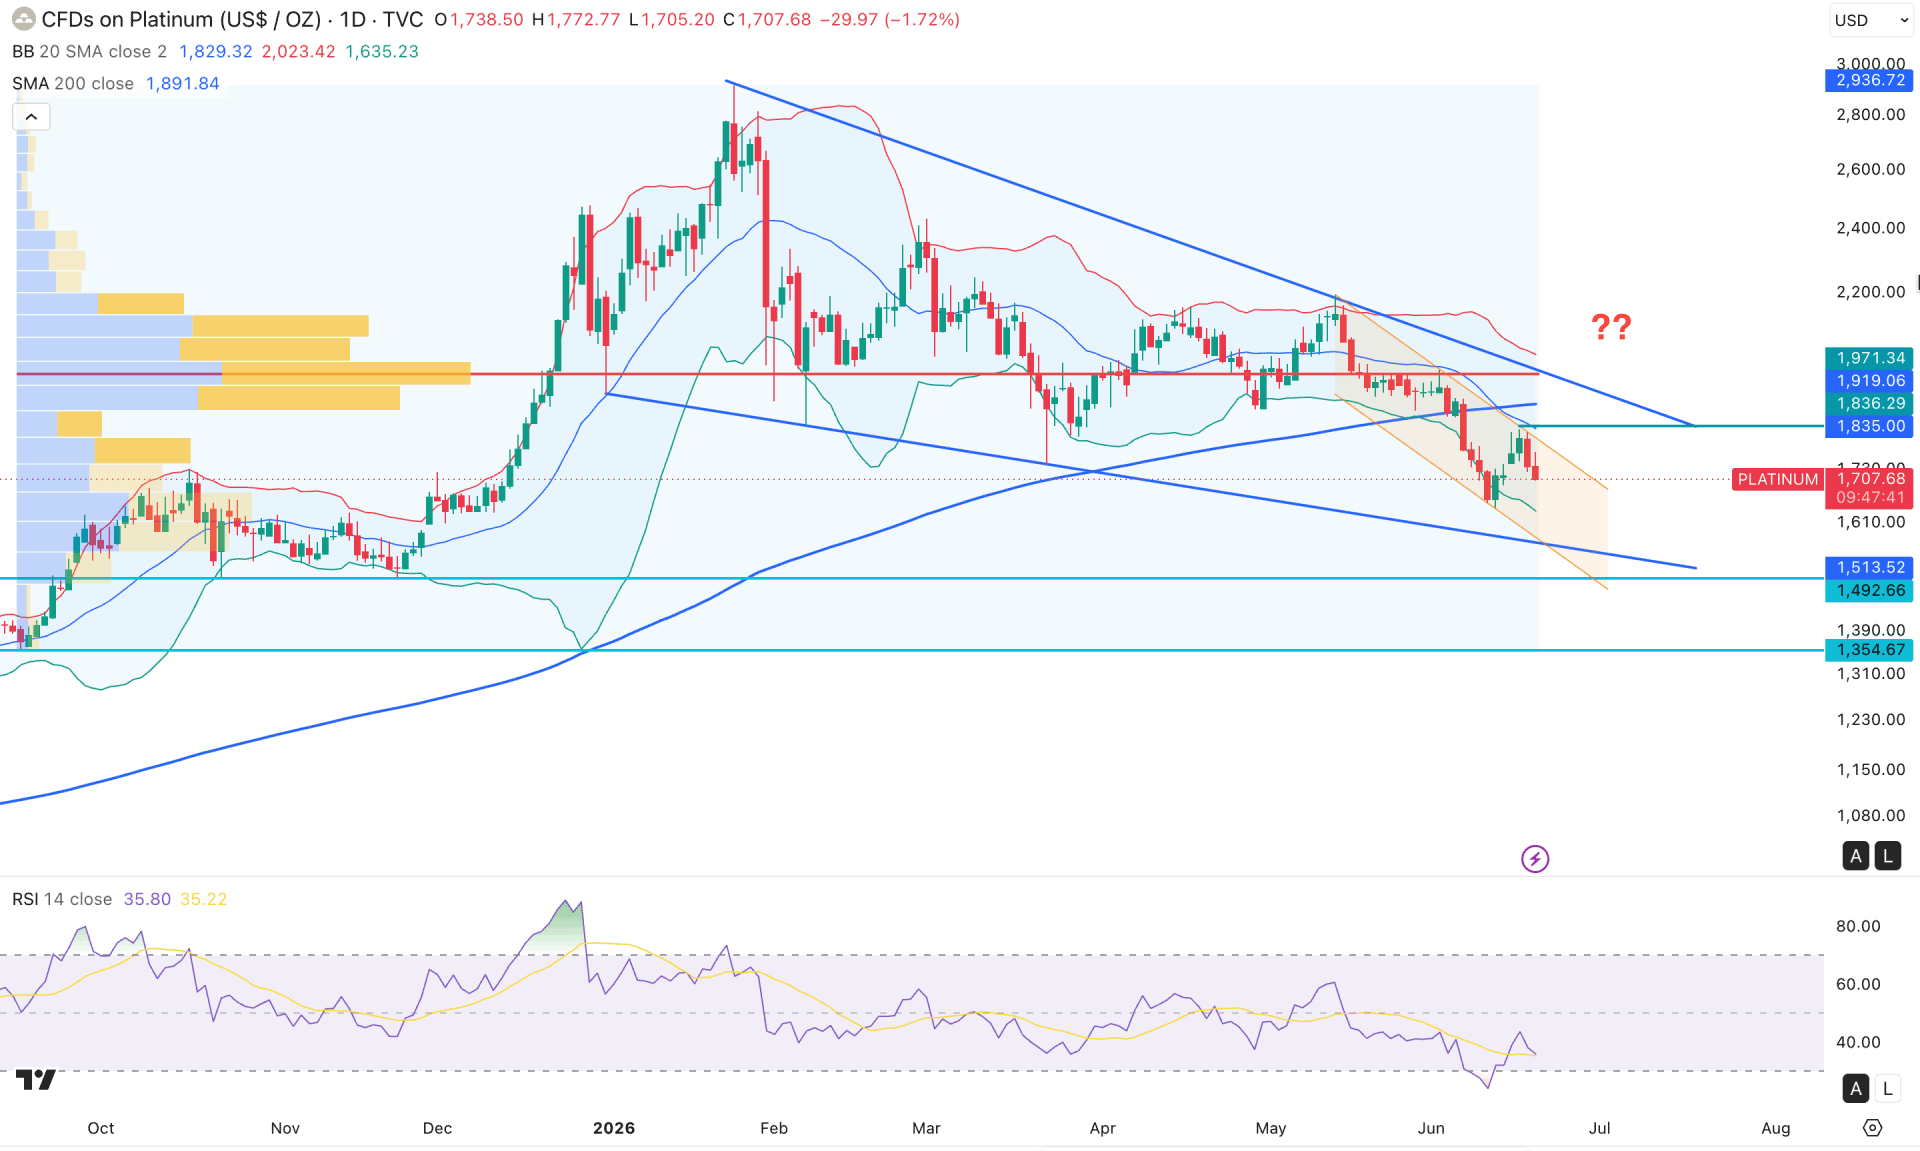
In terms of volume, sellers are also favorable, as the largest activity level in September 2025 is at the 1971.34 level, which is way above the current price. As long as the price remains within this high line, with no new high formation at the bottom, the primary anticipation would be to look for short trades.
In the main price chart, the Bollinger Band suggests a continuation where a bearish rebound is visible from the mid Bollinger Band resistance level. Also, the price moved below the 200-day SMA for the first time since May 2025. After forming a new swing low, the price bounced higher and showed no active buying pressure at the 200-day resistance level.
The Relative Strength Index is having a downward trend, where the current line is below the 50.00 level, which suggests bearish market momentum.
Based on the overall market structure, XPTUSD is trading within a broader pennant pattern, where the entire structure is still bearish and yet to test the pennant support line.
In the shorter timeframe, a descending channel is visible, where the recent price formed a bearish reversal at the channel resistance, and further downside conditions are highly possible. In that case, the price is likely to make a new swing low below the 1636.58 level and test the 1513.52 level soon.
On the other hand, the long-term bullish structure is still valid, as the current price is trading within a broader bearish corrective phase. In that case, the first sign of a bullish signal could come from a rebound above the 200 SMA. Moreover, overcoming the 1919.06 high would increase the buying possibility, targeting the 2800.00 area.
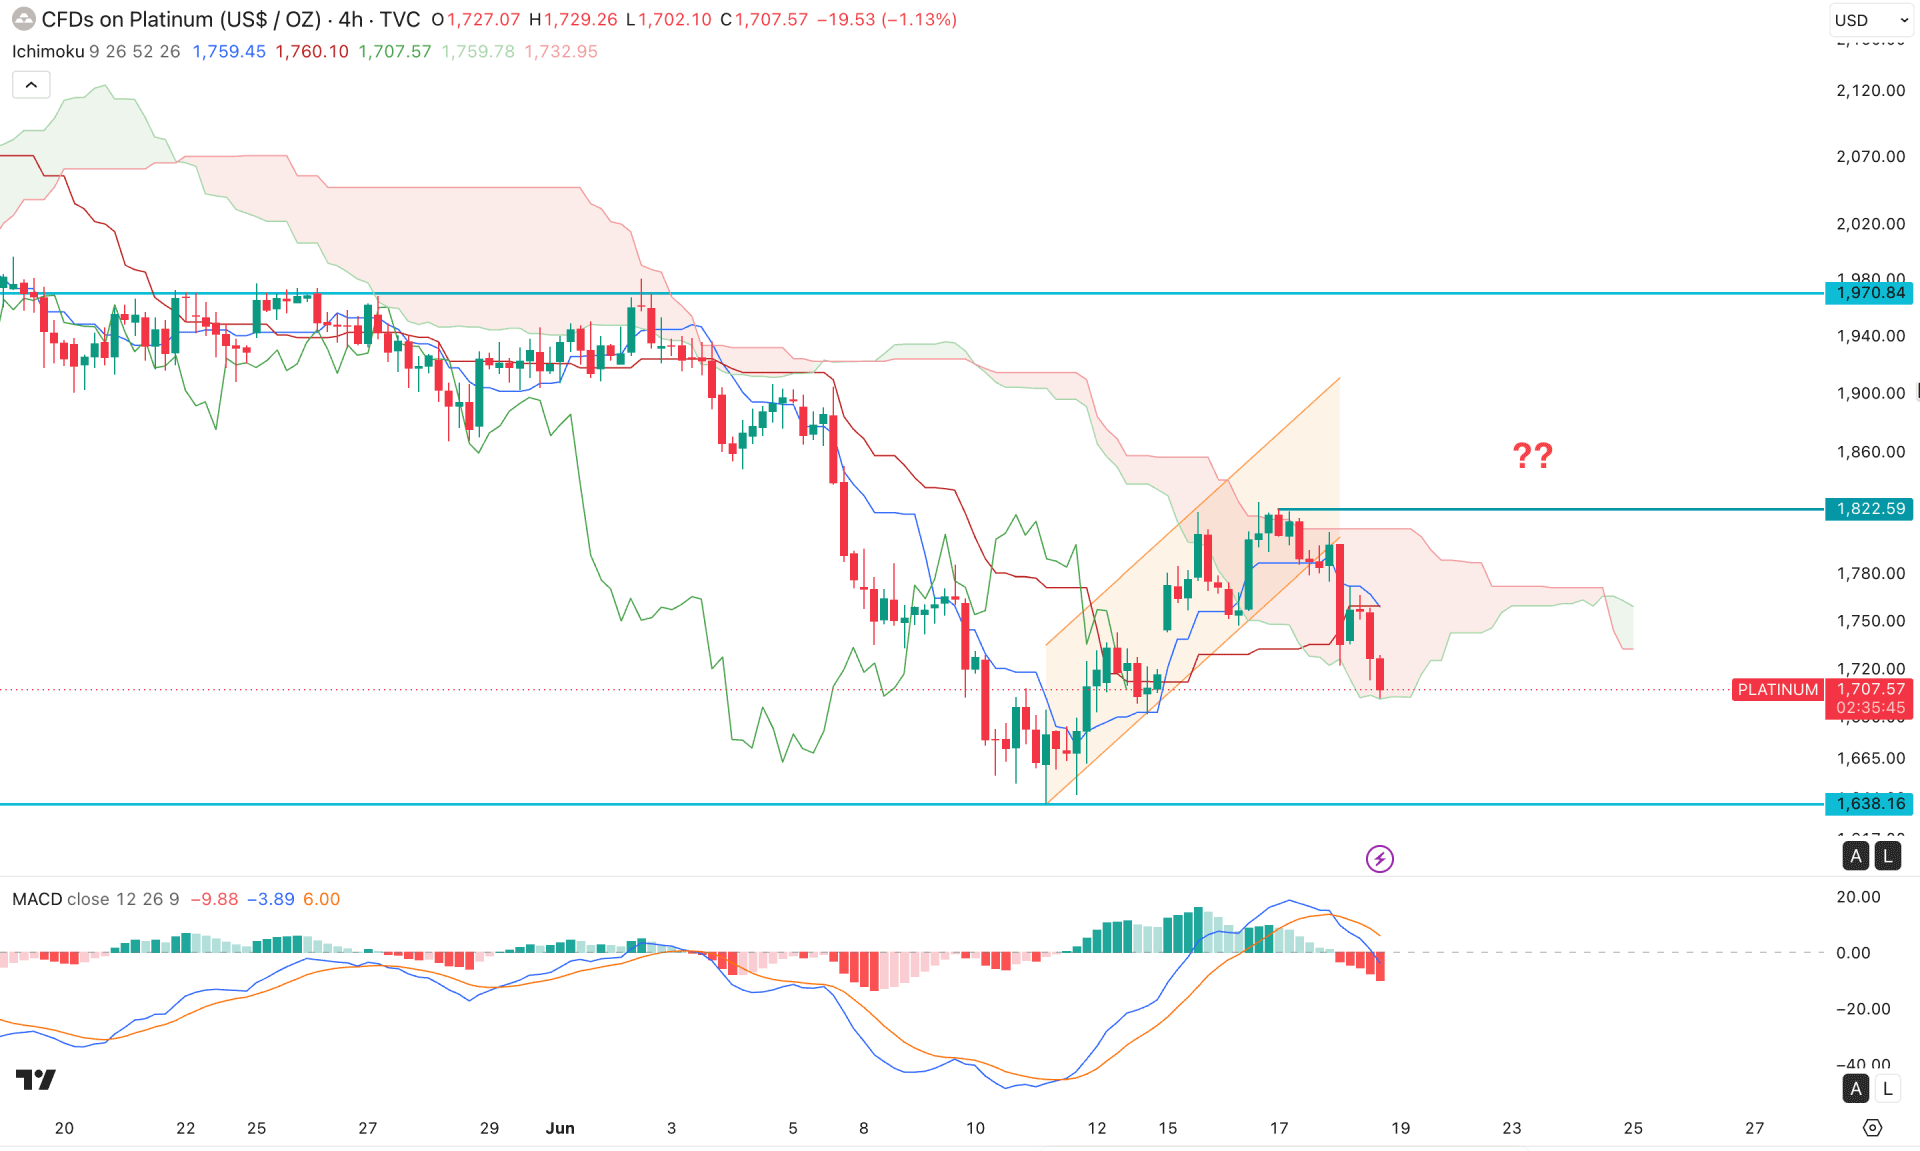
In the four-hour timeframe, the platinum price is having a downward continuation after testing the cloud resistance. The future cloud has flipped position, signaling a corrective market momentum, but dynamic lines are above the current price and working as immediate resistance.
In the secondary indicator, the MACD signal line has formed a bearish crossover at the top, followed by multiple vertical lines in the histogram. It is a sign of active downside pressure with no divergence formation.
Based on the current market structure, the ongoing daily pressure is likely to extend and test the support line marked at the 1638.16 level. However, a minor bullish recovery is possible, and a bear pattern is valid as long as the price remains below the 1822.59 resistance level. Overcoming this line would extend the buying pressure beyond the 2000.00 area.
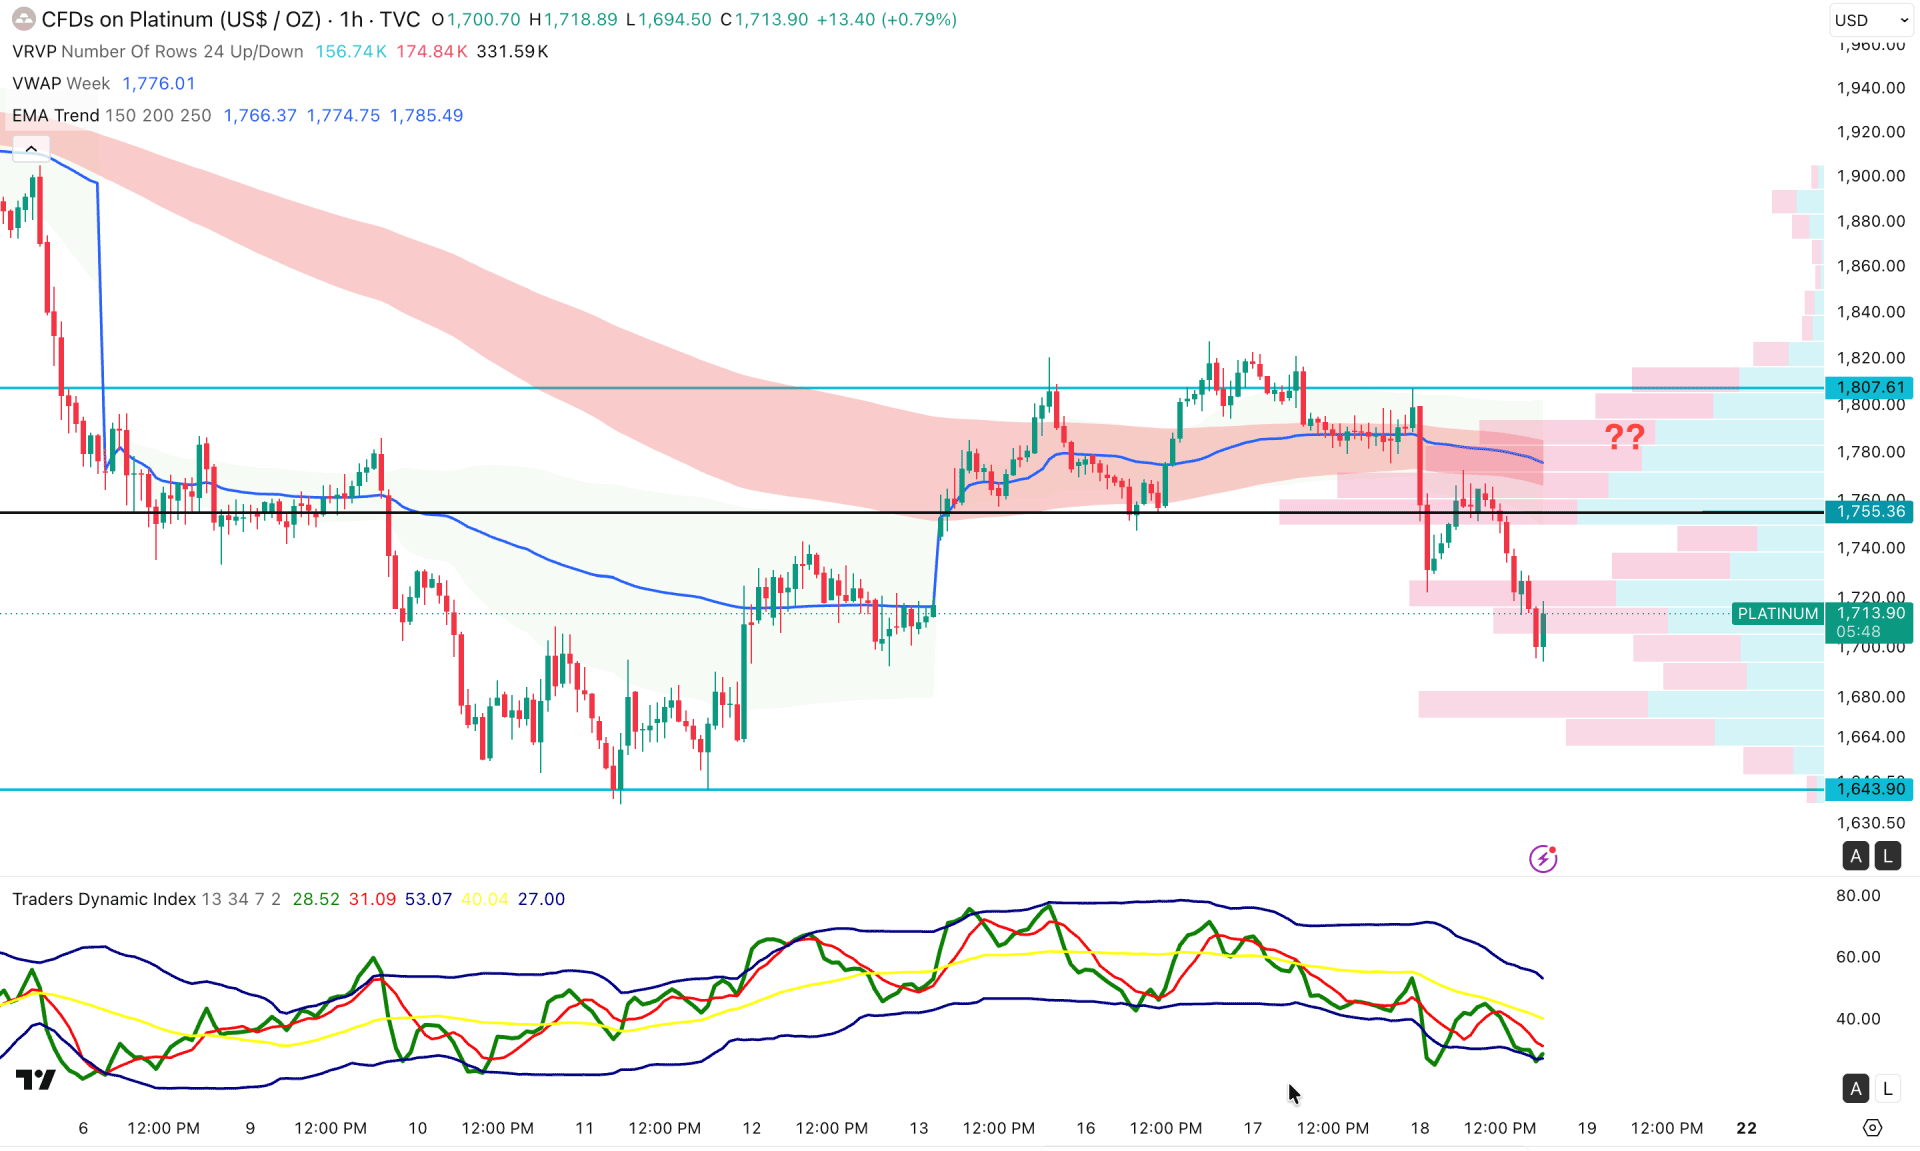
In the hourly timeframe, the intraday selling pressure is solid, as the recent price made consecutive lower lows from the intraday high. Moreover, the intraday high volume line is above the current price, followed by a bearish signal in the weekly VWAP line.
In the secondary indicator window, extreme selling pressure is present, as the Traders Dynamic Index is at the lower band area.
Based on this outlook, the price has more room to move down, but a minor bullish correction is still pending. The immediate support level is marked at the 1643.60 level. However, if it fails to hold below the 1755.00 level, it could eliminate the bear structure and extend the buying pressure in the coming hours.
Based on the overall market structure, XPTUSD is trading within a bearish corrective phase, where the long-term market momentum remains bullish. Investors should closely monitor how the daily chart continues pushing lower and find a bottom before rebounding and following the major market trend.


