
Published: March 21st, 2024
After recent supply shortages, job losses, and impending mine closures in South Africa, platinum and palladium should be recovering. Nevertheless, their lack of action highlights the electric vehicle revolution's significant influence on anticipated demand.
The automotive industry predominantly utilizes platinum and palladium, two closely related metals, in catalytic converters for purifying exhaust emissions. This industry accounts for approximately 80% of palladium consumption and 40% of platinum demand. Significant depletion of this demand will result for each of these metals.
As a result of a 9% decline in 2024, platinum, which fell 8% in 2023, might demonstrate greater resilience. It is the only significant metal among the group whose value is projected to rise from the previous year's levels by 2028.
Until 2028, the World Platinum Investment Council, composed of main Western producers, projects that the industry will incur an average annual deficit of 500,000 ounces. Deficiencies are anticipated to decrease above-ground inventories to six weeks of demand by 2028 from twenty-three weeks after 2023.
Let’s see the upcoming price direction of this instrument from the XPTUSD technical analysis:
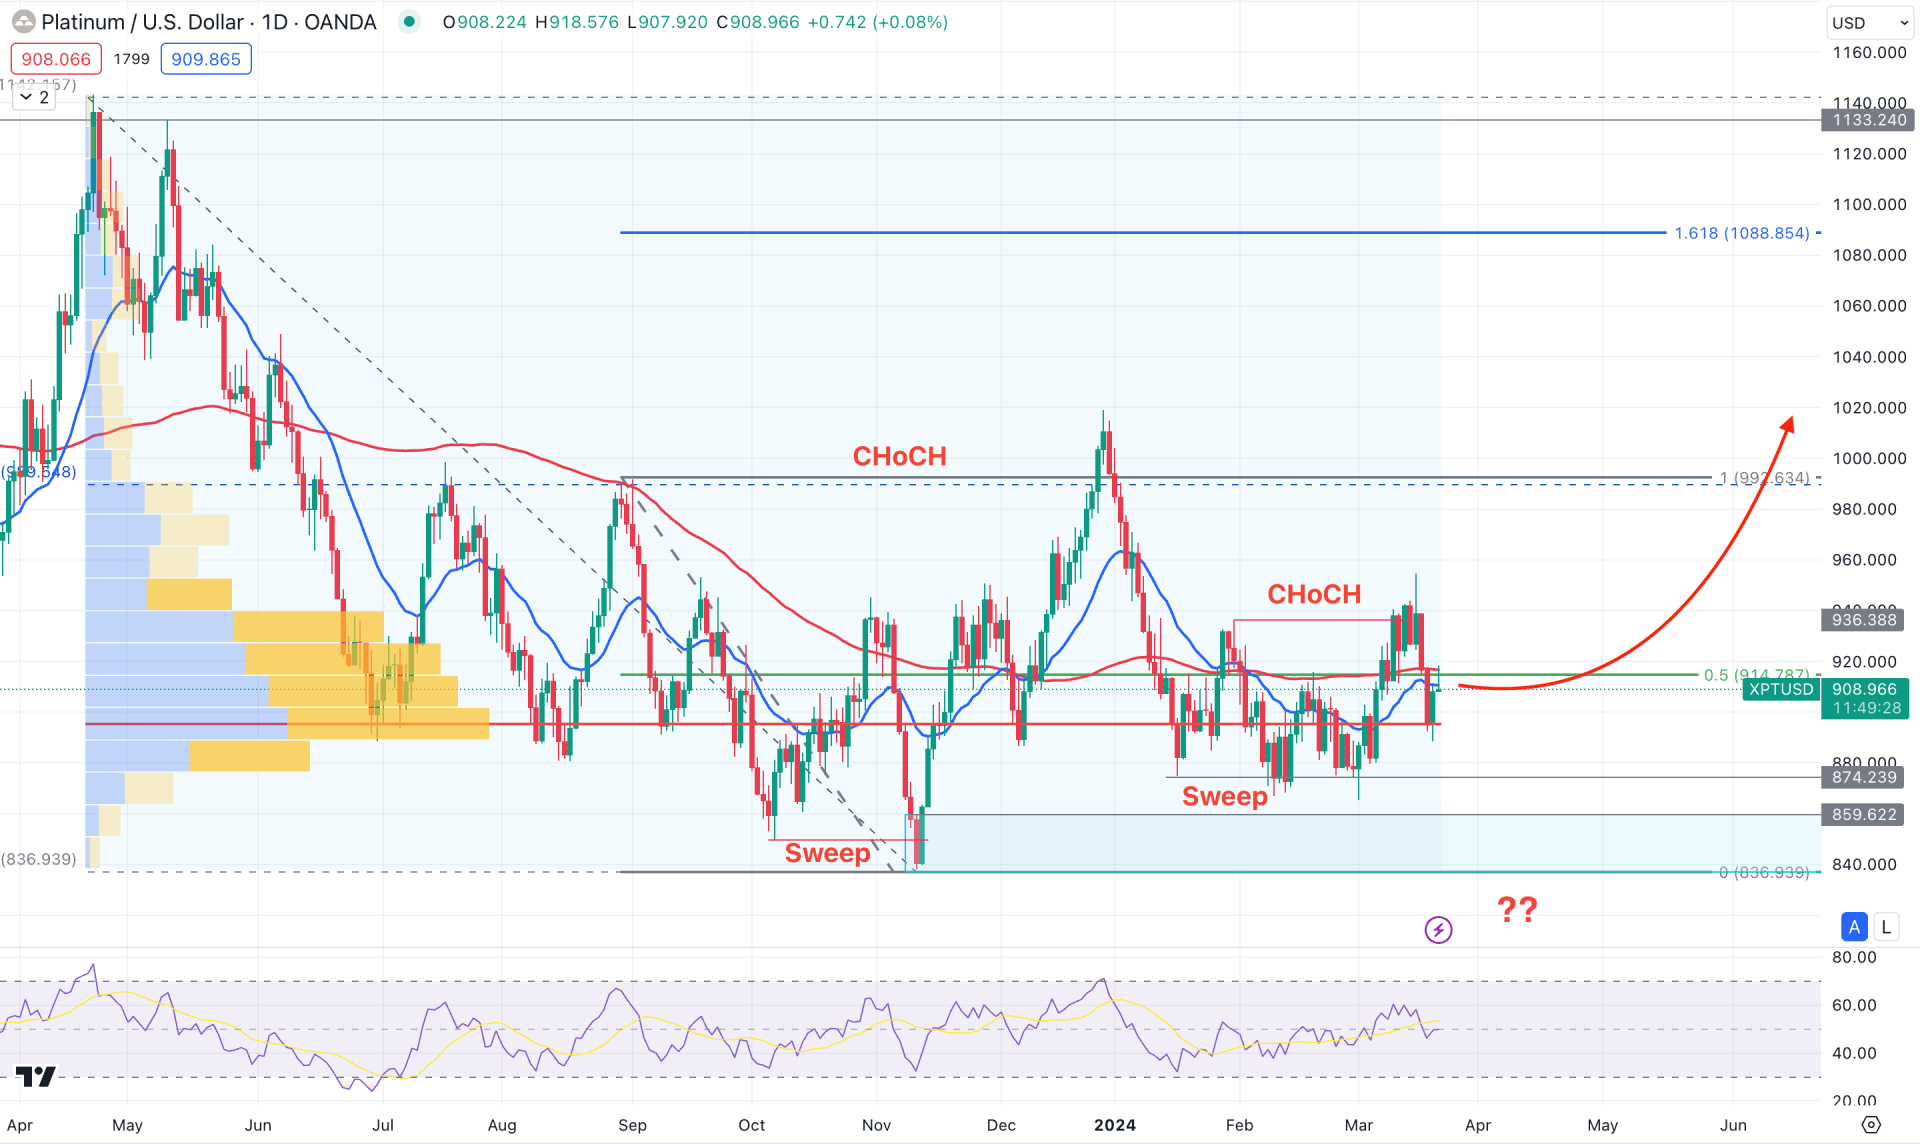
In the daily chart of XPTUSD, consolidation is seen for a prolonged time, which could be a crucial indication of a possible trend formation after a breakout.
In the most recent chart, a bottom is formed at the 836.93 level, which came with sweeping the liquidity from the 849.56 low. Later on, buying pressure from this area formed a new swing high, creating a CHoCH at the 992.63 level. Meanwhile, the buying pressure left the 859.62 to 836.93 area as a valid bullish order block, indicating a strong buyers’ presence. Therefore, the primary intention of this pair is to look for long trades as long as the existing bullish order block is untouched.
On the other hand, the recent price trades below the dynamic 20-day Exponential Moving Average, which indicates indecision. A sideways market is also indicated by the Relative Strength Index, which is neutral at the 50.00 line.
Based on the current daily outlook of XPTUSD, the latest sweep at the 874.29 level could be an early sign of a bullish signal where proper validation is needed. Therefore, the conservative approach would be to open a long position after an immediate daily close above the 930.00 level.
In this context, the latest high volume level could work as an additional confirmation to the possible long opportunity. As per the above image, the high volume level since April 2023 is at 894.73 level, which is just below the current price. Therefore, any buying pressure from the current area could signal institutions' involvement.
On the other hand, a deeper downside correction is possible towards the 850.00 psychological line, from where another bullish daily candle could come. However, any impulsive bearish pressure with a daily candle below the 830.00 level might invalidate the bullish possibility. In that case, a bearish trend trading opportunity could lower the price towards the 700.00 level.
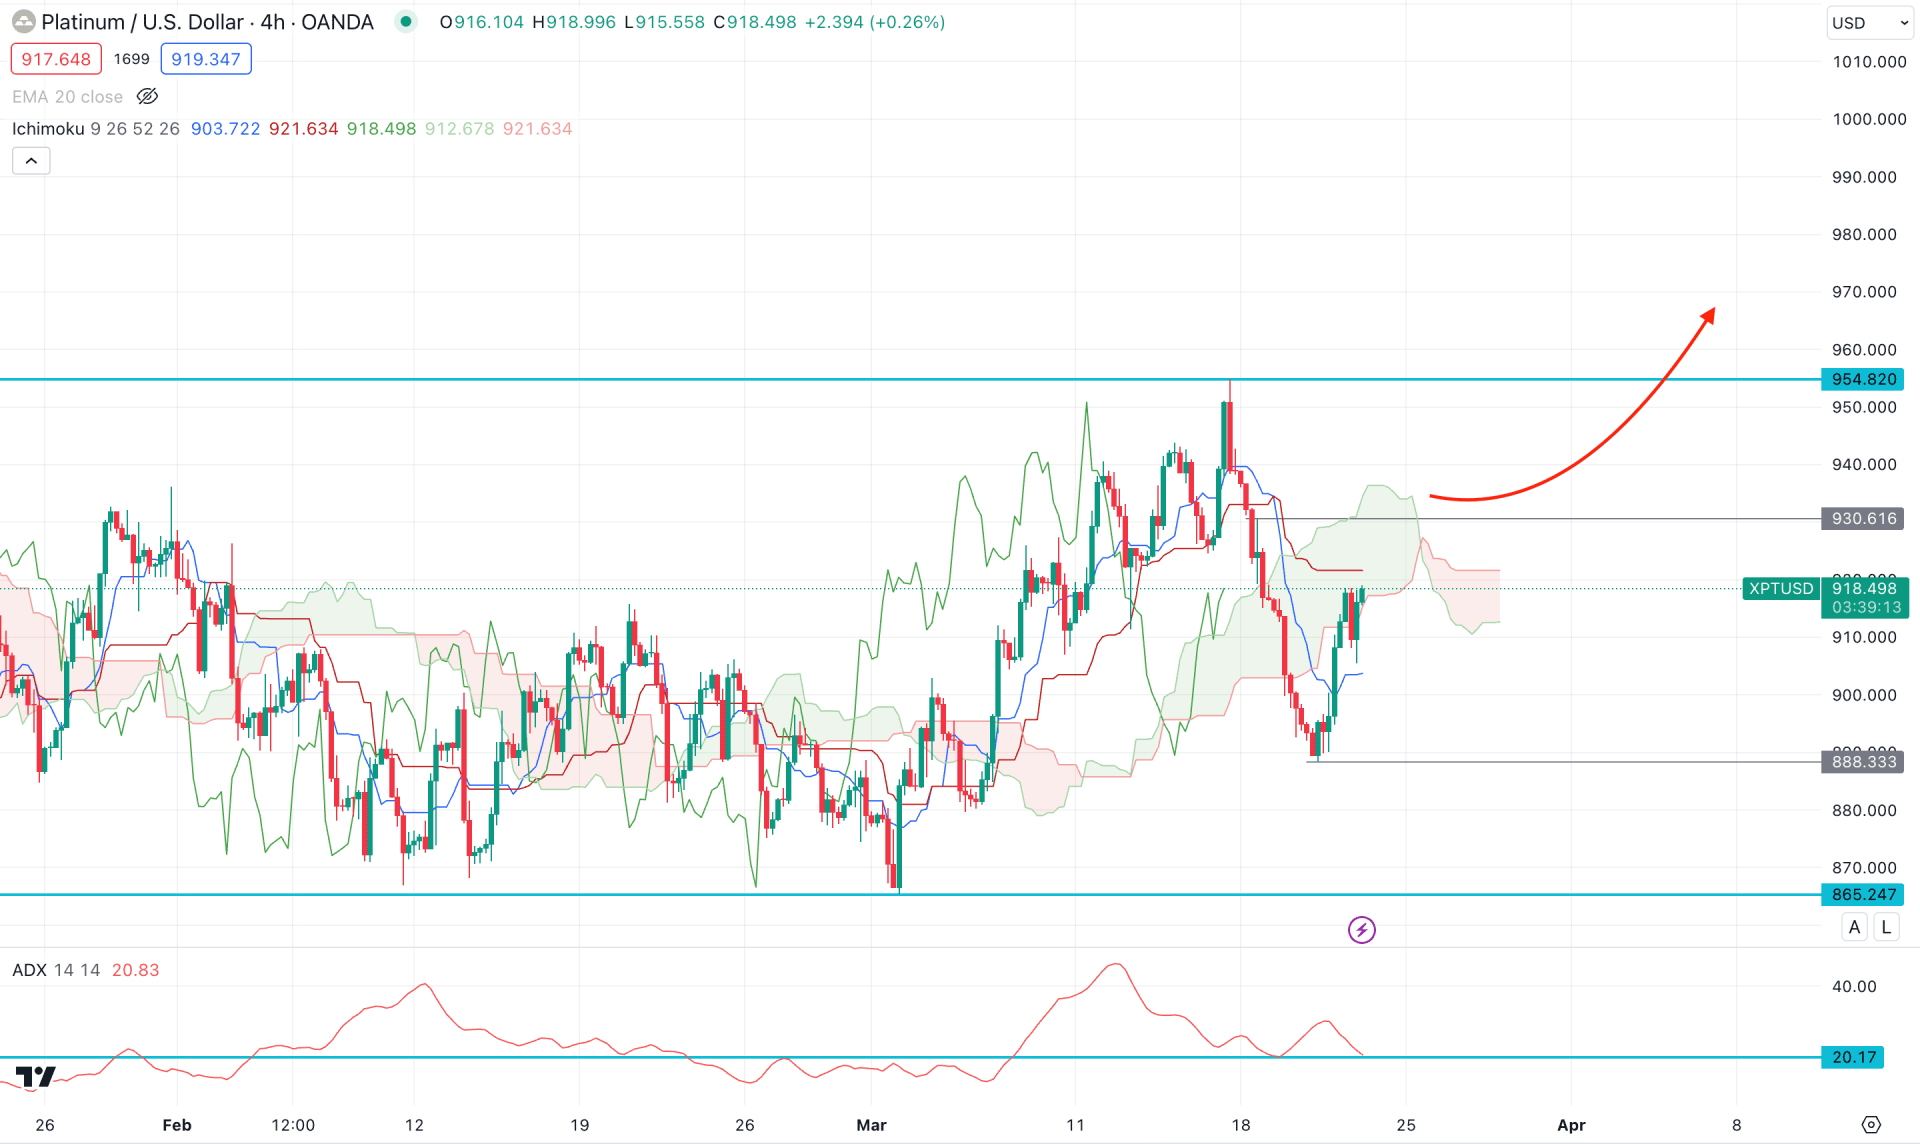
In the H4 timeframe, the recent price shows a consolidation, where the future could be bearish. Although the most recent price hovers below the dynamic Ichimoku Cloud zone, a considerable upward correction is needed before anticipating a short opportunity.
On the other hand, the daily market trend is bullish, where a bullish rebound is also possible to offer a trend trading opportunity.
In the indicator window, the Average Directional Index (ADX) shows a corrective momentum, as the recent reading shows a downward slope at the 20.00 line. In that case, a rebound from the 20.00 line would be a crucial indicator for this instrument to look at.
Based on the H4 structure, the bullish rebound with an H4 candle above the 930.61 level could be a high probability of a long opportunity, targeting the 1000.00 level. However, an immediate selling pressure below the Kijun Sen line could indicate a bearish opportunity targeting the 865.24 support level.
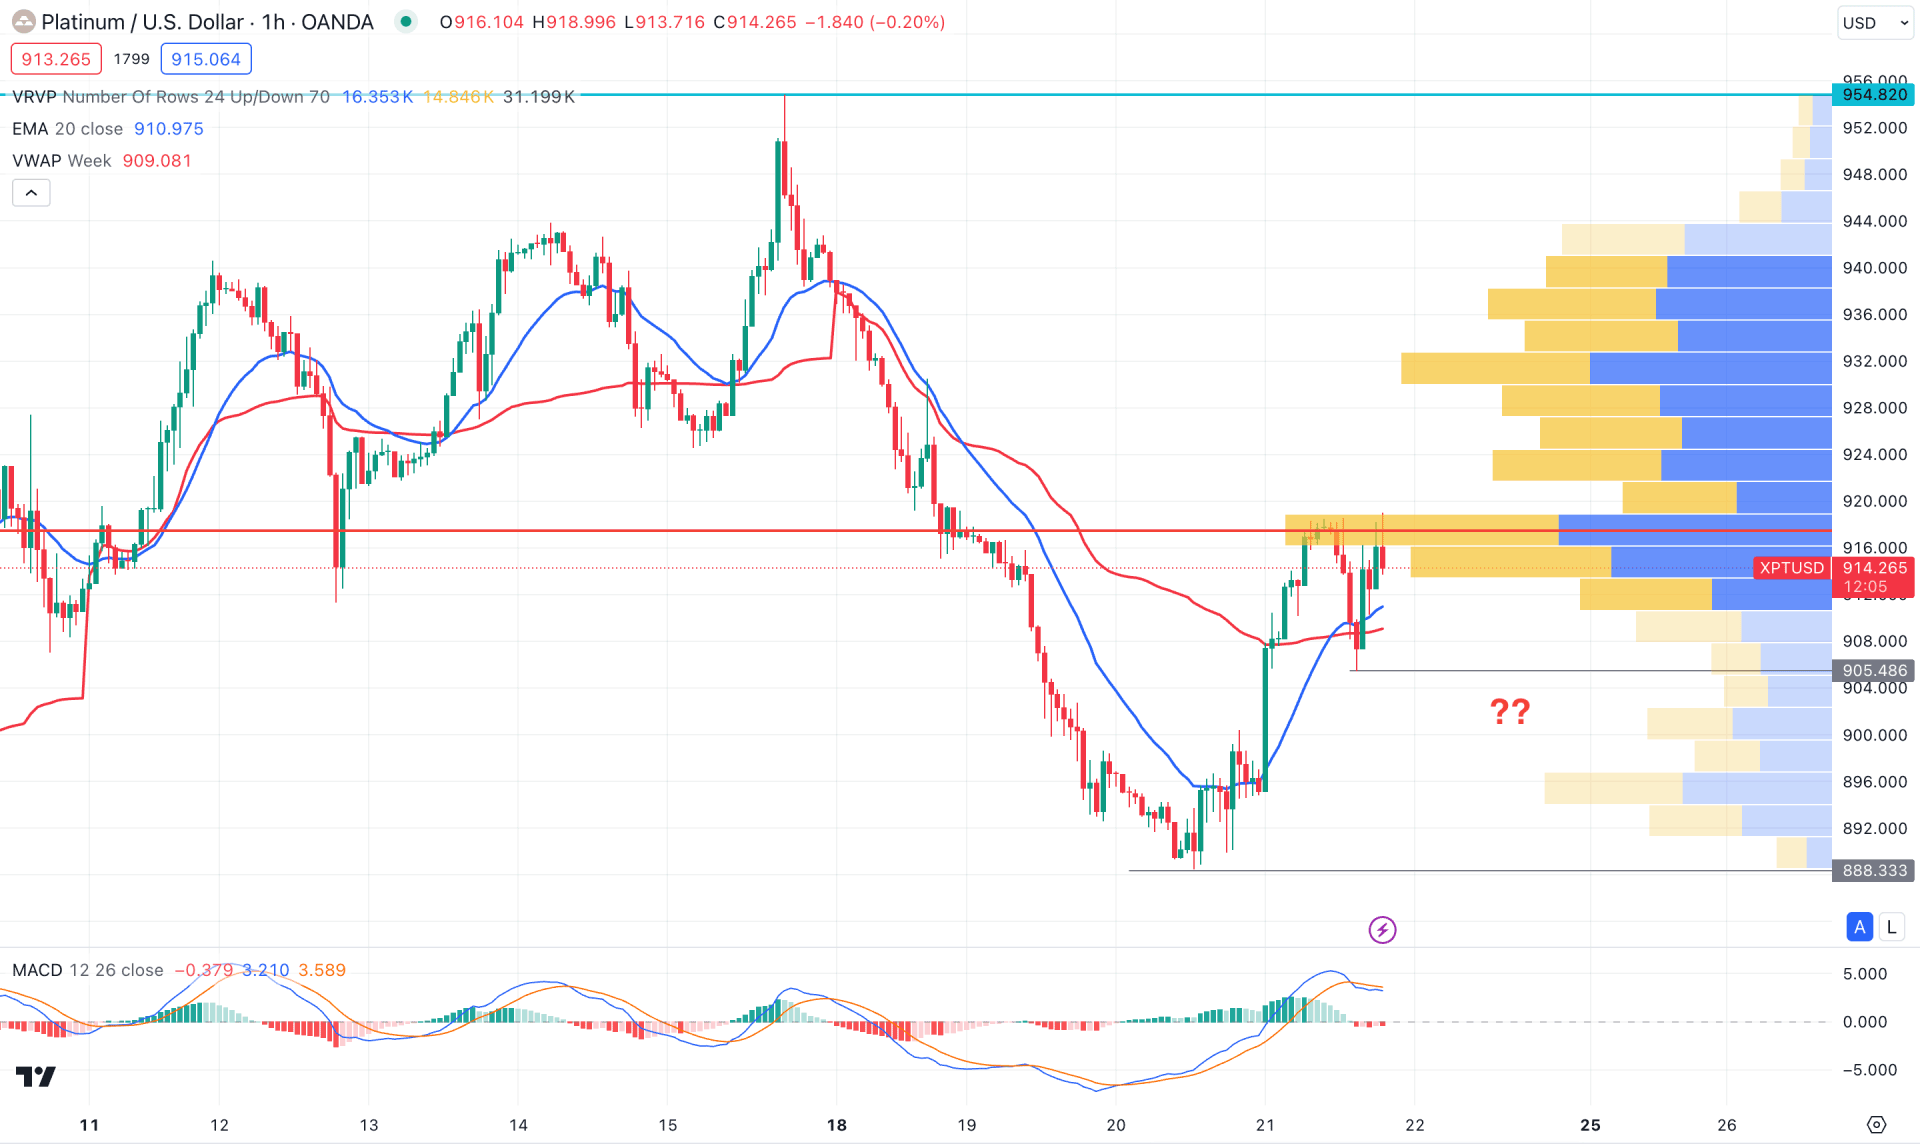
The overall market momentum is bearish in the hourly time frame as the recent price trades below the intraday high volume level. However, a bullish crossover is visible among dynamic lines, which suggests a possible bullish reversal.
The MACD Histogram is bearish in the indicator window, where the recent level fails to make a new low. In this context, a bullish rebound is more likely to indicate a trend reversal. An hourly close above the 920.00 level could be a potential long opportunity for this pair.
On the other hand, the intraday market is still bearish, and a bearish continuation is potent as long as the price trades below the dynamic 20 EMA line.
Based on the ongoing market structure, XPTUSD has a higher possibility of showing a bullish signal after forming a valid range breakout from the 100 day SMA line. However, the intraday market is still bearish and investors might expect a bottom to be formed before offering a long signal.


