
Published: March 10th, 2020
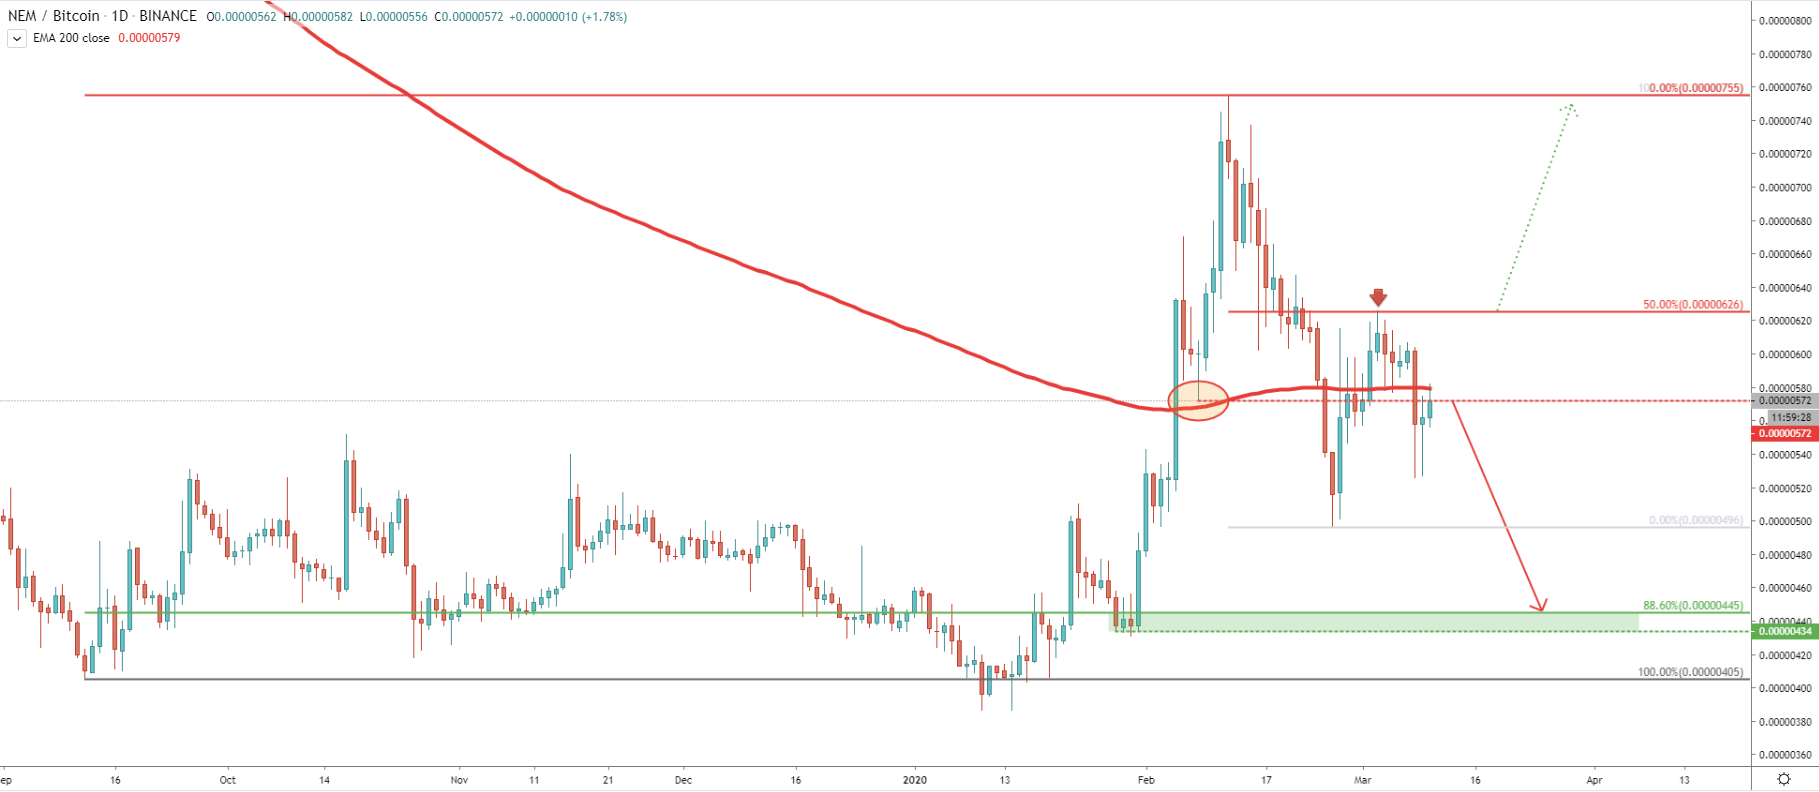
On the Daily chart, we can see the recent rally of XEM/BTC. In just under 1 month, the price went up from 387 to 755 satoshis. NEM (XEM) managed to outperform the Bitcoin by 95%, in other words, those who bought NEM would have double the amount of Bitcoins they had.
Although rally didn’t last that long and after hitting 755 sats high, prise went down as sharp as it was rising. Within the 14-day period, the price dropped by 34% and tested 496 satoshis low. Corrective wave up followed where we can witness a very clean bounce off the 50% Fibonacci retracement level at 626 satoshis. But what is also important, is that price failed to break and close above the 200 Exponential Moving Average. Yes, there was a spike above the EMA, but there was no close above the high produced on that spike.
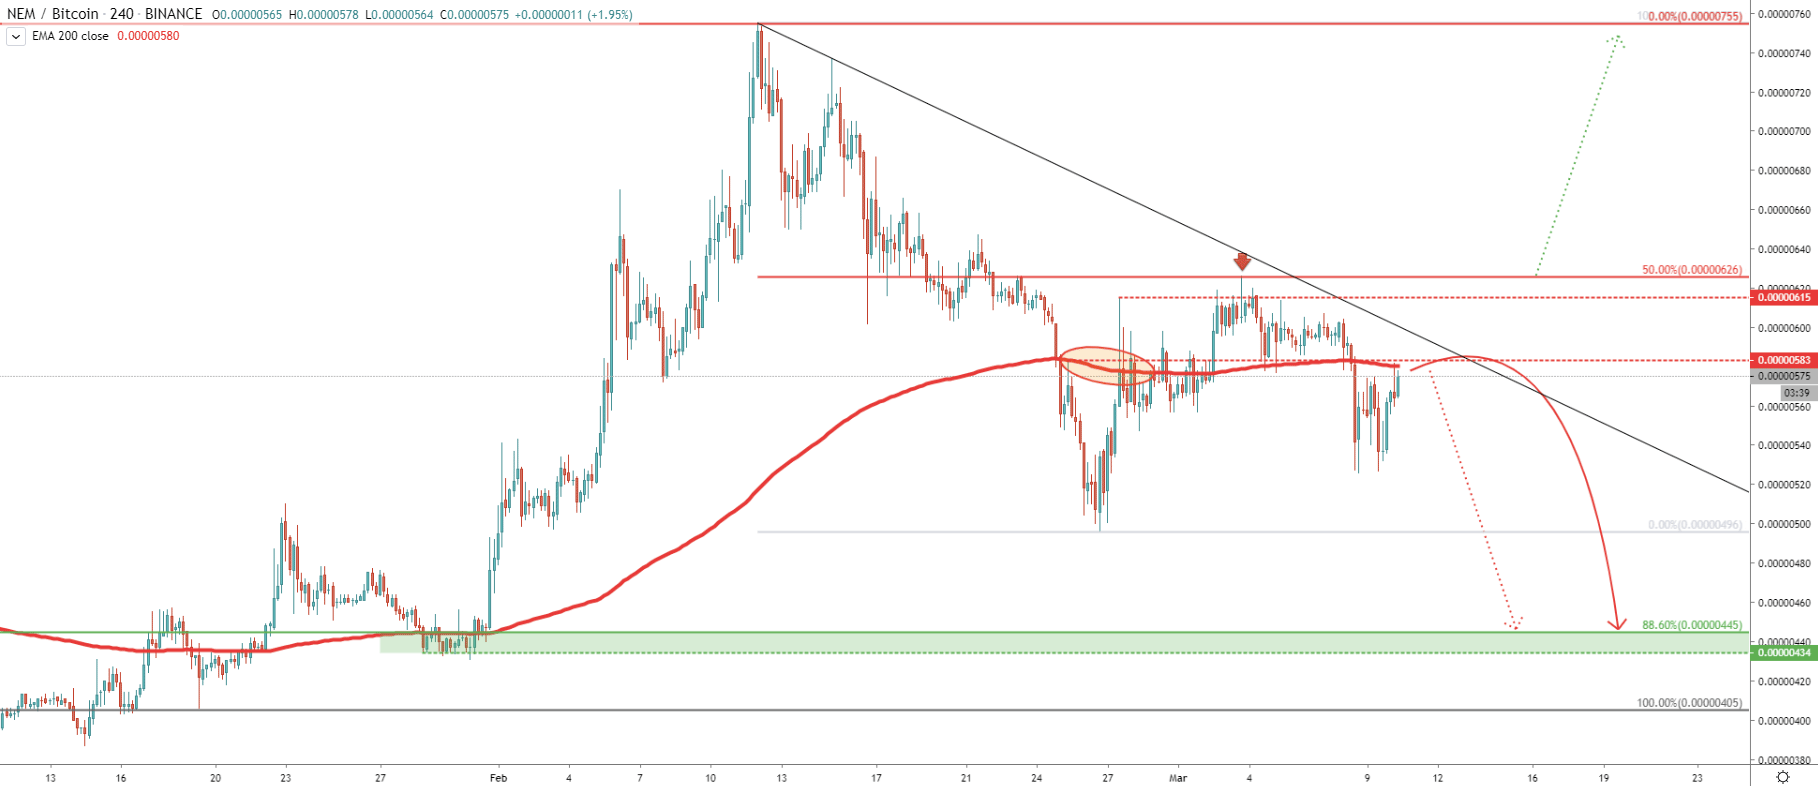
On the 4h chart, we can see that XEM/BTC has started to produce lower lows and lower highs, suggesting the validity of a downtrend, or an ongoing corrective wave down after February rally. On this timeframe price did almost exactly the same as on the Daily timeframe. XEM/BTC produced the spike above the 200 EMA, but failed to close above the high of that spike. In other words, the 200 EMA is still a valid resistance and currency pair trades below that level. But what is also important, is that today NEM rejecting the 200 EMA, and we already can see a clean bounce of 583 satoshis, which previously, in fact, was also level of resistance.
Therefore, while price remains below the key resistance at 626 satoshis, we can expect further decline. Price can be heading towards the 88.6% Fibonacci retracement, which is 445 satoshis area. But at the same time, more range trading can take place prior to the price moving down. XEM/BTC could continue range trading until it hits the downtrend trendline.
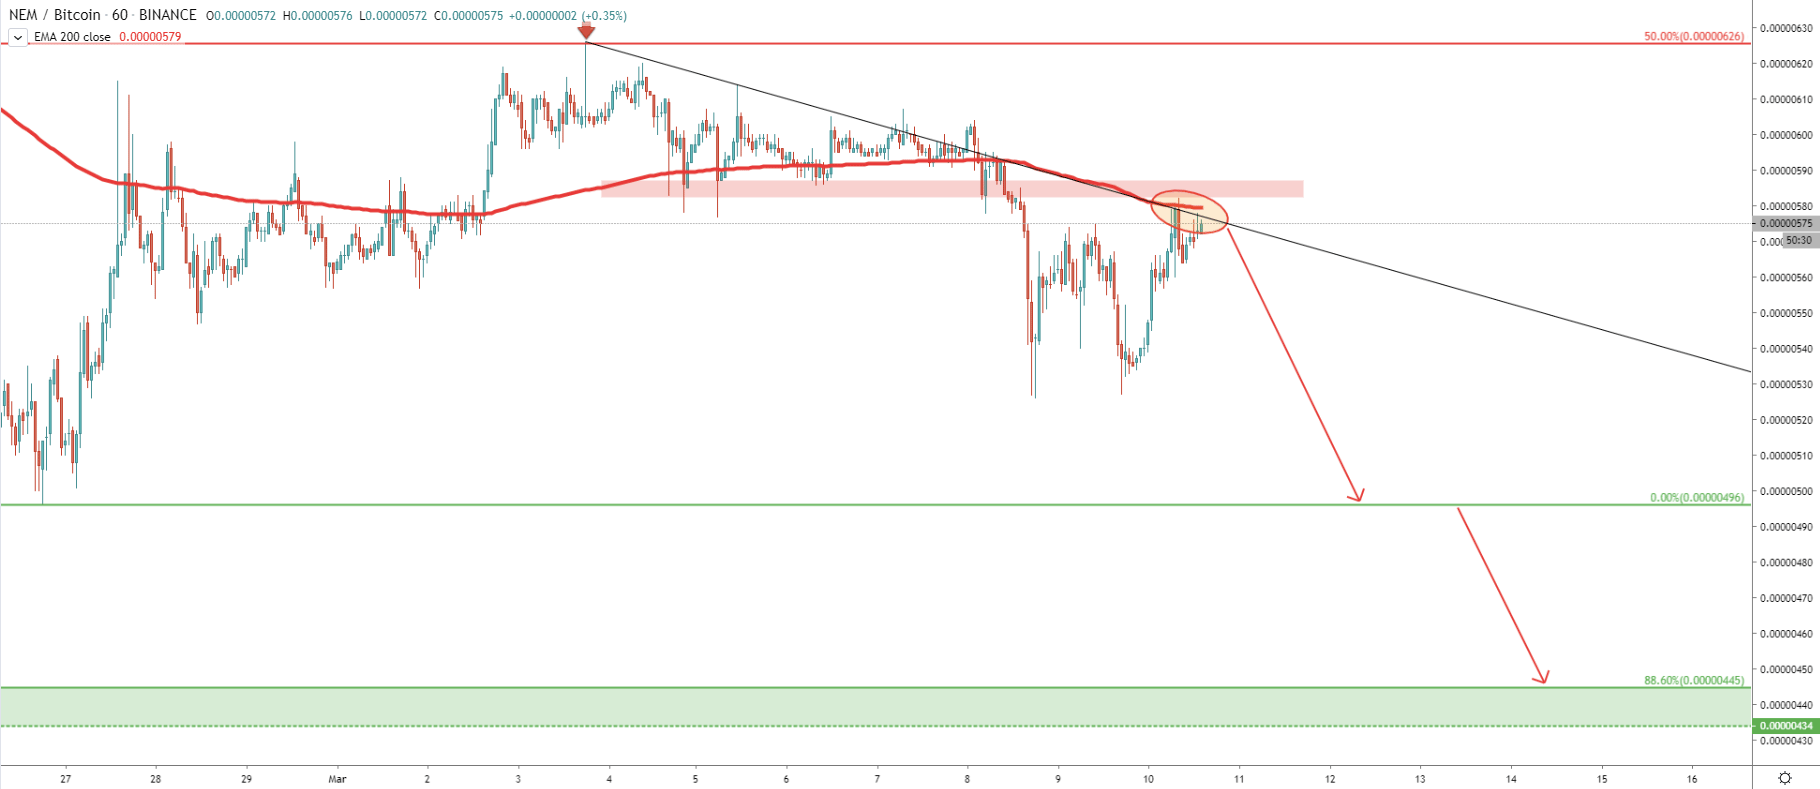
On the 1H chart, Price did bounce off the downtrend trendline along with the 200 EMA. Also, we can see that currently, NEM entered the resistance zone, which just recently was acting as the support. It seems that current prise could be very attractive for sellers, and slowly but surely XEM/BTC can be pushed down.
The first support level is seen near 500 satoshis psychological support, where price bounced off back on February 26. This could be the profit taking level for bears, although if broken, price should drop down to 435-445 satoshis area, which is 88.6% Fibonacci retracement level.
XEM/BTC could be taking a break after the recent rally as price action insisting on strong downside pressure being built. Pair is trading at the strong supply zone, which could be the selling point for institutional investors.
There are two main downside targets. First is being 500 satoshis psychological support. Second is 88.6% Fibonacci retracement level at
The only way price might start rising is daily break and close above 626 satoshis resistance. At this point, it remains the key level to watch for the breakout. At the same time. 1h break and close above the 200 EMA could be the first sign of NEM gaining more power against the Bitcoin.
Support: 496, 445, 435 satoshis
Resistance: 580, 626, 755 satoshis


