Published: April 29th, 2025
The XDC Network provides the technical underpinnings for institutional-grade tokenisation on the distributed ledger side. XDC distinguishes itself as an open Layer 1 blockchain by fusing enterprise-level efficiency with the advantages of decentralisation. The decentralised proof-of-stake (dPoS) consensus approach used by XDC makes transactions quick, inexpensive, and energy-efficient. When managing large-volume asset transfers, settlement times are seconds, and transaction costs are almost nonexistent.
In addition to performance, XDC conforms with ISO 20022 and MLETR regulations, aligning it with global financial institutions' regulatory requirements and communications. The network is an associate of the International Trade and Forfaiting Association (ITFA) and participates in industry initiatives, including the Trade Finance Distribution (TFD) Initiative.
The operation will be conducted on XDC Network, a layer-1 public ledger that facilitates the tokenization of tangible assets (RWA), which is significant evidence of Brazil's unparalleled international expansion in the RWA sector. The network's position as the go-to blockchain system for financial organisations seeking security and liquidity is also strengthened. The first issue is scheduled to begin within the next ninety days.
Agribusiness instruments, corporate loans, receivables, private credit, and real estate assets will all be issued as part of the strategic cooperation amongst these RWA initiatives. The provisions specify that enterprises of all sizes and sectors will be the primary issuers. Also, after the first issue in Brazil, preparations will be launched for further worldwide expansions.
Let's see the further outlook from the XDC/USDT market analysis:
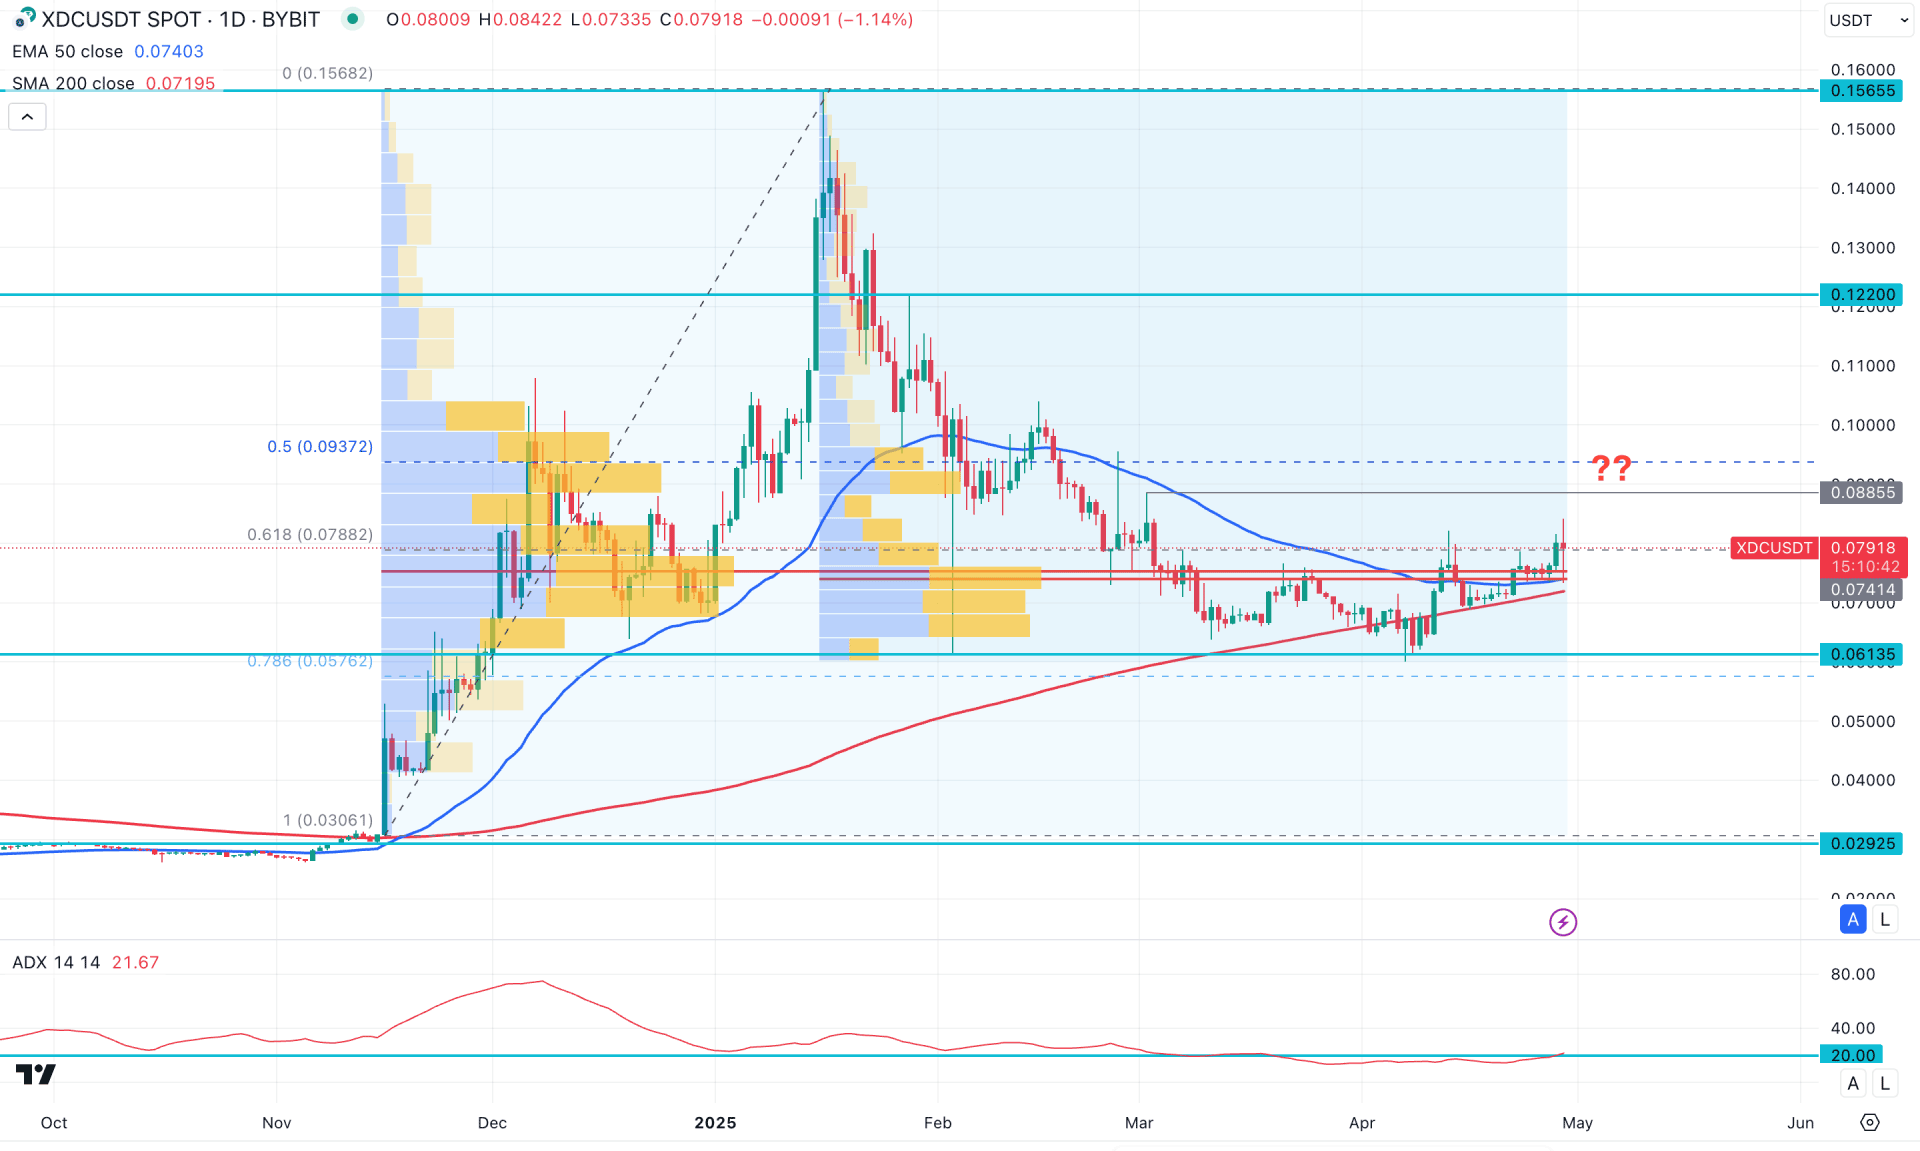
A strong pump-and-dump pattern is visible on the daily chart of XDC/USDT, with the current price hovering around a crucial discounted zone. If the price remains below the key Fibonacci retracement level, we may expect the bullish trend to continue, pending valid confirmation.
The bullish outlook remains significant on the higher time frame, as the recent price action has absorbed sufficient liquidity from the March 2025 low. The price is hovering near the March 2020 opening area, with the key monthly resistance at the 0.0880 level. A confirmed breakout above this resistance with a valid monthly close could present a potential long opportunity, though further confirmation from lower time frames is advised.
The weekly chart indicates sideways movement following a test of the 0.0613 bottom. However, the high-volume node from November 2024 lies below the current price and within the existing consolidation zone. A range breakout on the buyer side, supported by high-volume accumulation, could be another potential long entry.
On the main price chart, the 200-day SMA remains steady below the current price, acting as strong dynamic support. This suggests a potential range breakout from above, further strengthening the bullish bias.
In the secondary indicator window, the Average Directional Index (ADX) has returned above the 20.00 level after three months, signalling a corrective trend that could potentially shift into a stronger directional move.
Based on the daily market outlook for XDC/USDT, a strong bullish opportunity is present, supported by both rising dynamic support and static high-volume zones. If the price holds above the 0.0700 psychological level, we may expect a bullish continuation toward the 0.1220 area. In this scenario, a breakout above the 0.0885 resistance level could serve as a conservative long entry, targeting the 0.1400 zone.
On the other hand, investors should closely monitor how the price behaves if it dips below the 200-day SMA. A valid breakdown with consolidation below the 0.0700 level could present a short-term bearish opportunity, targeting the 0.0500 level.
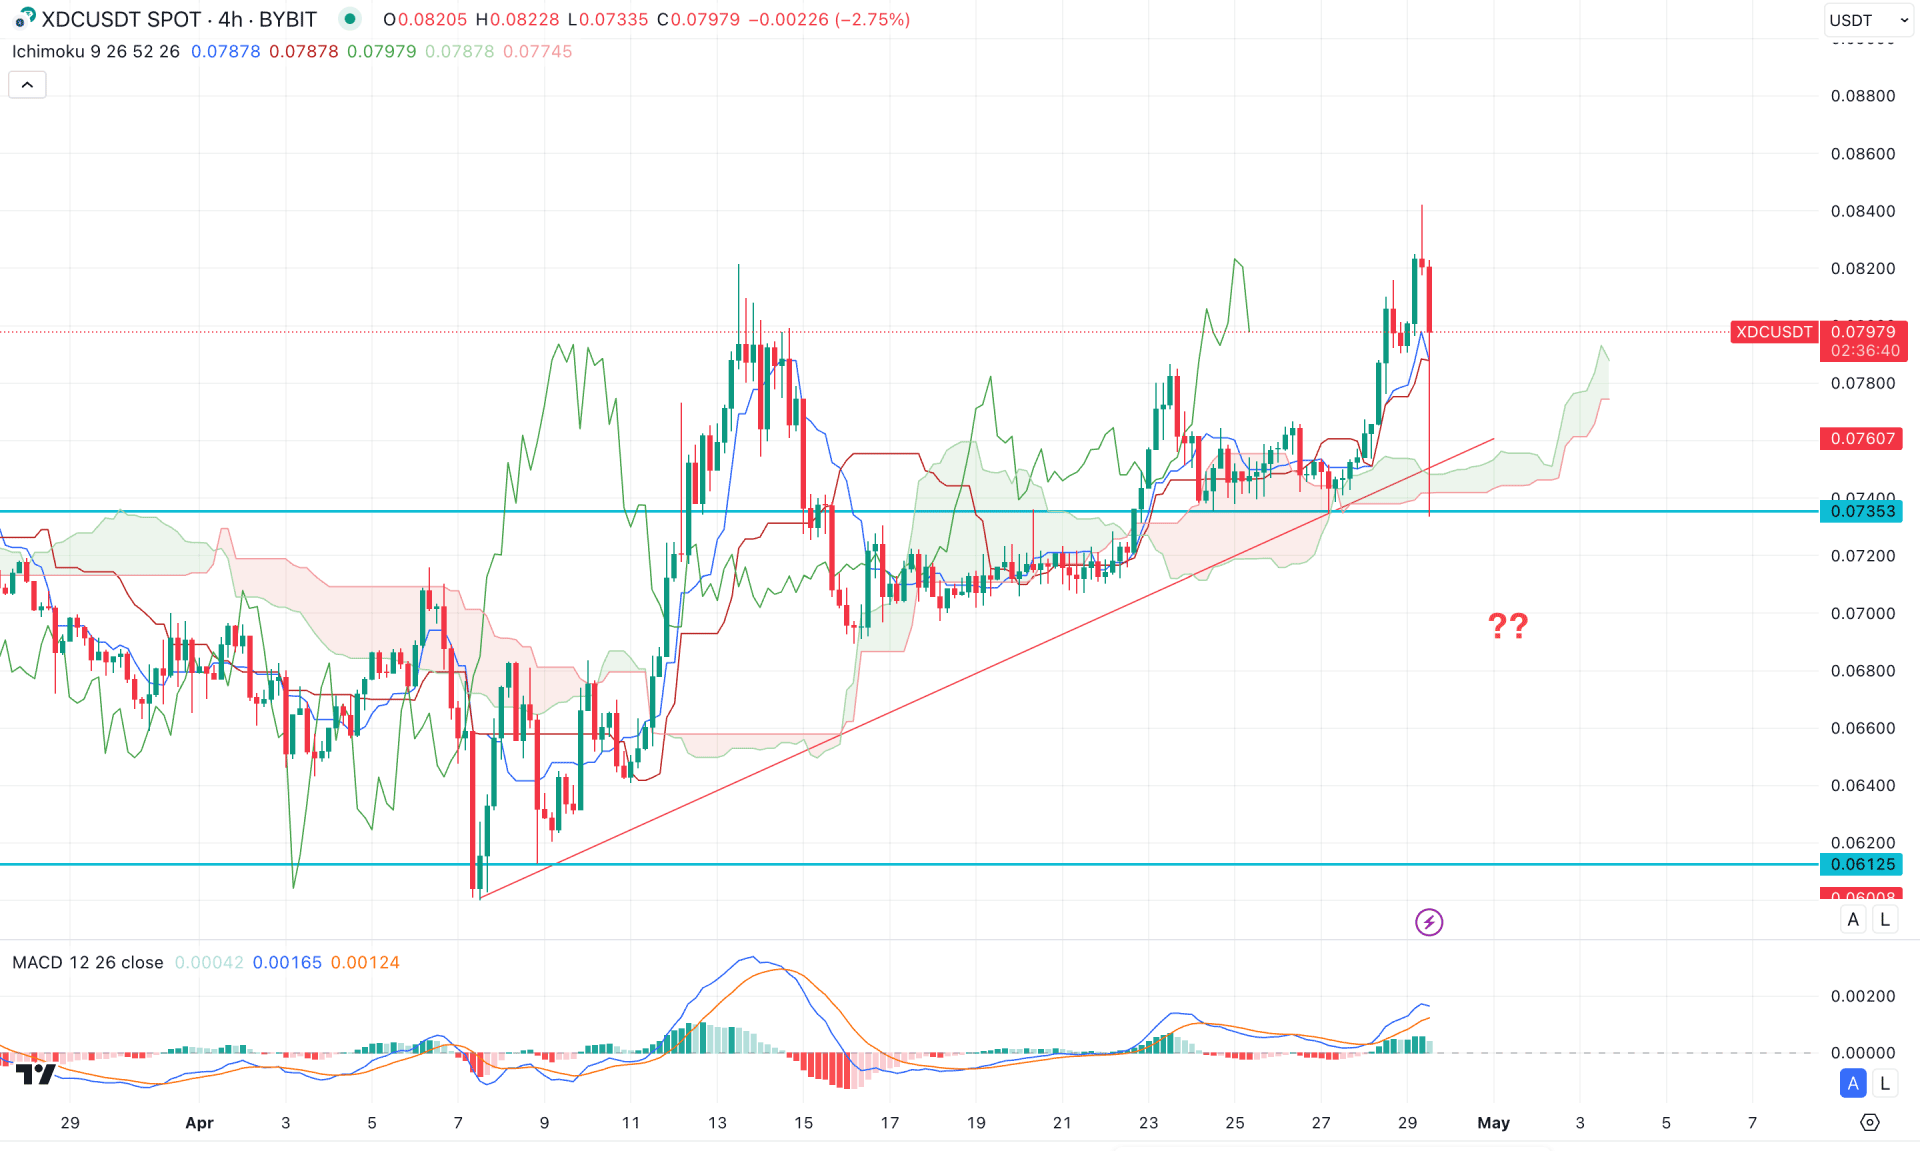
In the H4 timeframe, XDC/USDT is trading within a bullish pressure as multiple higher highs are visible above the Cloud zone. Moreover, the Future Cloud looks positive, where both Senkou Lines are heading upwards.
In the secondary indicator window, there is a bullish signal as the MACD signal lines are hovering above the neutral point for a considerable time. Moreover, the Signal line is in the bullish zone, suggesting a possible bullish continuation.
Based on the H4 outlook, XDC/USDT is more likely to extend the buying pressure, supported by the rising trendline. In that case, the ongoing buying pressure could extend and find resistance from the 0.0880 psychological level.
On the other hand, failing to hold the price above Cloud support could reverse the market momentum and lower the price towards the 0.0612 support level.
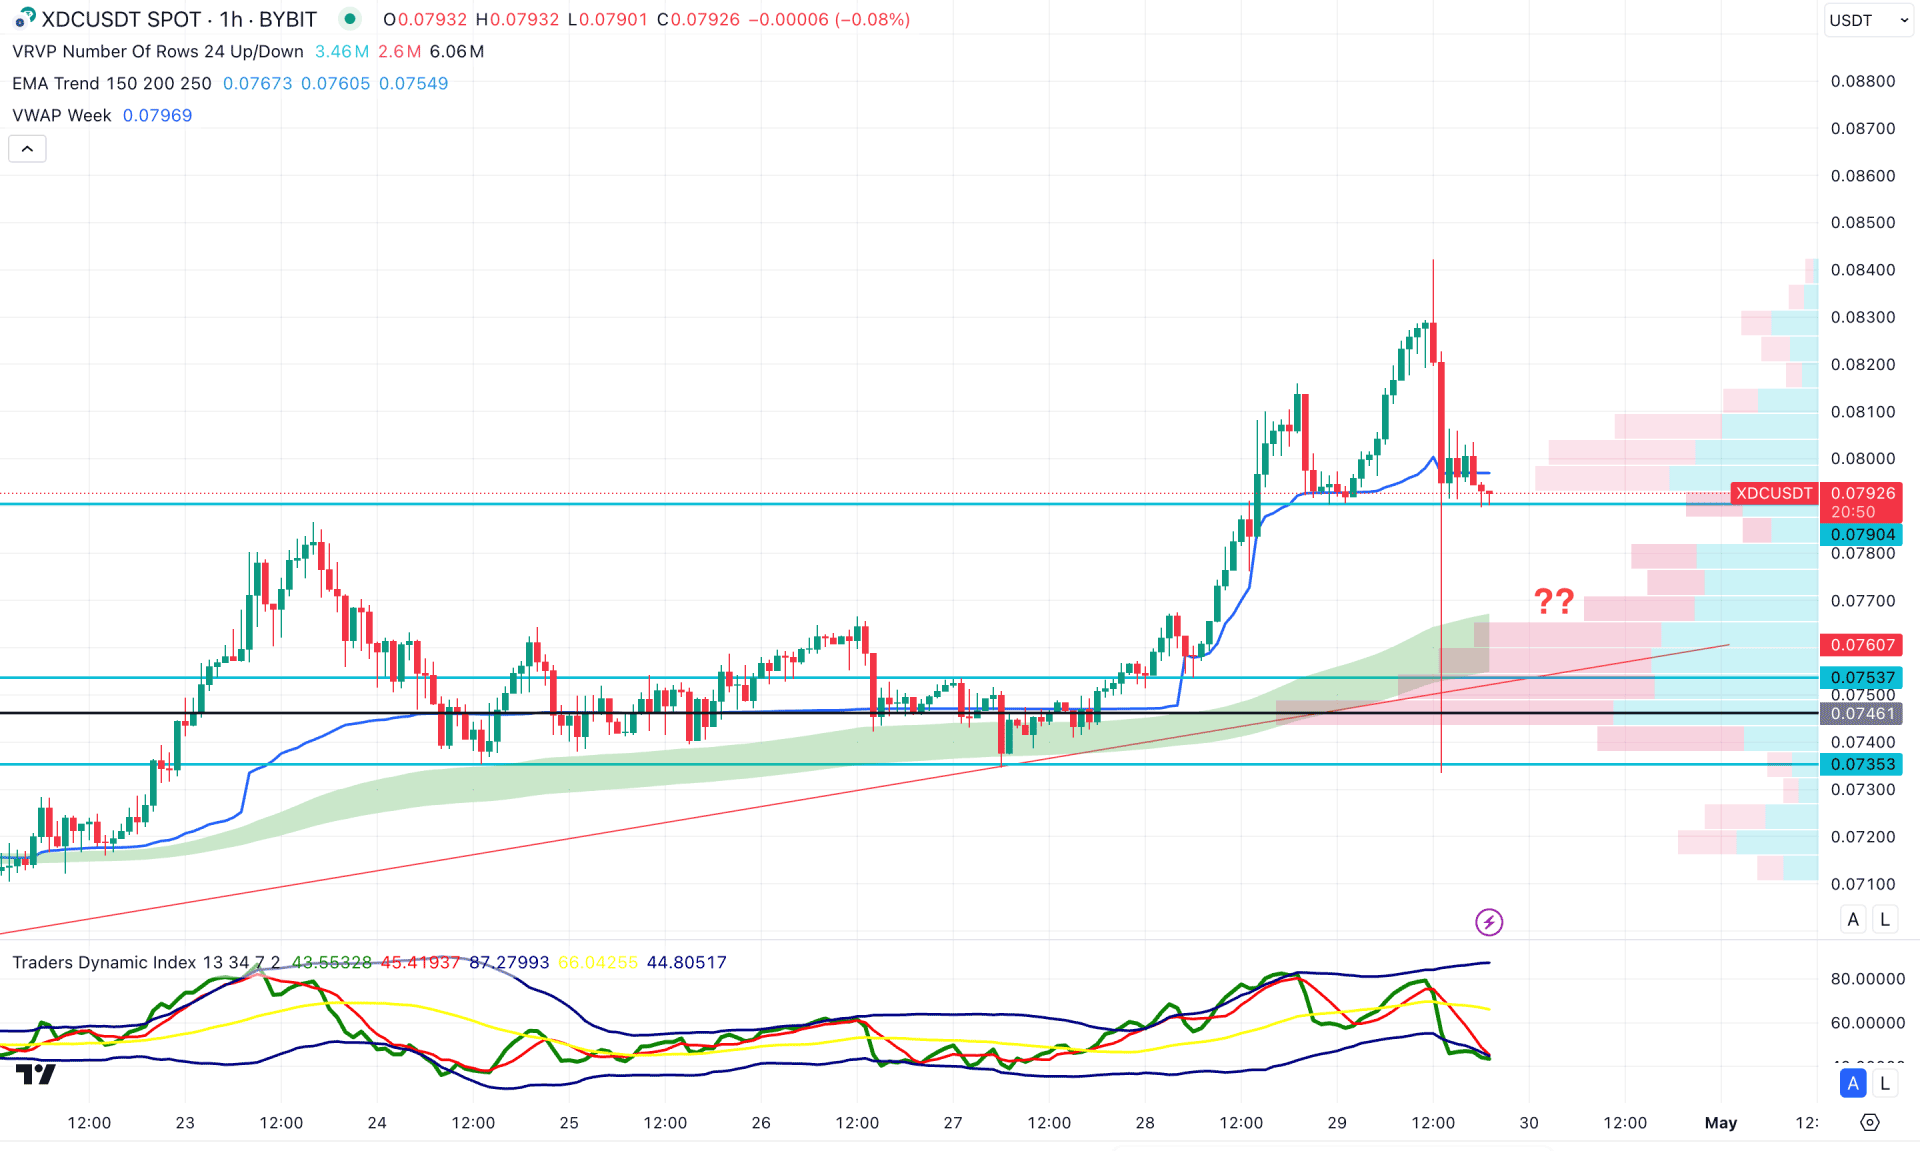
In the XDC/USDT H1 chart, the high volume level shows ongoing bullish market pressure. Moreover, the EMA wave supports the buying pressure by remaining below the current price.
On the other hand, the Traders Dynamic Index (TDI) remains below the neutral 50.00 level, signalling a selling pressure in the market.
Based on this outlook, any intraday dip could be a potential long opportunity in this pair, but a long-term bullish signal might come after having a range breakout.
A selling pressure below the 0.0780 level with a rebound above the VWAP line could be a long opportunity in the intraday chart.
The broader market outlook for XDC/USDT is bullish, as the current price is hovering at the crucial optimum price zone. In that case, the primary aim is to find a short-term long opportunity from the intraday chart until a range breakout appears.


