

Published: November 12th, 2026
Gold extends its losing streak for a third consecutive session, falling further below the $3,950 level. Besides, the US rate hike, the escalating tensions in the Middle East are providing additional support to the safe-haven dollar.
The US Consumer Price Index (CPI) data for October strengthened expectations of further monetary tightening by the Fed. Hawkish Fed comments have also reinforced market expectations of another interest rate increase in December.
At the same time, geopolitical concerns continue to influence market sentiment. The US and Iran have reportedly carried out attacks on islands along the strategic waterway in recent days. Adding to tensions, Iranian Armed Forces Deputy Chief of Staff Brigadier General Kioumars Heidari said the strategic passage remains closed and would reopen only on an order from Iran's supreme leader.
Against this backdrop, the US Dollar Index (DXY), which measures the dollar against a basket of major currencies, has climbed to its highest level since April 2025, strengthening the outlook for further gains. Continued dollar strength suggests that gold may remain under selling pressure, with any recovery attempts potentially attracting fresh sellers.
Let's see the further aspect from the XAUUSD technical analysis:
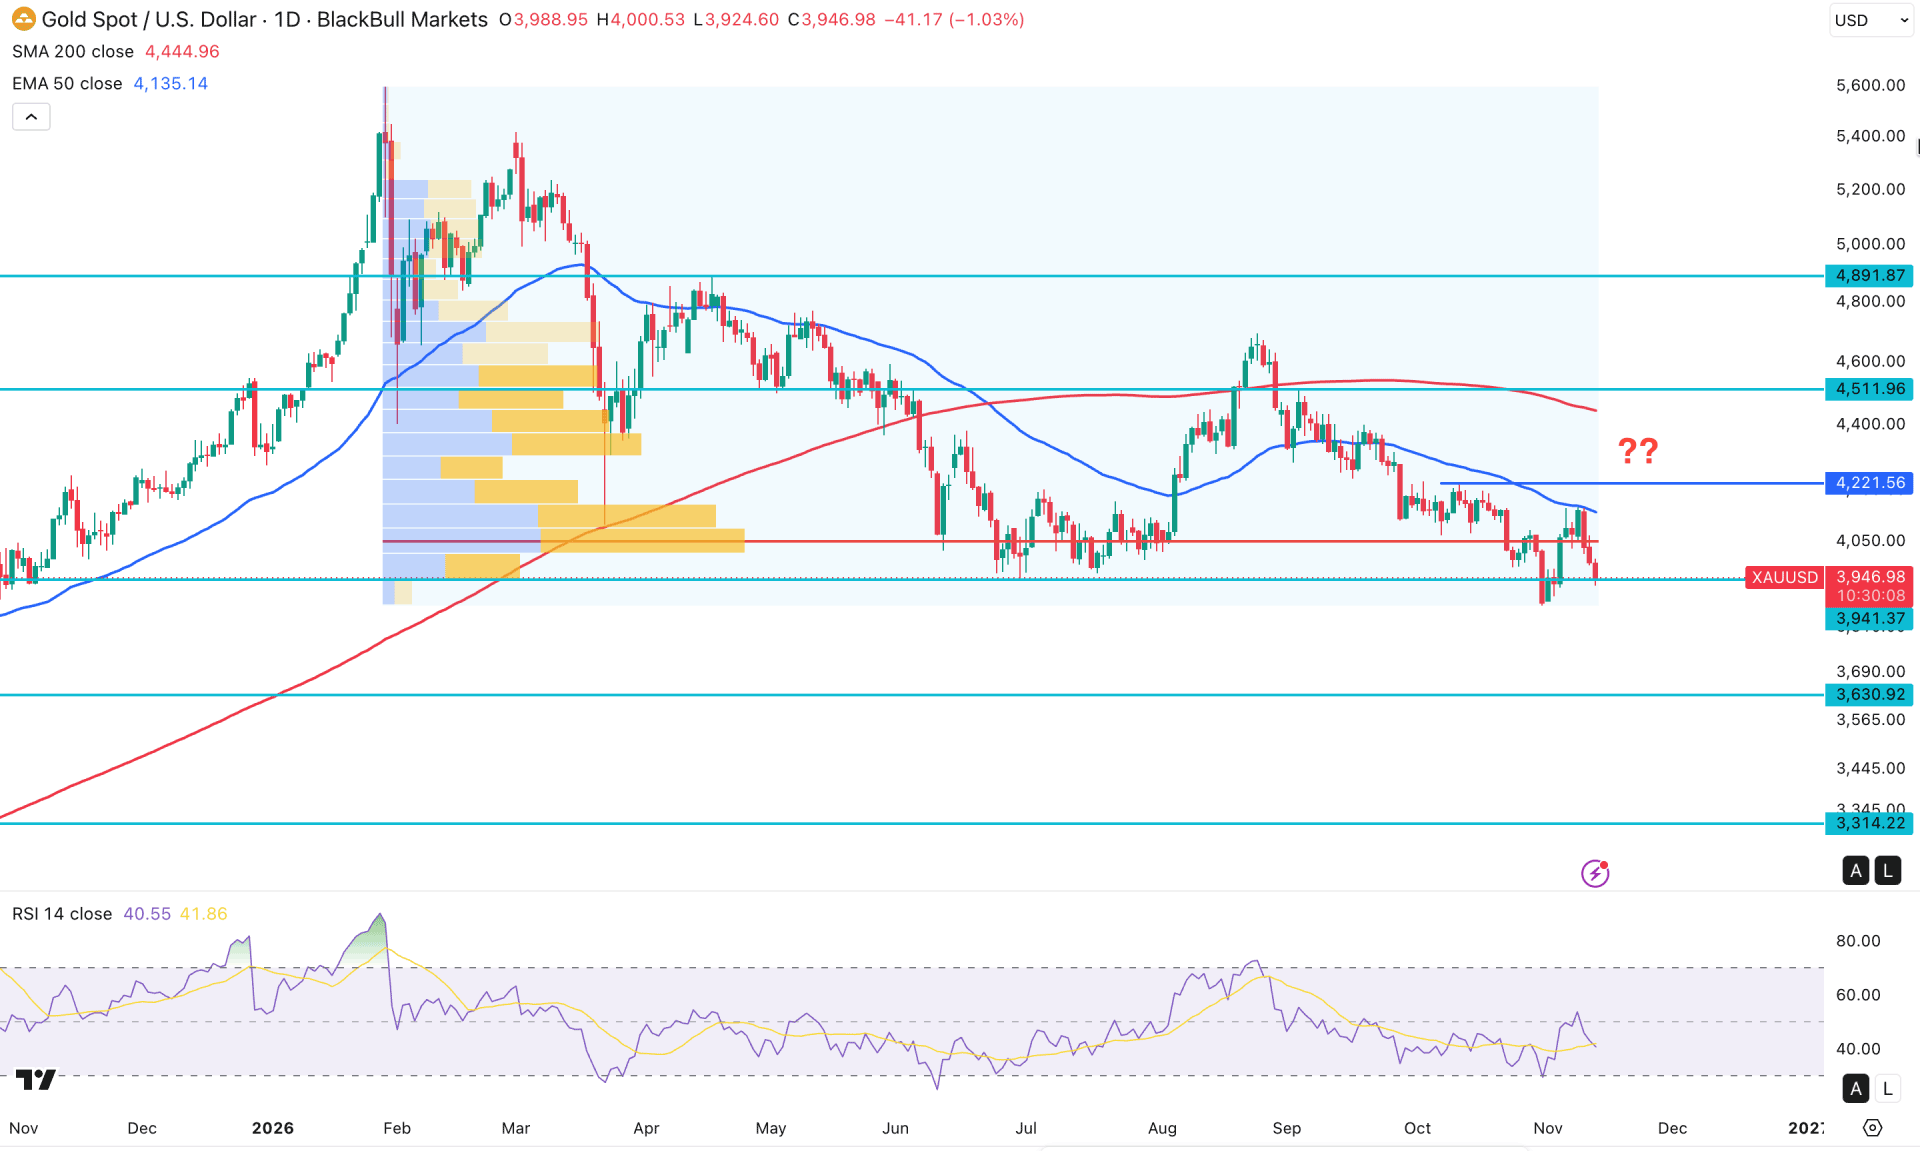
In the daily chart of XAUUSD, the ongoing market momentum is bearish and came with a valid bar-strength continuation from the 2026 high. As the price is trading within a downward trend, a valid recovery is pending before anticipating a trend reversal.
Looking at the higher timeframe, the price is still within a bearish momentum for two consecutive bearish candles. Many candles are visible taking the price below the 11-month low. As the price is approaching the crucial monthly support, investors should closely monitor how the price reacts at the 3850.598 area. The weekly timeframe is also suggesting a down continuation where the most recent price is trading sideways within a bearish range.
In terms of the volume structure, bears are favorable as the largest activity level since January 2026 is at the 4044.17 level. The current swing already had a bearish reversal from the high-value resistance line with multiple bearish daily closes.
A similar structure is visible from the main chart where the 200-day SMA is the major resistance above the entire structure. Moreover, the 50 DEMA is closer to the existing swing high and has a bearish slope.
In the indicator window, the relative strength index went above the 50.00 neutral level but was unable to sustain. As the current line is having downward traction below the neutral 50.00 area, we may consider a bearish extension soon.
Based on the overall market structure, XAUUSD is in a critical point for buyers where the existing price swing does not signal a bullish recovery possibility. The 50-day EMA is the crucial level to look at as the price could extend the possibility as long as it holds the momentum below this line.
The immediate support level to look at is the 3879.46 swing low, and a break below it is the key risk. A break below this line could find the next support at the 3630.90 level.
On the bullish side, multiple resistances are yet to be overcome, and sufficient sell-side liquidity grab is still pending. The primary bullish structure could be to overcome the 4221.56 swing high before aiming for the 200 SMA.
More extended selling pressure with sufficient liquidity from the 3871.46 swing high with a recovery above the 50-day EMA could offer an alternative long opportunity.
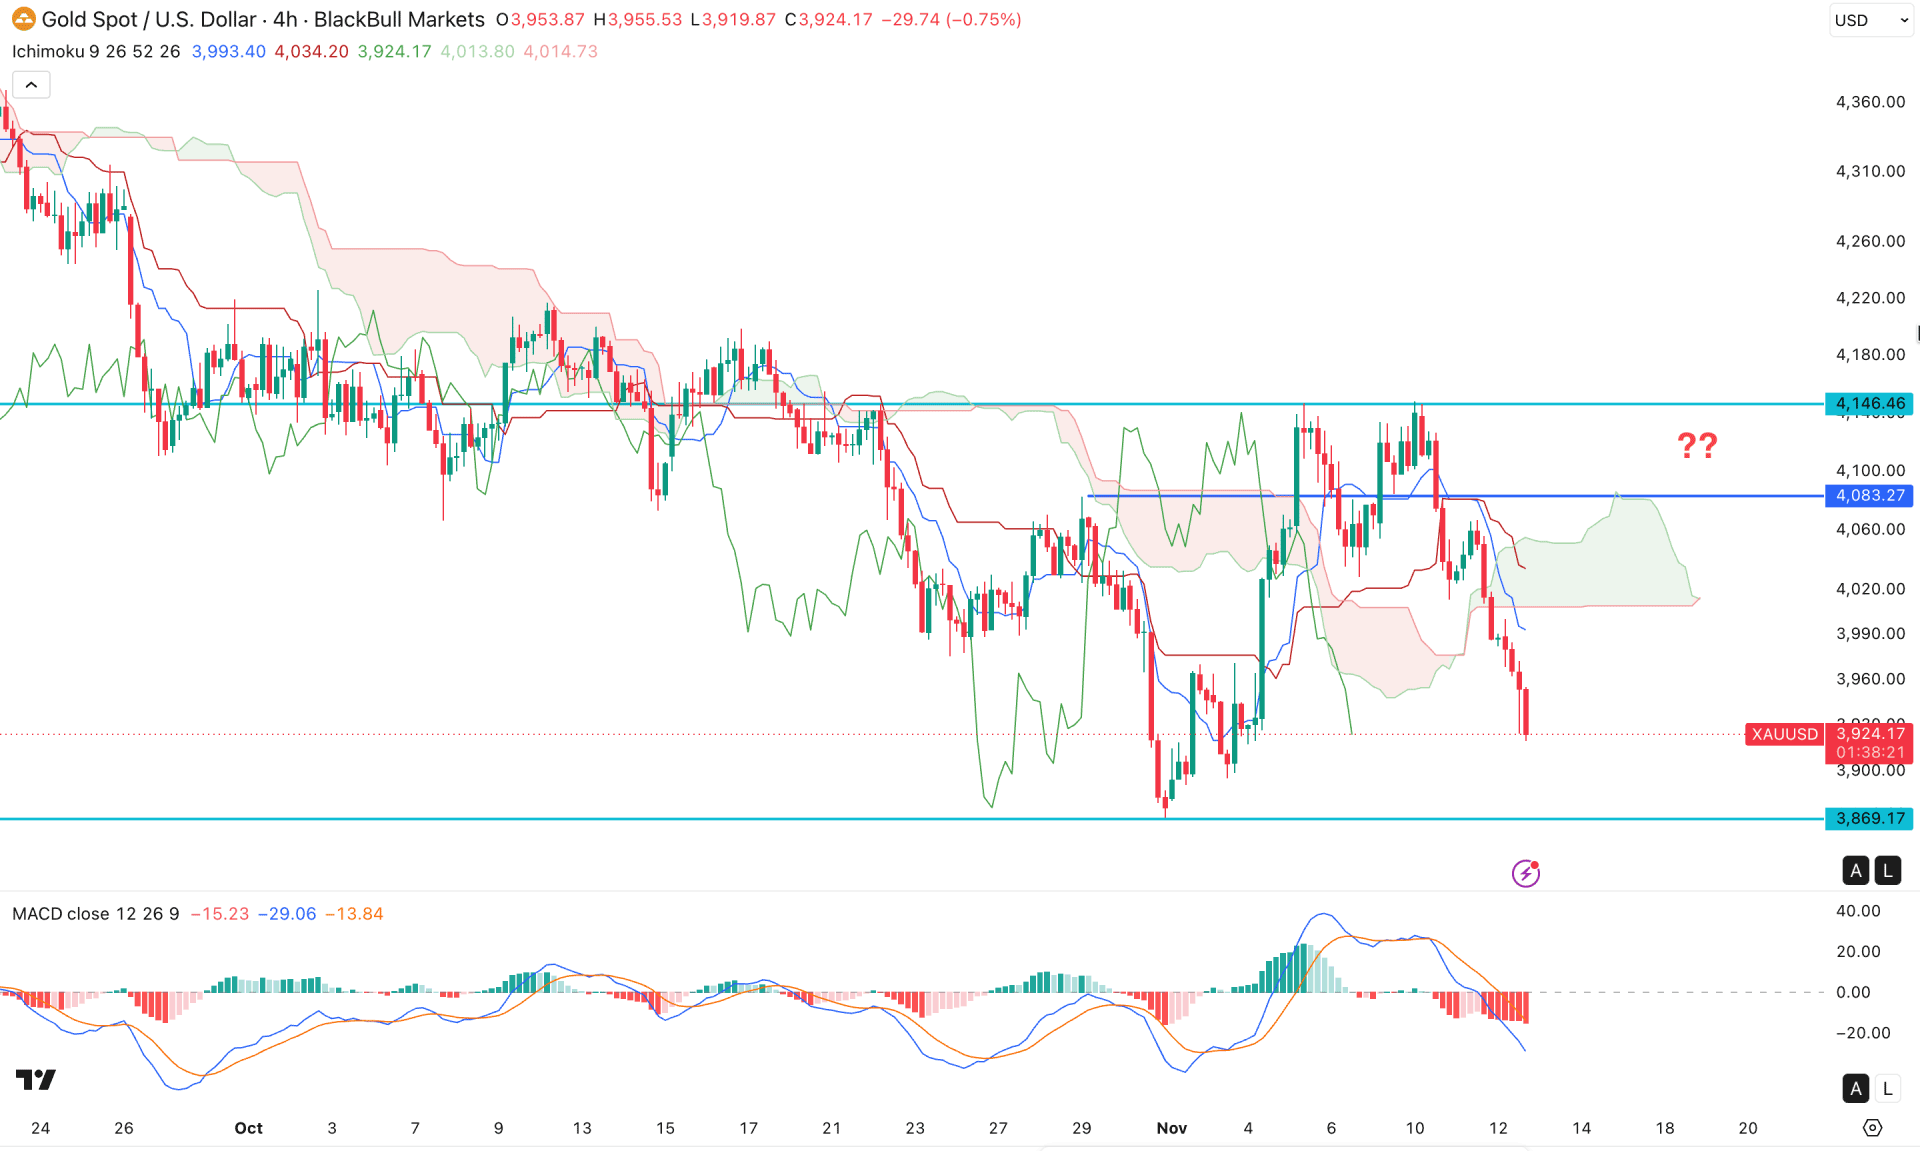
In the four-hour timeframe, the XAUUSD price aimed lower from a double top break with continued selling pressure below the cloud resistance. As a result, the future cloud has flipped its position and squeezed to a point.
On the other hand, the dynamic resistances are still above the current price, where the gap is signaling a possible bullish correction, keeping the entire structure valid.
In the secondary indicator, the MACD signal line remains below the neutral area, where the histogram maintained that momentum.
Based on the four-hour market structure, the bearish continuation momentum is valid as long as the price remains below the 4083.27 flip zone.
The immediate support level is at the 3869.17 level, and breaking below this line could open the room for testing the 3644.00 area.
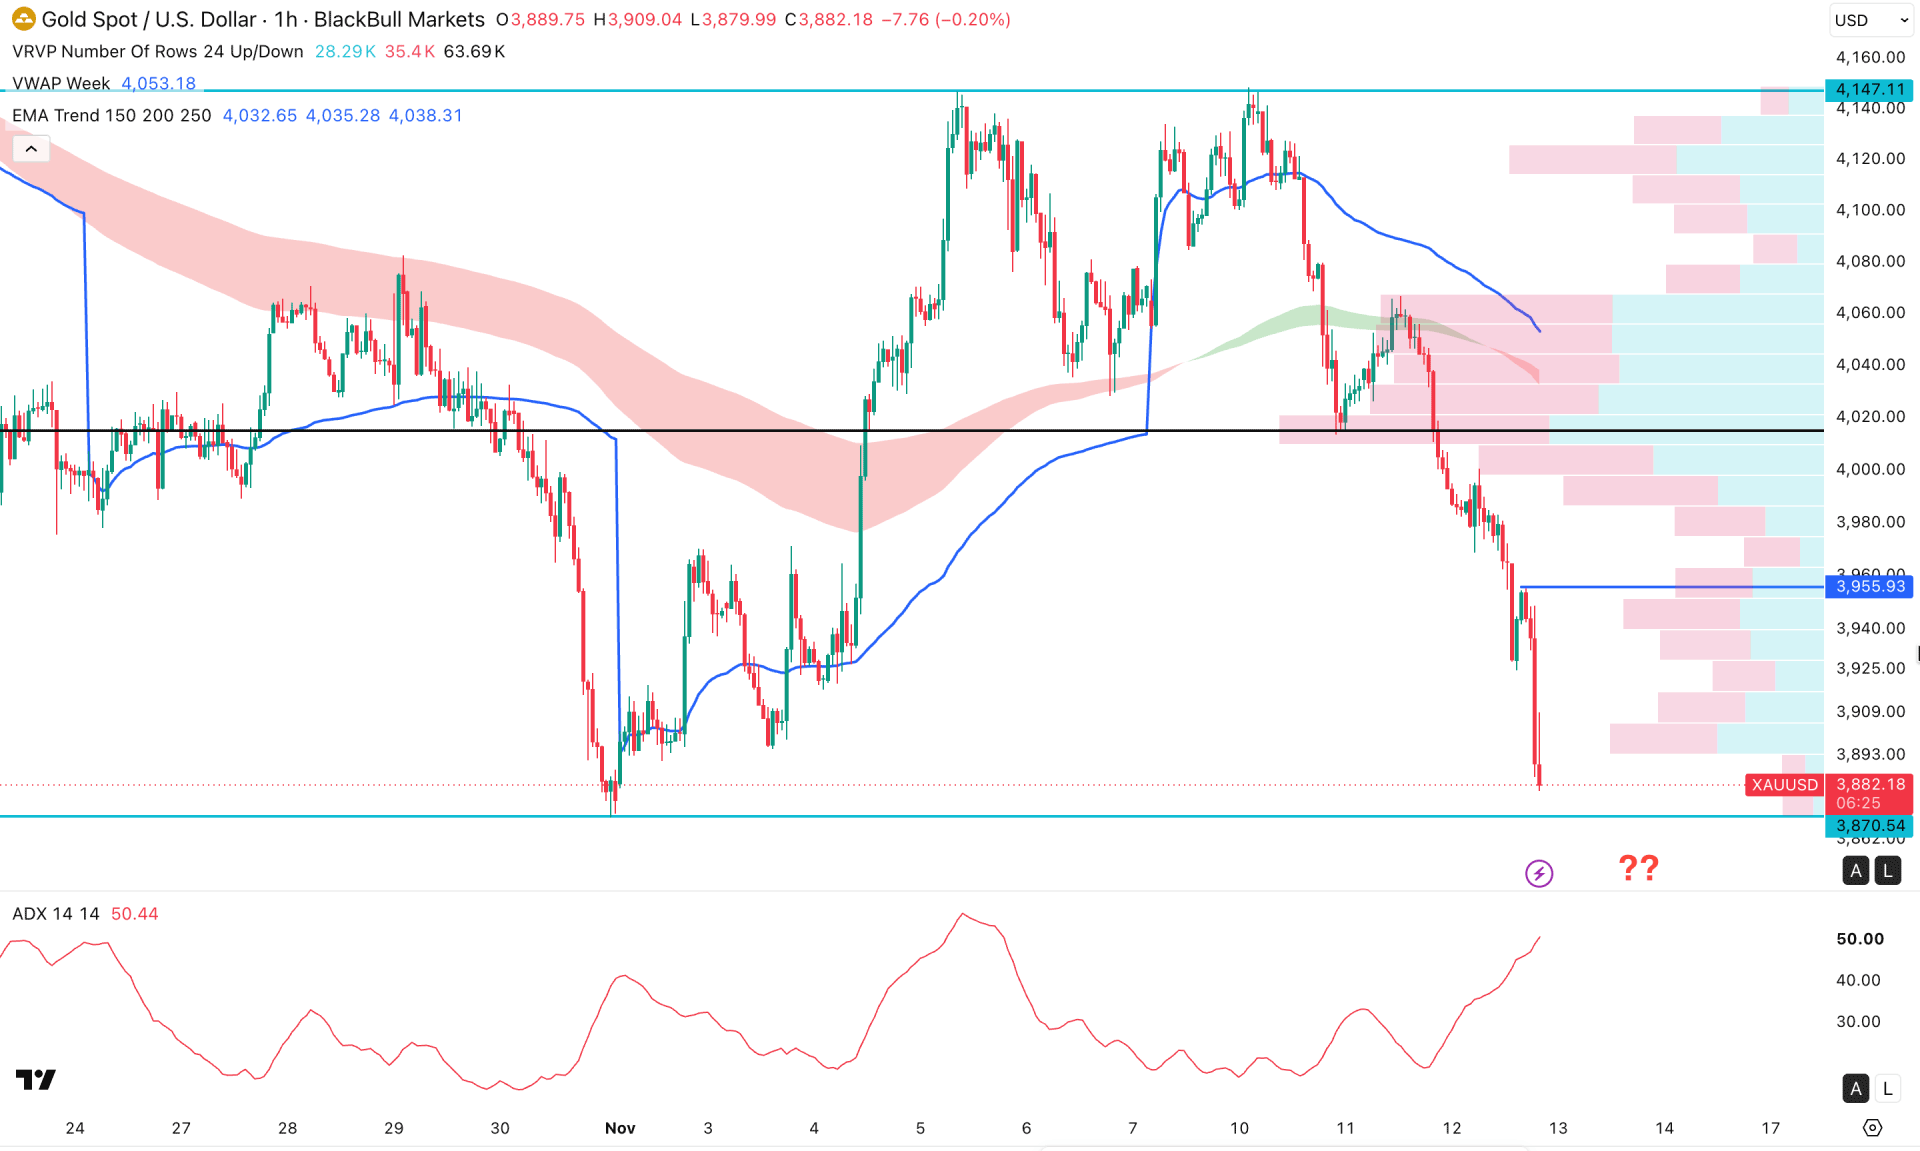
In the hourly timeframe, the XAUUSD price is trading within a bearish structure, where the most recent price is at the crucial support.
Because of the massive selling pressure from the 4147.11 double top level, the price expanded from the near-term resistance of the weekly VWAP, creating a bullish correction possibility.
On the other hand, the strength of the trend is solid, where the Directional Movement Index is above the 50.00 level, signaling a stable market trend.
Based on this outlook, investors should closely monitor how the price reacts after testing the 3870.54 crucial support level. Buying pressure from this area with an immediate rebound above the 3955.93 level could increase the possibility of testing the 4147.11 resistance level again.
On the other hand, a bearish continuation is valid as long as the price remains below the 3955.93 near-term resistance level.
Based on the overall market structure, the XAUUSD price is trading within a bearish structure where the price is at the crucial support level. Investors should closely monitor how the price reacts to the daily swing low, as a failure to hold the price above this line could increase the downside possibility.


