
Published: June 13th, 2024
A lower-than-anticipated US inflation report elevated the probability of a Federal Reserve (Fed) interest rate cut later this year. Moreover, the Fed's hawkish posture and Chairman Jerome Powell's failure to establish a specific rate-cut timetable strengthened the Greenback.
Fed Chair Jerome Powell reported that they are less optimistic about inflation than previously, influencing their decision to "cut." He emphasized, "If jobs weaken unexpectedly, the Fed is ready to respond." Powell underscored that the US inflation report is merely one report and underscored the necessity of observing the deflation process progressing toward the Fed's objective.
In addition, the median projection of Federal Reserve officials for the federal funds rate has been revised from 4.6% to 5.1% by the end of 2024, as indicated by the dot plot'. This implies that they anticipate only one rate reduction, in contrast to the current effective federal funds rate of 5.33%.
The US Bureau of Labor Statistics (BLS) previously reported that the inflation rate in the US remained unchanged from April's data. This news raised gold prices due to the decline in US Treasury bond yields. The US Dollar Index (DXY)indicates that the Greenback has fallen to a three-day low.
According to the CME FedWatch Tool, the probability of a Federal Reserve rate cut in September has increased from 46.7% to 61.3%, as indicated by the most recent US inflation report.
Let's see the future price of this instrument from the XAUUSD technical analysis:
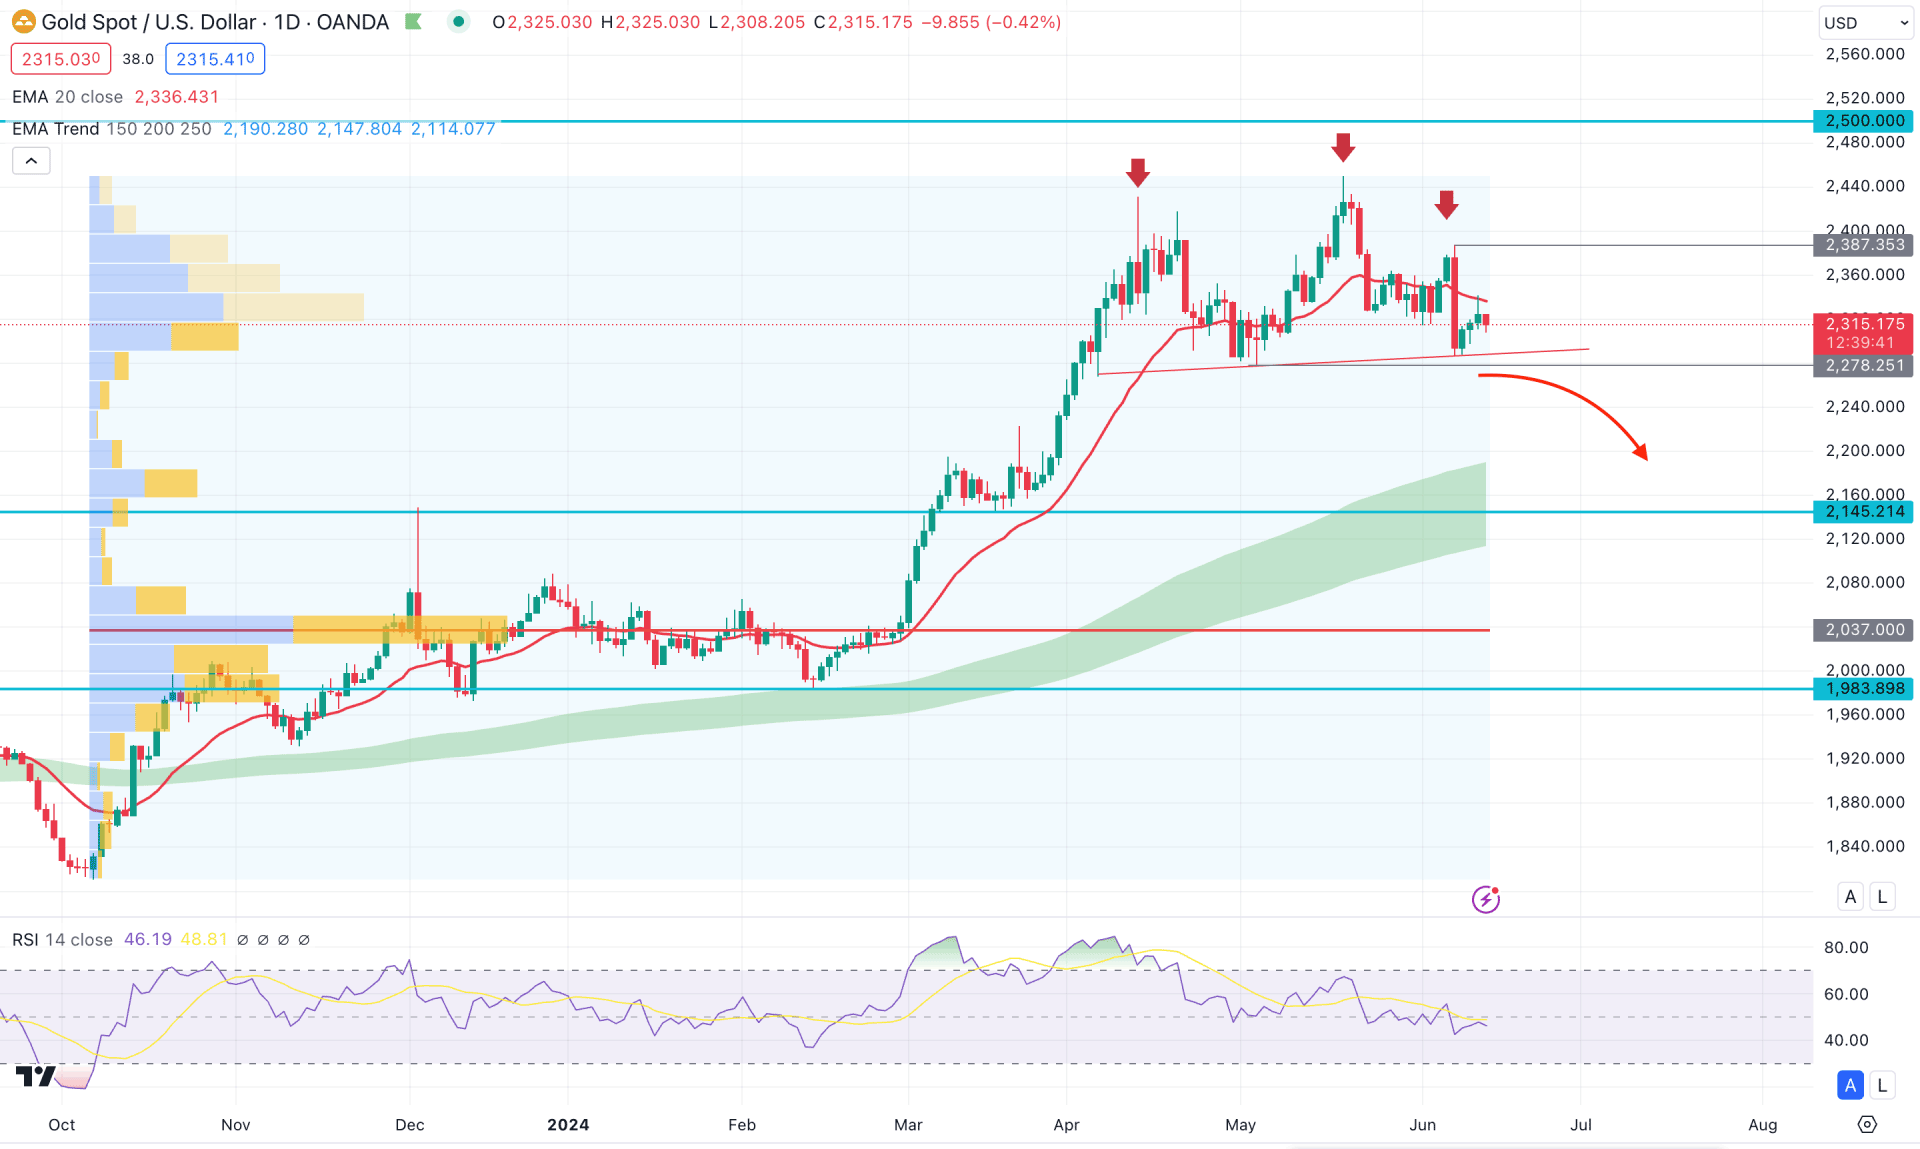
In the XAUUSD daily chart, the recent price shows a corrective pressure after reaching the peak at the 2450.95 high. As a result, multiple violations are seen with the dynamic line, creating a bearish possibility from a valid price action.
In the higher timeframe, the recent monthly candle suggests a failure of bulls, creating a long, wicked close at the high. However, the May 2024 low is still protected, where a bearish break could be a potential short opportunity. In the weekly chart, the ongoing price action is corrective, where the weekly support of 2278.42 is still untouched. In that case, investors should closely monitor how the price reacts to the near-term low before finding the future price direction.
In the volume structure, the most significant level since October 2023 is way below the current price. This is a sign that no significant selling pressure is present at the top, which suggests that more clues might be needed before anticipating bearish pressure.
The main price chart shows a bearish break below the dynamic 20-day EMA level during the post-NFP time frame, suggesting a primary bearish pressure. However, the Moving Average wave, consisting of MA 150 to 250, remains below the 2200.00 psychological level, suggesting a bearish continuation as a mean reversion.
Moreover, the potential Head and Shoulders pattern is visible, where the current price hovers above the neckline support. As the Relative Strength Index (RSI) remains stable below the 50.00 line, we may expect a potential downside pressure after a valid break below the H&S neckline.
Based on the daily price of XAUUSD, an additional downside pressure with a daily candle below the 2278.25 support could validate the Head & Shoulders breakout. In that case, a bearish pressure could extend the momentum toward the 2145.21 support level in the coming days.
On the other hand, any immediate bullish reversal with consolidation above the 20-day EMA might alter the bearish opportunity. In that case, upward pressure might be seen as the 2500.00 psychological line.
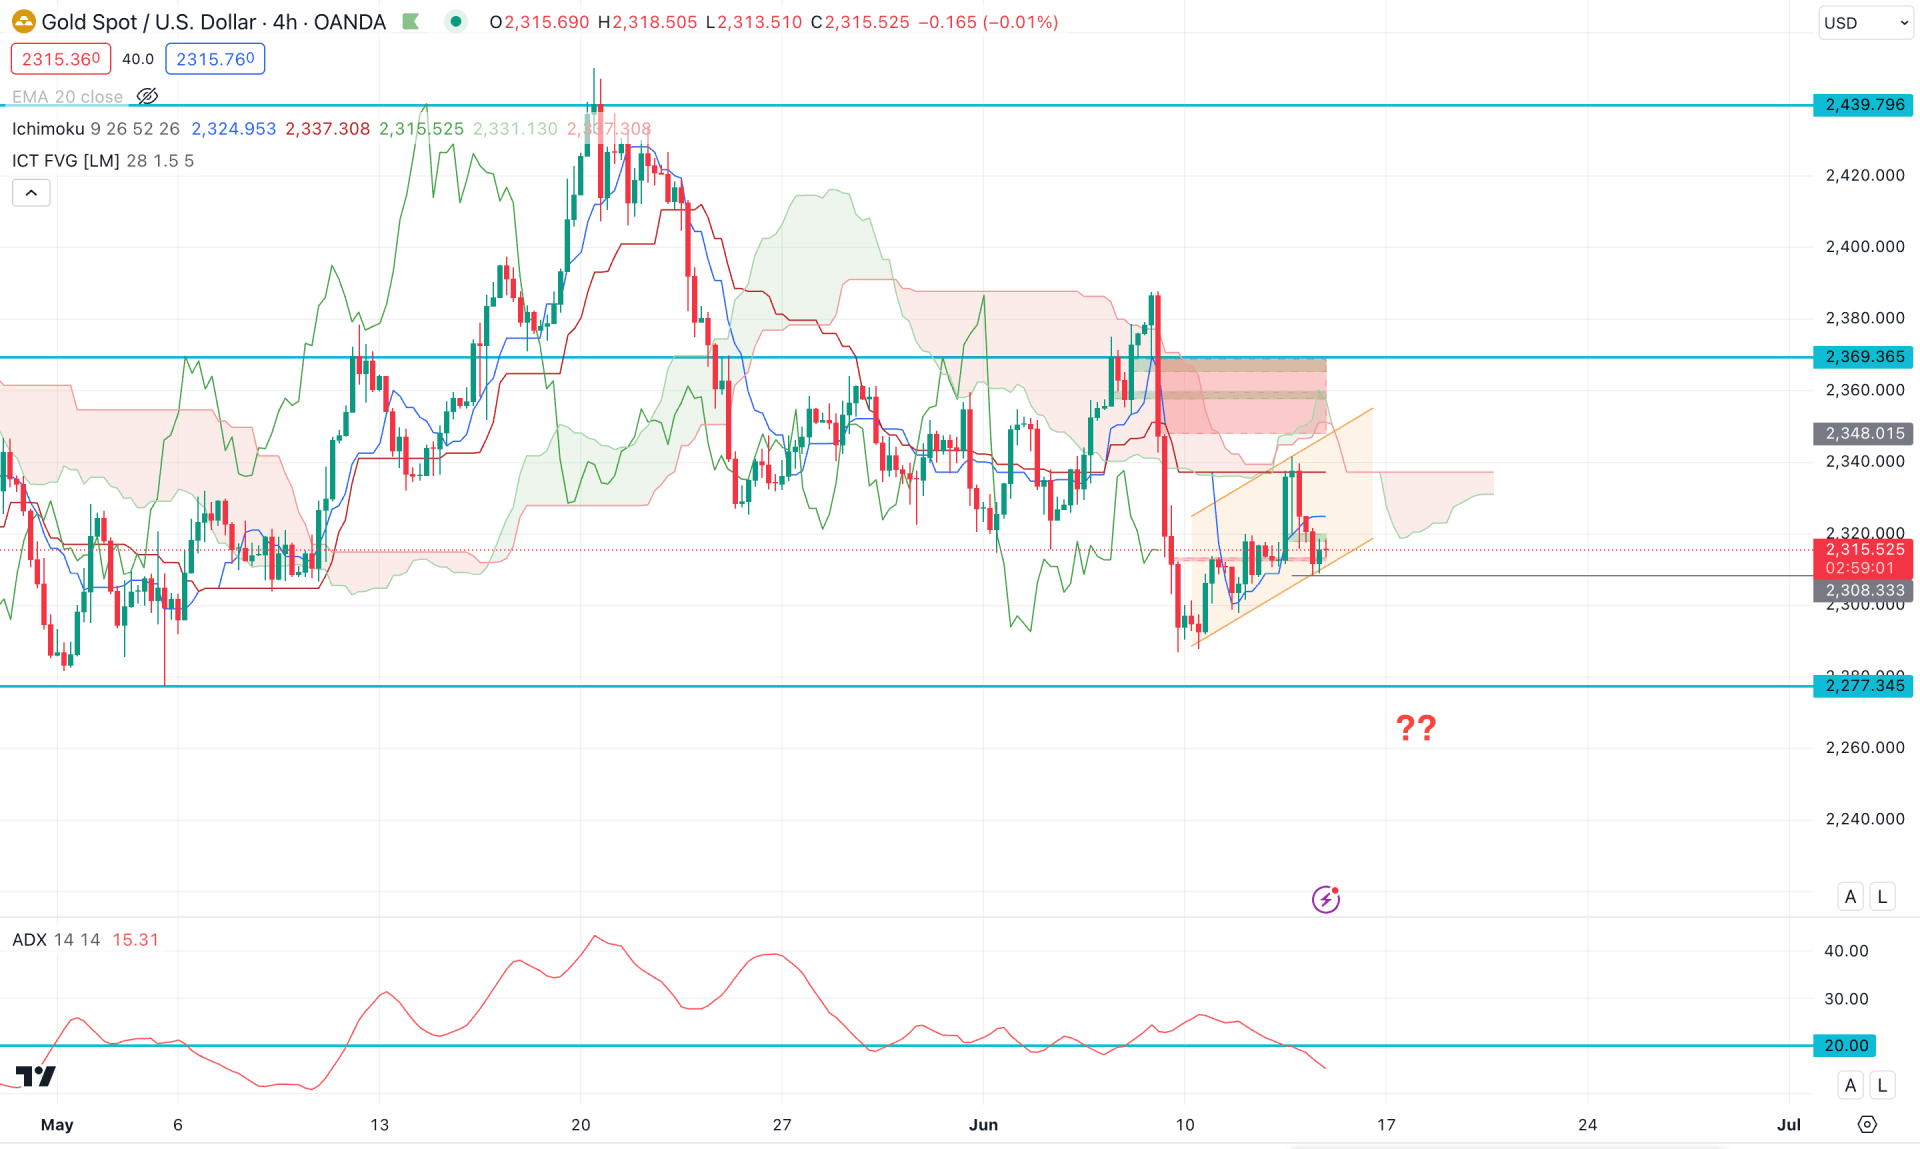
In the H4 timeframe, the recent price showed bearish pressure, creating a break below the dynamic Cloud zone. Investors might expect the downside pressure to extend as long as the price remains steady below the cloud zone.
In the future cloud, the Senkou Span B remained flat, with an upward traction in the Senkou Span A. In that case, a bullish trend might be activated if the Senkou Span A moved above the B line.
In the secondary window, the Average Directional Index (ADX) suggests a corrective pressure as the current line is below the 20.00 level.
Based on the H4 structure, a rebound in the ADX line above the 20.00 level with a bearish H4 candle below the ascending channel could be a short opportunity.
On the other hand, the recent price left the 2348.01 to 2369.36 zone to work as a strong supply zone, which might be revisited soon. An extensive bullish pressure with a daily candle above the 2370.00 level could be a potential long opportunity, targeting the 2400.00 psychological line.
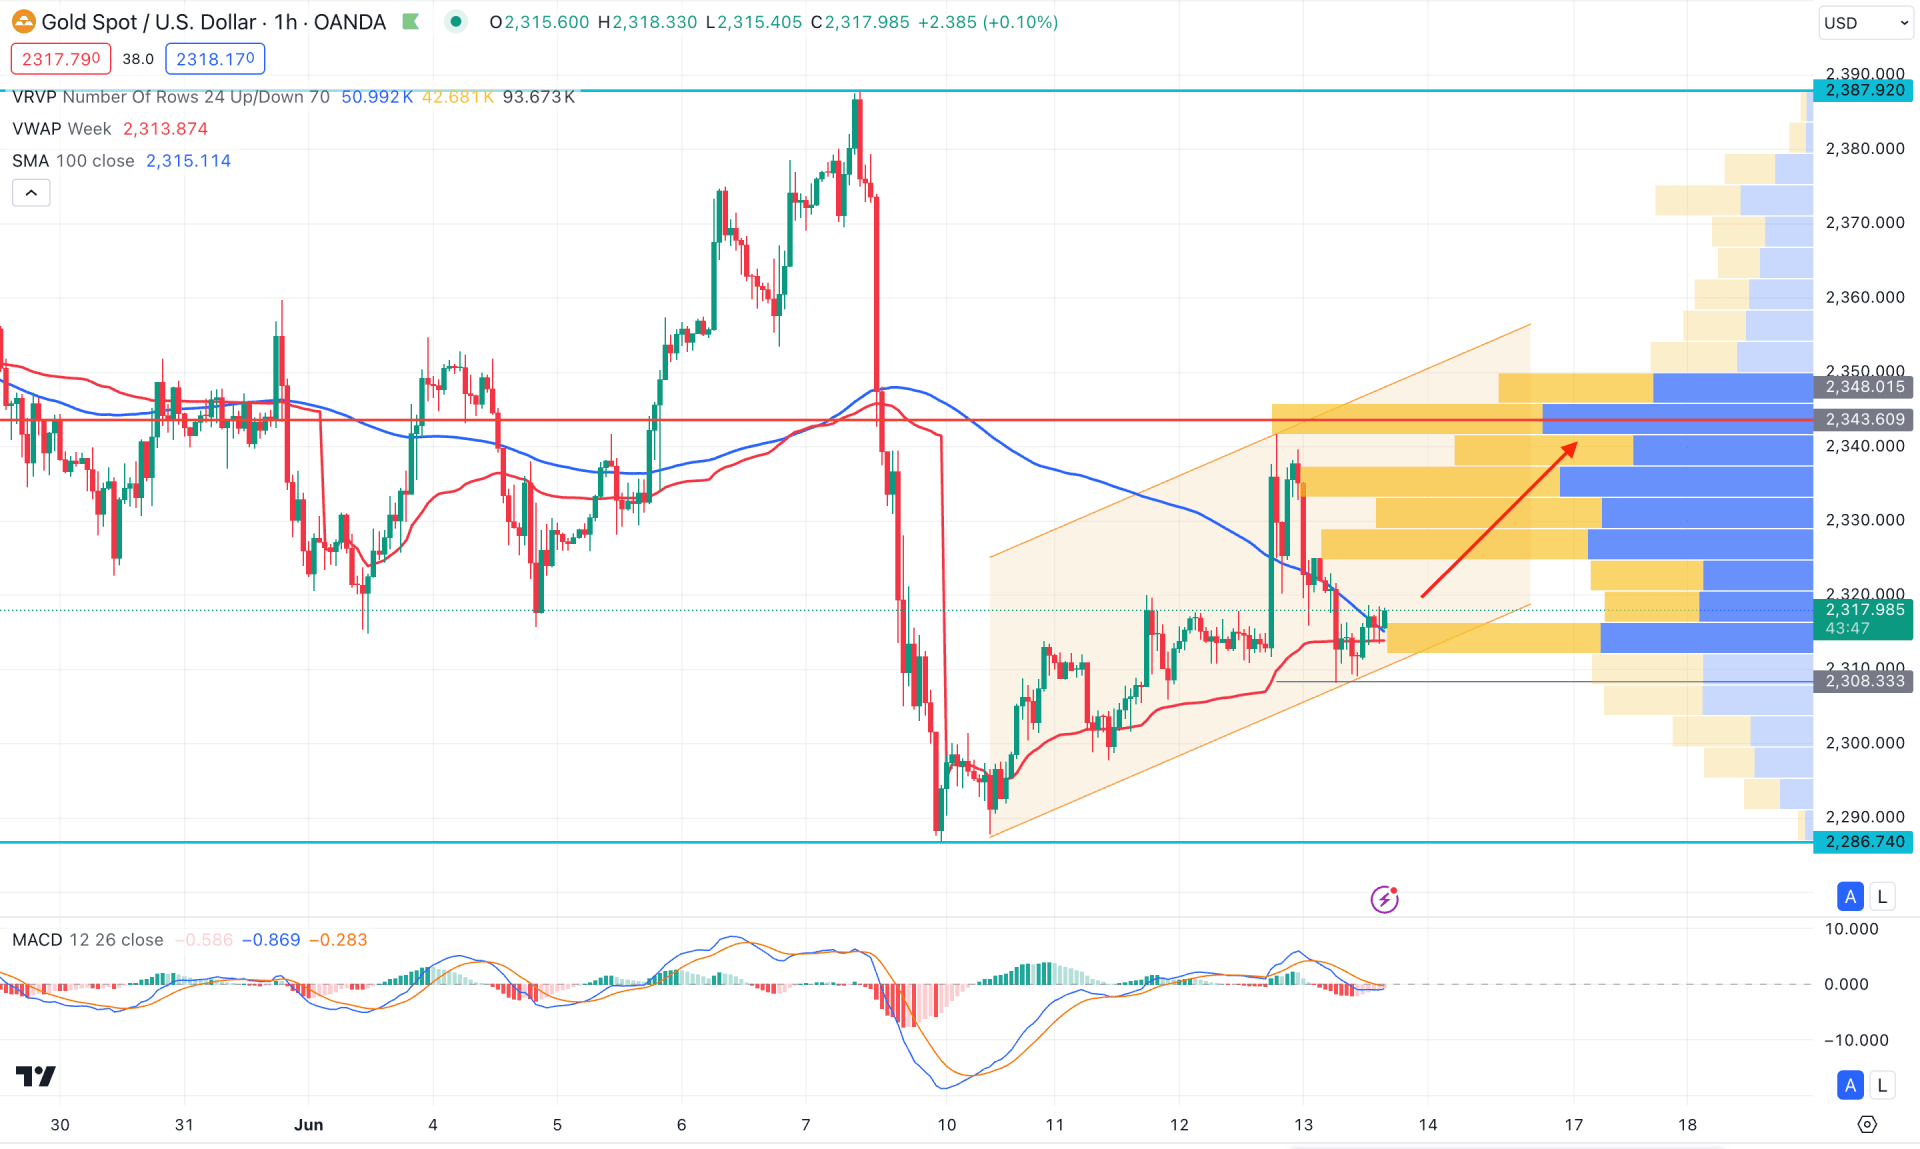
In the H1 chart, indecision is visible within the ascending channel, where the current price trades at the channel support. Moreover, the 100 SMA line is acting as a support as a potential bullish H1 candle is available above this dynamic line. The weekly VWAP is also below the current price, working as an additional buying pressure.
In the MACD Histogram, the recent level reached the neutral point after creating a bottom. Moreover, the Signal line is sideways, which might signal a long opportunity after having a valid rebound.
Based on the H1 structure, a bullish correction is pending in this pair as long as the current price holds above the trendline support. In that case, the price has a higher possibility of extending the buying pressure and reaching the 2340.00 area.
On the other hand, the visible range high volume line is still above the current price, where a valid downside pressure below the trendline support could lower the price toward the 2266.74 level.
Based on the current multi-timeframe analysis, XAUUSD is more likely to extend the downside pressure after validating the Head & Shoulders breakout. However, an early bearish signal might come after having a bearish break from the hourly channel breakout.


