
Published: June 5th, 2025
Investors struggled with mounting economic volatility, and gold maintained its recent gains above $3,370 per ounce, staying near a roughly four-week peak.
According to ADP figures, private sector employment increased in May, which was the smallest since March 2023. Separations indicated that US service industry activity had contracted for the first time in nearly a year.
According to this soft economic report, the Fed is expected to lower interest rates at least twice this year, usually to encourage non-yielding investments like gold.
However, Fed policymakers exercise caution despite persistent trade-related concerns, even as President Trump keeps pushing for rate cuts.
All eyes will be on Friday's nonfarm payroll data for additional clues about the Fed's policy direction.
Regarding trade, worries about growing hostilities between the US and essential trading partners remained after Trump increased tariffs on aluminum and steel and said negotiating with Chinese President Xi Jinping was especially challenging.
Let's see the possible price direction from the XAUUSD technical analysis:
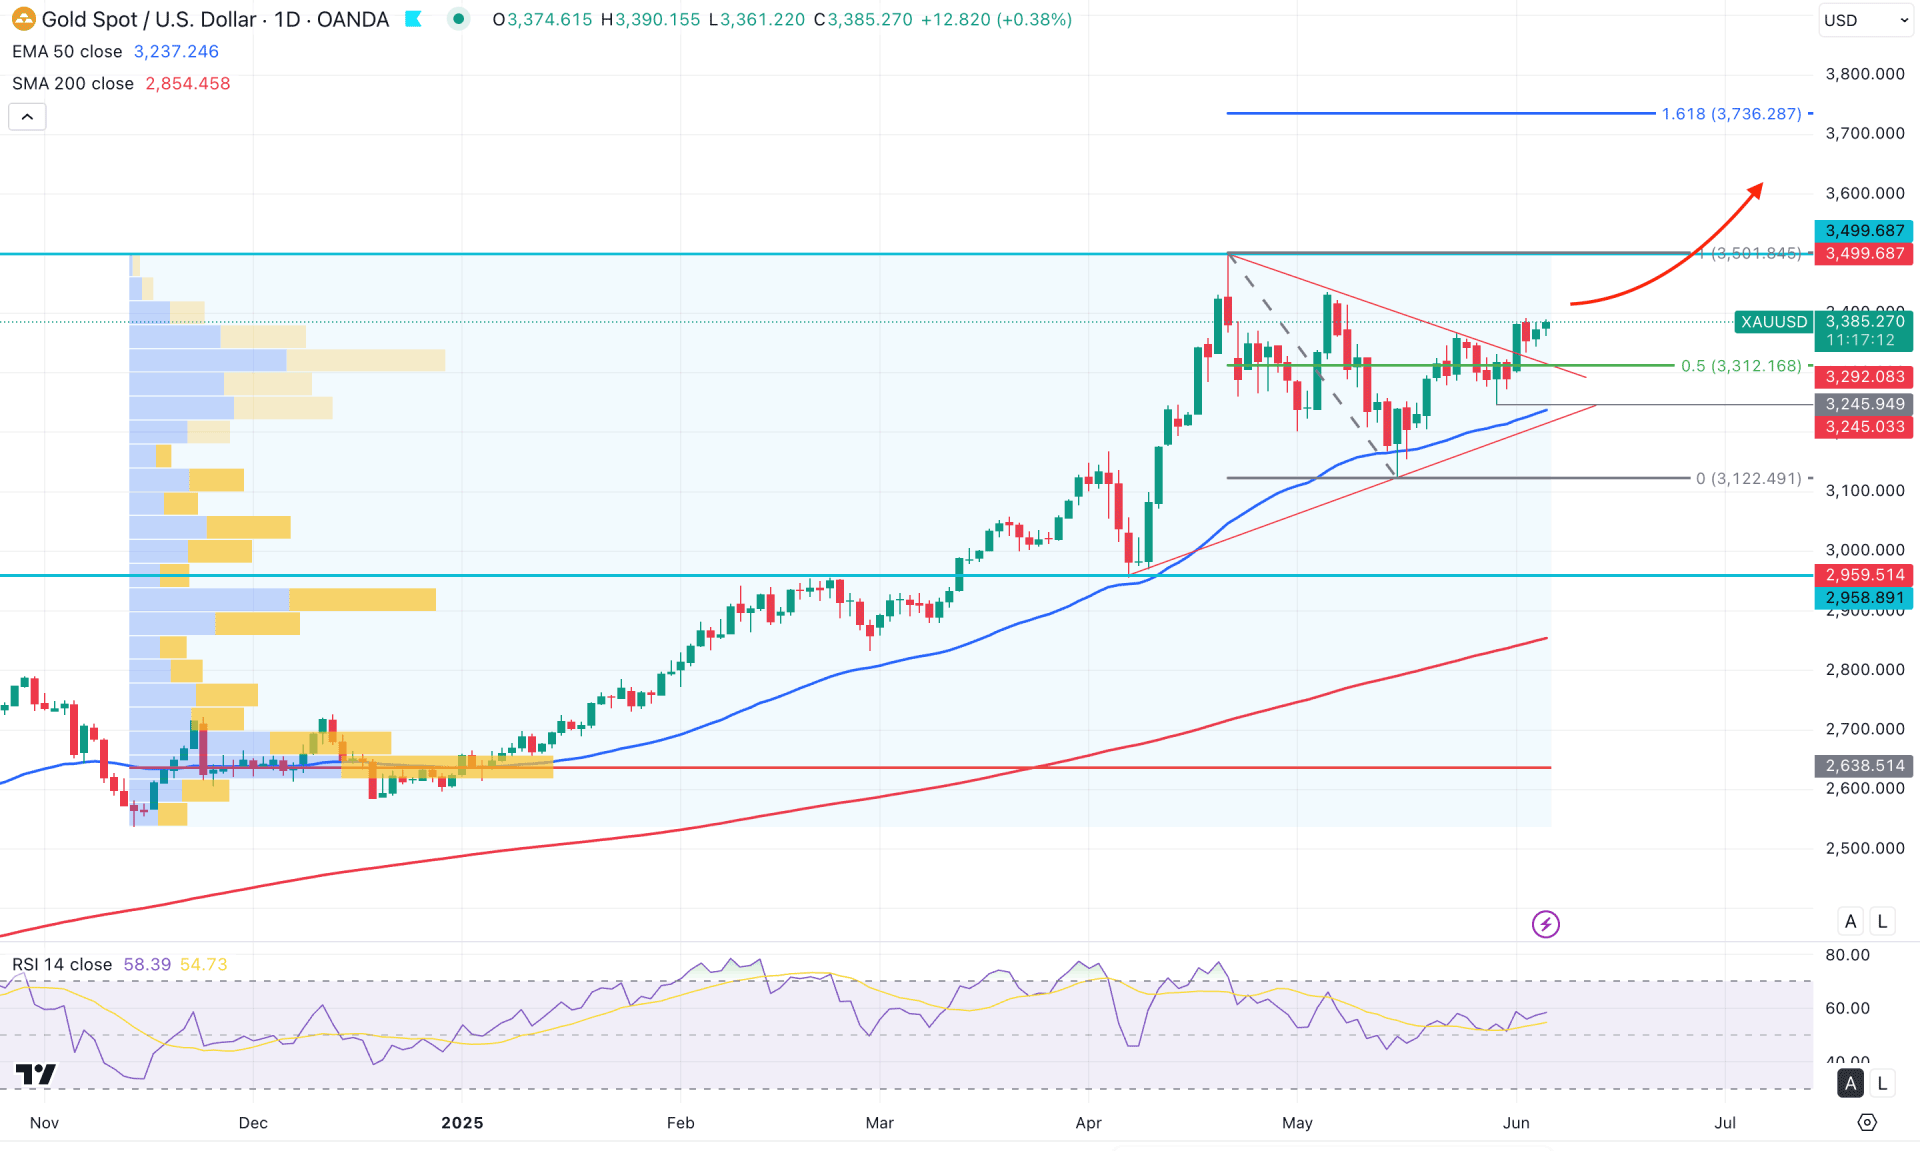
In the daily chart of XAUUSD, the ongoing bullish trend remains feasible as the current price continues to form higher swing highs. The price reached a new all-time high in April 2025, followed by a corrective decline. As long as the existing swing low is protected, the price is likely to rebound and create a new high.
In the higher timeframe, the price continued to move upward after closing as a gravestone doji in May 2025. However, a sideways momentum is visible on the weekly timeframe, indicating a valid rally-base-rally formation.
The volume structure presents a different scenario, as no significant high-volume levels have been created at the top. According to volume analysis, the highest activity level since November 2024 was at the 2636.66 level, which is far below the current price. Currently, the price is trading above the high-value area, signalling ongoing buying pressure from institutional participants. However, the widening gap between the current price and the high-value line may suggest a possible downside correction to attract more buyers.
The 50-day Exponential Moving Average, located just below the 3245.94 swing low, is acting as immediate support. Meanwhile, the 200-day SMA lies below the 2959.51 level, acting as a major support zone.
Although the price is approaching the all-time high area, the Relative Strength Index (RSI) still shows sufficient room for further upside. The current RSI is hovering between the 50.00 and 70.00 levels, indicating potential for a move above the 70.00 level soon.
Based on the daily market outlook, XAUUSD is more likely to extend its buying pressure. A potential symmetrical triangle breakout on the buyers' side, confirmed by a bullish candle above the triangle resistance, led to an inside-bar continuation pattern, signalling strong upward momentum. In this scenario, the price has a higher probability of surpassing the 3438.02 swing high and testing the 3499.68 level. Additionally, a consolidation above the 3400.00 psychological level could increase the likelihood of reaching the 3500.30 area.
On the downside, the gap between the current price and the 200-day Simple Moving Average suggests a correction may be due. If the price fails to hold above the 50-day EMA, a short-term selling opportunity could emerge below the 3245.94 level, potentially targeting the 3100.00 area. However, the ongoing bullish trend will likely remain valid even if the price dips below the 3122.49 swing low. Another buying opportunity might emerge from the 3122.49 to 3050.00 zone. Nevertheless, a break below the 2959.51 level would invalidate the current bullish structure and may trigger a more profound decline toward the 2700.00 to 2500.00 region.
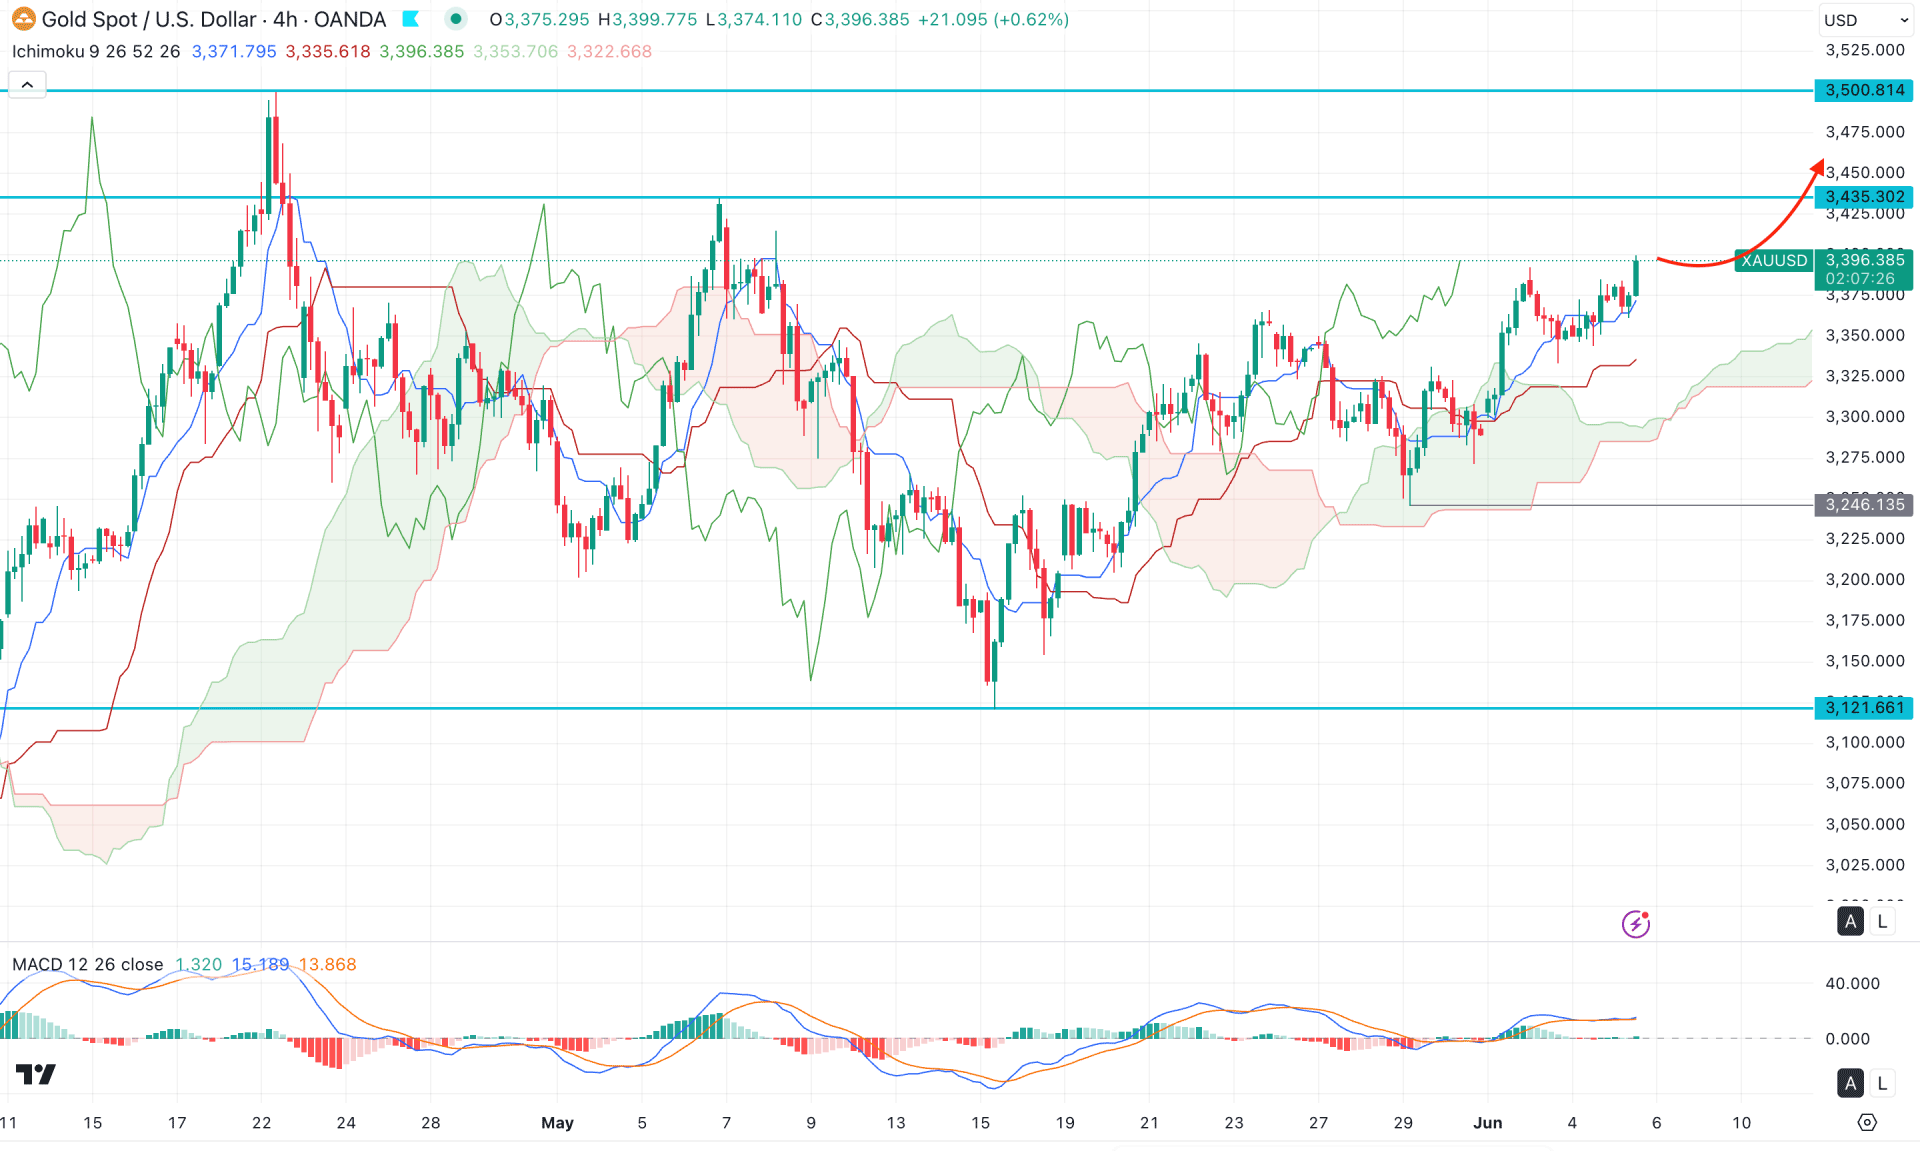
In the h4 chart of XAUUSD, the ongoing buying pressure is valid as the price formed a V-shape recovery with a stable market above the cloud support. Moreover, the Senkou Span A remains above the Senkou Span B, which signals a confluence of bullish factors.
In the current chart, the dynamic Tenkan Sen and Kijun Sen are below the current price, and working as an immediate support.
In the secondary indicator window, the MACD Histogram remains in line with the neutral level, while the dynamic Signal Line shows a bullish recovery in the positive zone.
Based on the H4 outlook, the ongoing buying pressure is intact as long as the dynamic Kijun Sen remains below the current price.
However, a failure to overcome the 3435.30 resistance level could be a primary bearish signal. In that case, more confirmed bearish pressure might come after having a bearish cloud breakout, targeting the 3150.00 level.
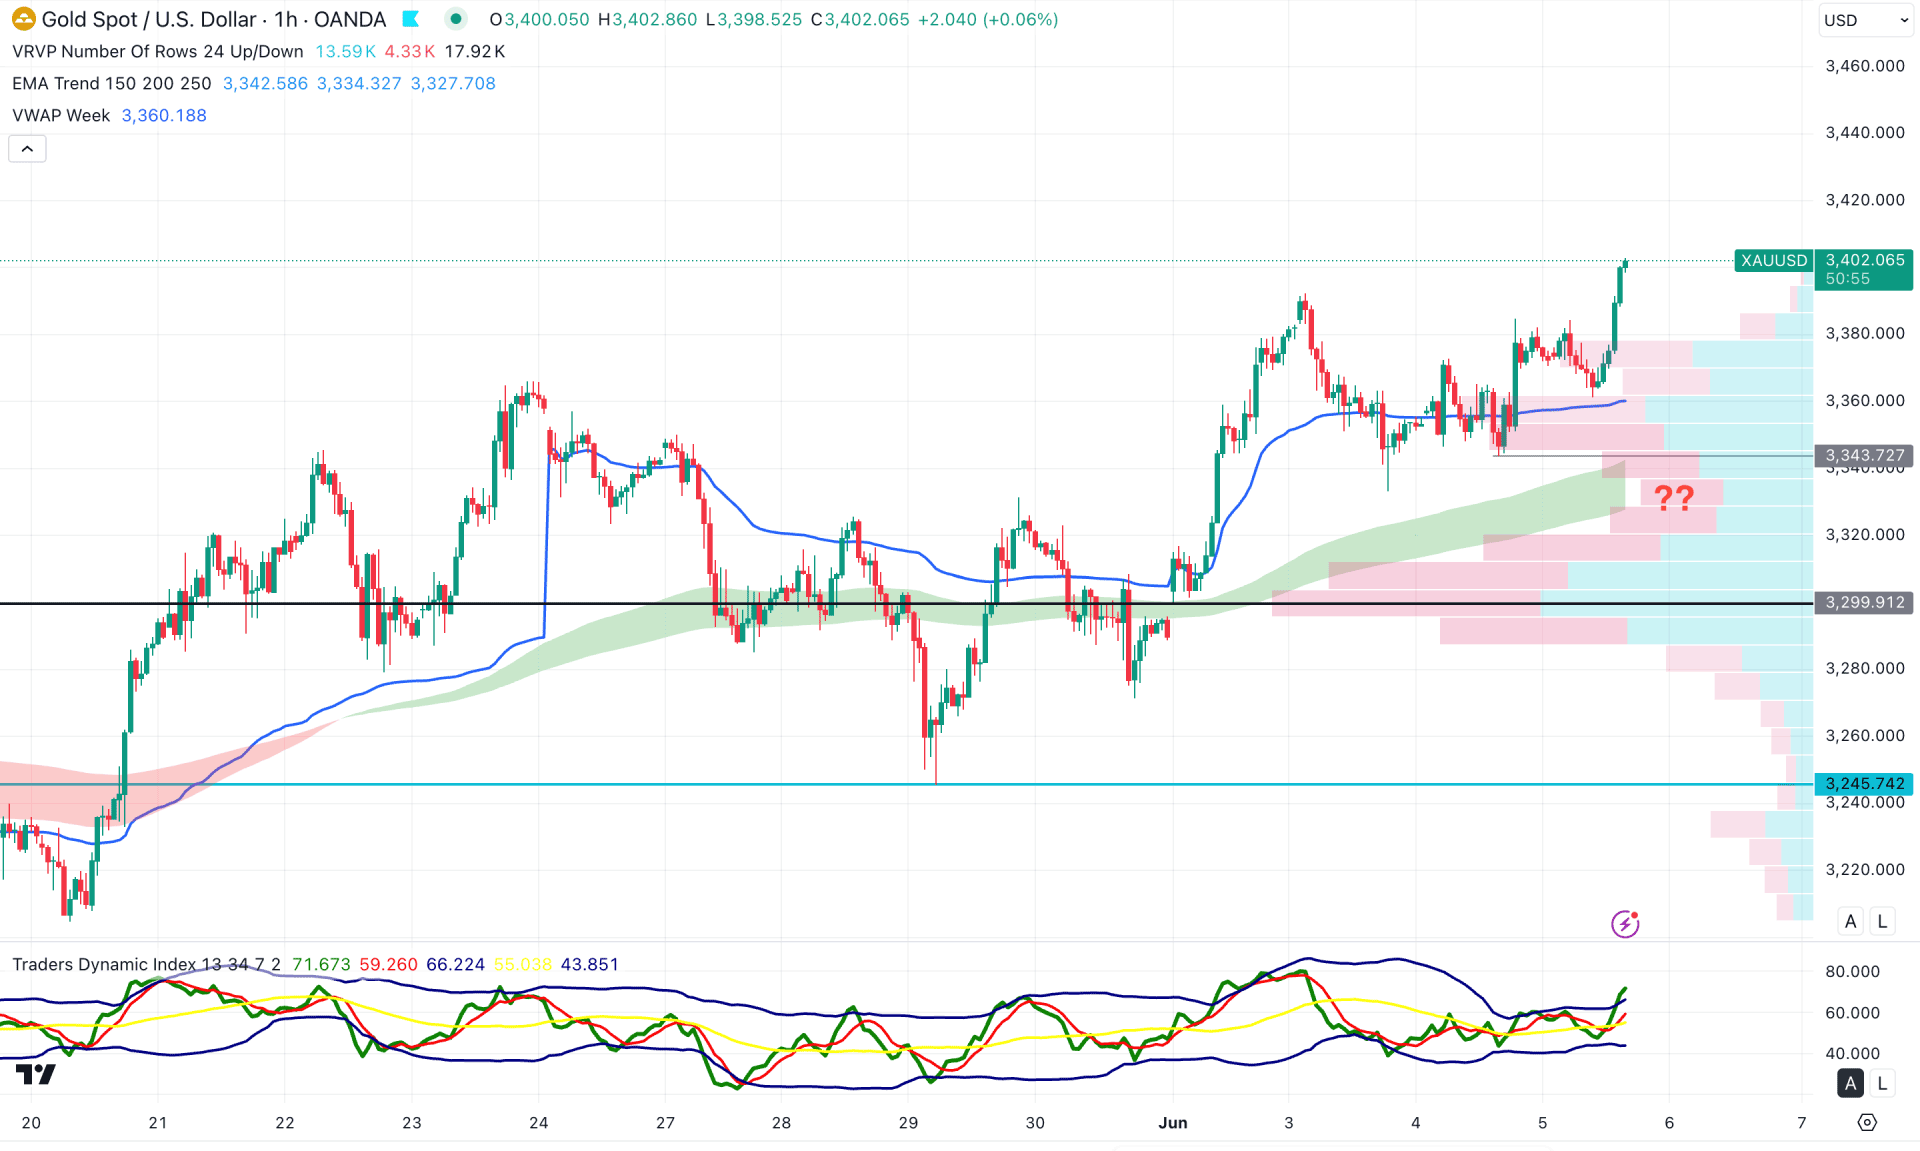
In the hourly time frame, the XAUUSD bullish trend is solid as the dynamic Moving Average wave is below the current price with a bullish traction. Moreover, the intraday high volume line is below the current price, working as a confluence buy signal.
In the secondary indicator window, the Traders Dynamic Index (TDI) rebounded and moved above the upper band area.
Based on this outlook, the ongoing buying pressure is solid for the XAUUSD price, where some downside correction is needed before anticipating a long move. However, the 3343.72 level will be the intraday bottom to look at, as downside pressure below this line might extend the loss.
Based on the current market analysis, XAUUSD is more likely to extend the upward pressure. The recent price has formed a bullish symmetrical triangle breakout. A consolidation above the triangle resistance could increase the possibility of taking the price beyond the 3500.00 level.


