
Published: March 19th, 2026
Gold (XAUUSD) has dropped to a 6-week low amid impulsive selling pressure over the past 7 sessions. As the Fed's hawkish sentiment weighs on the market, the momentum has shifted from safe-haven assets to the US Dollar.
In the latest announcement, the Fed left the interest rate unchanged despite the ongoing conflict in the Middle East. Policymakers signalled that the possibility of a rate cut is lower now, and they will look for further evidence on this.
The geopolitical tension is ongoing and can hold the safe-haven demand for gold at any time. In recent news, the US has planned to attack Iran on a large scale after demolishing the LNG capacity.
Let's see how Gold could perform from the XAUUSD technical analysis:
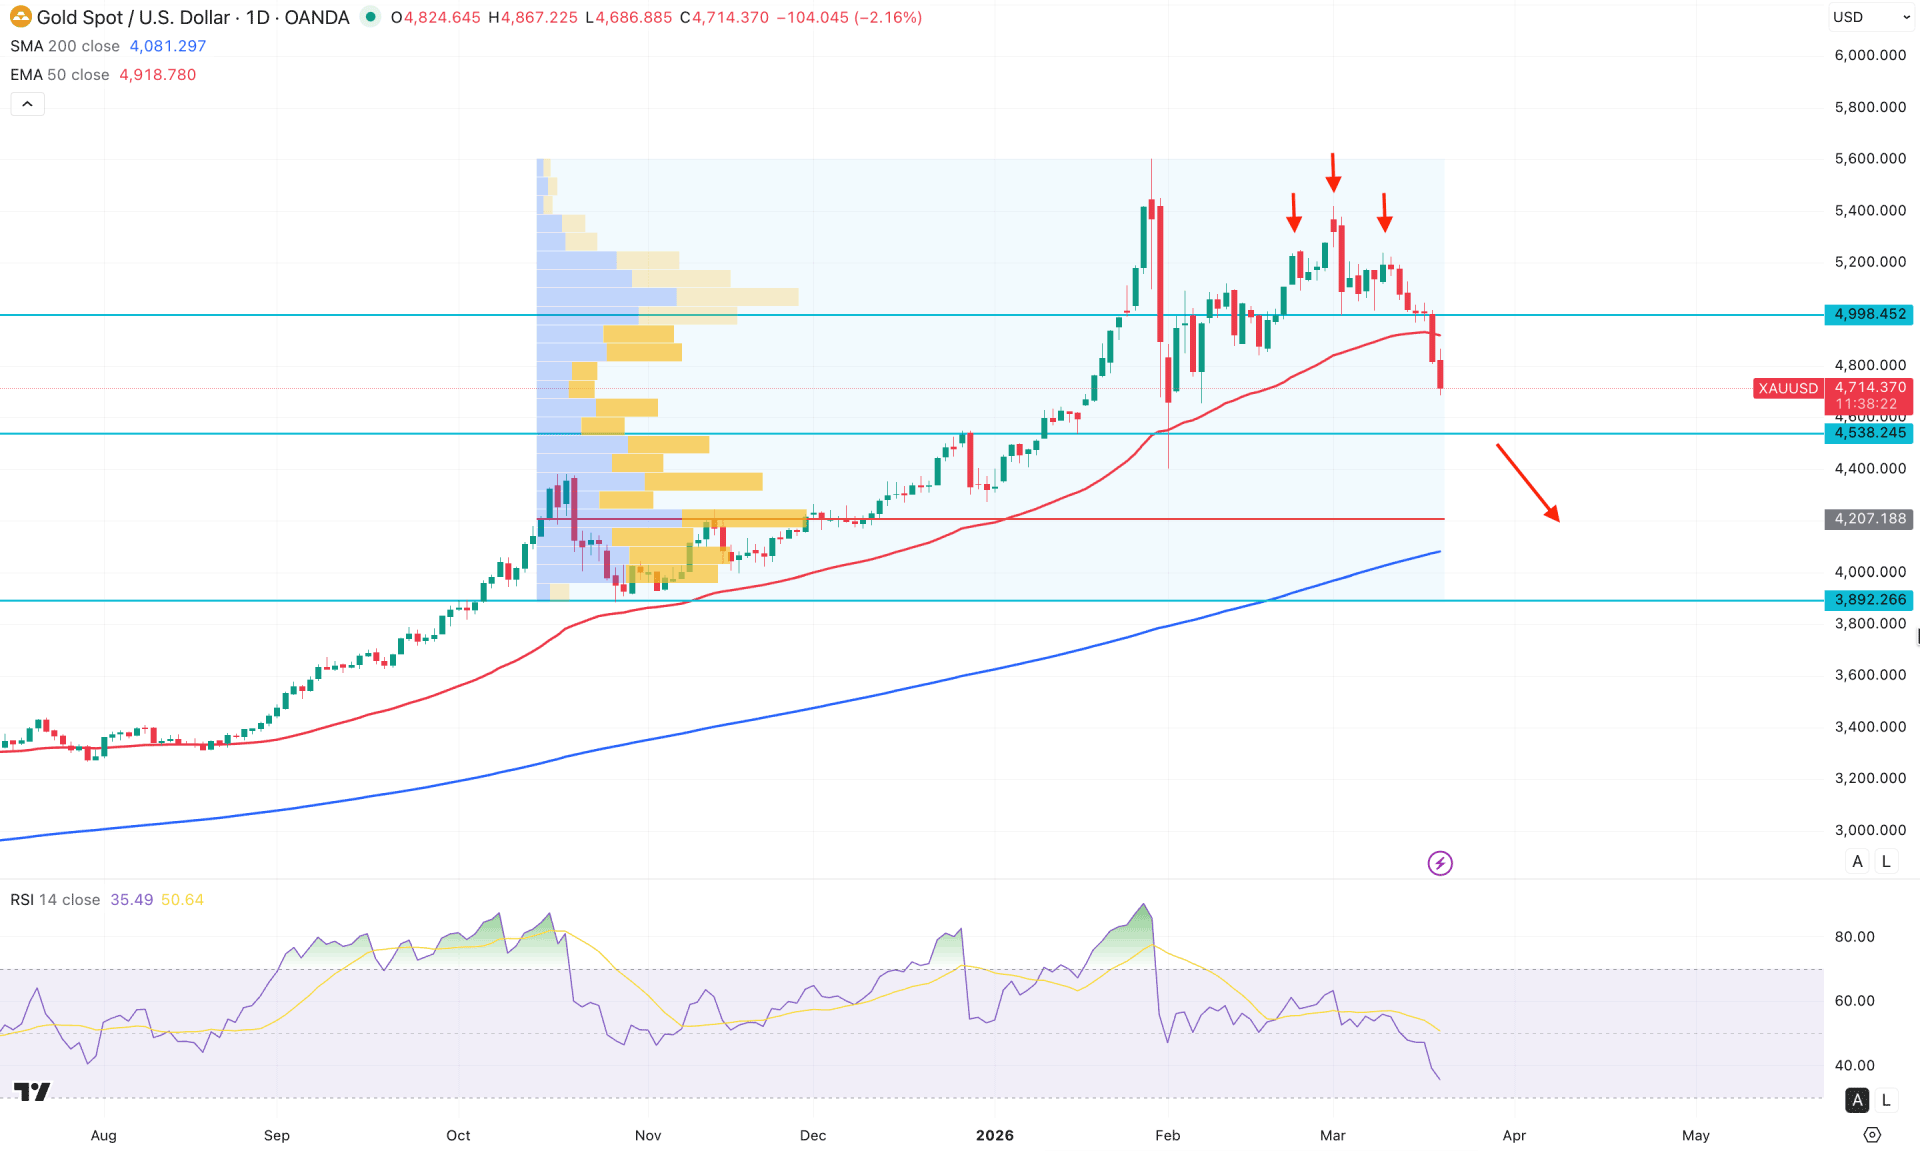
In the daily chart of gold, the recent price shows extended volatility, as it remains unstable after moving above the 5400.00 level. As a result, a potential bearish reversal has formed, followed by a hidden head-and-shoulders breakout, which could offer a decent short opportunity.
Looking at the higher timeframe, the price action is still bullish, although a decent downside correction is visible. On the monthly timeframe, the current candle is trading bearishly, pushing the price below the existing monthly flip zone at the 4775.26 level. As long as the price remains below this crucial flip zone, the primary expectation would be to look for short opportunities. The weekly timeframe also appears bearish, with three consecutive bearish candles visible. An impulsive bearish move is forming below the 5000.00 psychological level, suggesting that a bullish opportunity requires further confirmation.
In the main price chart, the latest daily candle is trading below the 50-day EMA, signaling minor to medium-term bearish pressure in the market. However, the 200-day SMA is still below the current price, leaving room for a potential rebound to the bullish side.
In terms of volume, buyers still appear favorable, as the largest activity level since November 2025 is at 4207.18, which is significantly below the current price. However, as the recent price is at an extreme high with a bearish reversal pattern forming, further downside correction is likely, even though the broader structure remains bullish.
The Relative Strength Index shows that the current level is still above the 30.00 oversold line, indicating there is more room for downward movement. Meanwhile, the Average Directional Index has turned down from the 60.00 level, suggesting weakening trend strength and the possibility of a corrective market phase.
Based on the overall market structure, XAUUSD is trading below multiple crucial support levels, which could result in a bearish trend extension. The neckline of the head-and-shoulders breakout is located at 4998.45, just below the 5000.00 psychological level. As long as this level holds, further downward pressure could emerge. Immediate support is at 4538.24, and extended selling pressure below this level could push the price toward the 4207.18 high-volume support zone.
On the bullish side, any immediate rebound from the current price area, supported by a strong daily candle closing above the 50-day EMA, could invalidate the bearish outlook. However, failure to rebound may lead the price to find support at the 4538.24 level, from where a corrective bullish trend could develop.
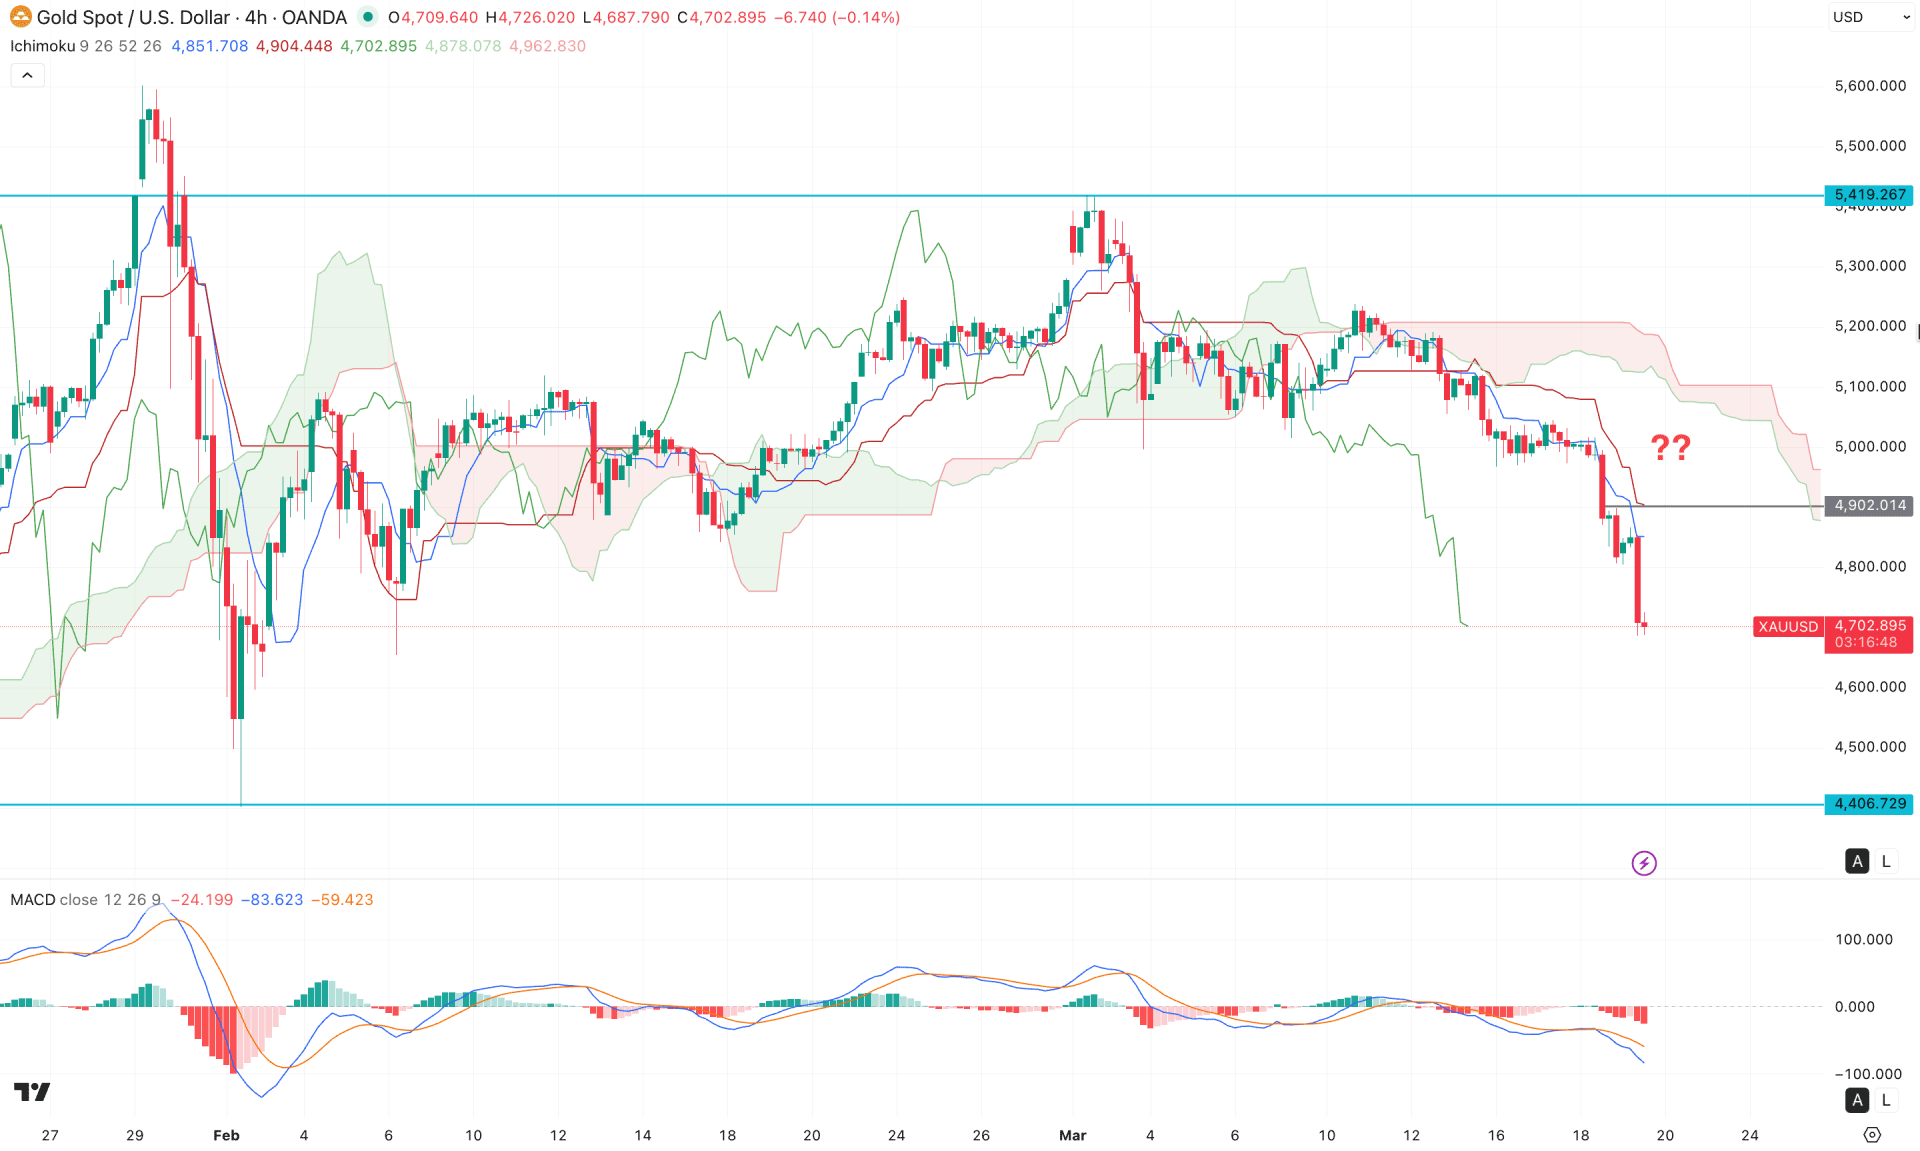
In the four-hour timeframe, the ongoing market momentum is extremely weak, as the price continues to move lower below the Ichimoku cloud area. The future cloud is also supporting sellers, with both leading spans trending downward. Due to strong selling pressure, the gap between the current price and the dynamic Kijun-sen has widened, which may trigger a short-term bullish recovery before the current downtrend resumes.
In the indicator window, the MACD signal line is highly bearish, with no signs of bottom formation. The histogram continues to slope downward, with multiple negative bars below the neutral line, indicating sustained bearish momentum.
Based on the current market structure, the bearish pressure remains impulsive, although a bullish correction is possible. As long as the price stays below the 4902.01 resistance level, the ongoing pressure may extend further and find support around the 4500.00 area.
An alternative approach would be to look for a bullish four-hour candle closing above the 4902.01 level, which could open the door for a move toward the 5100.00–5050.00 resistance zone.
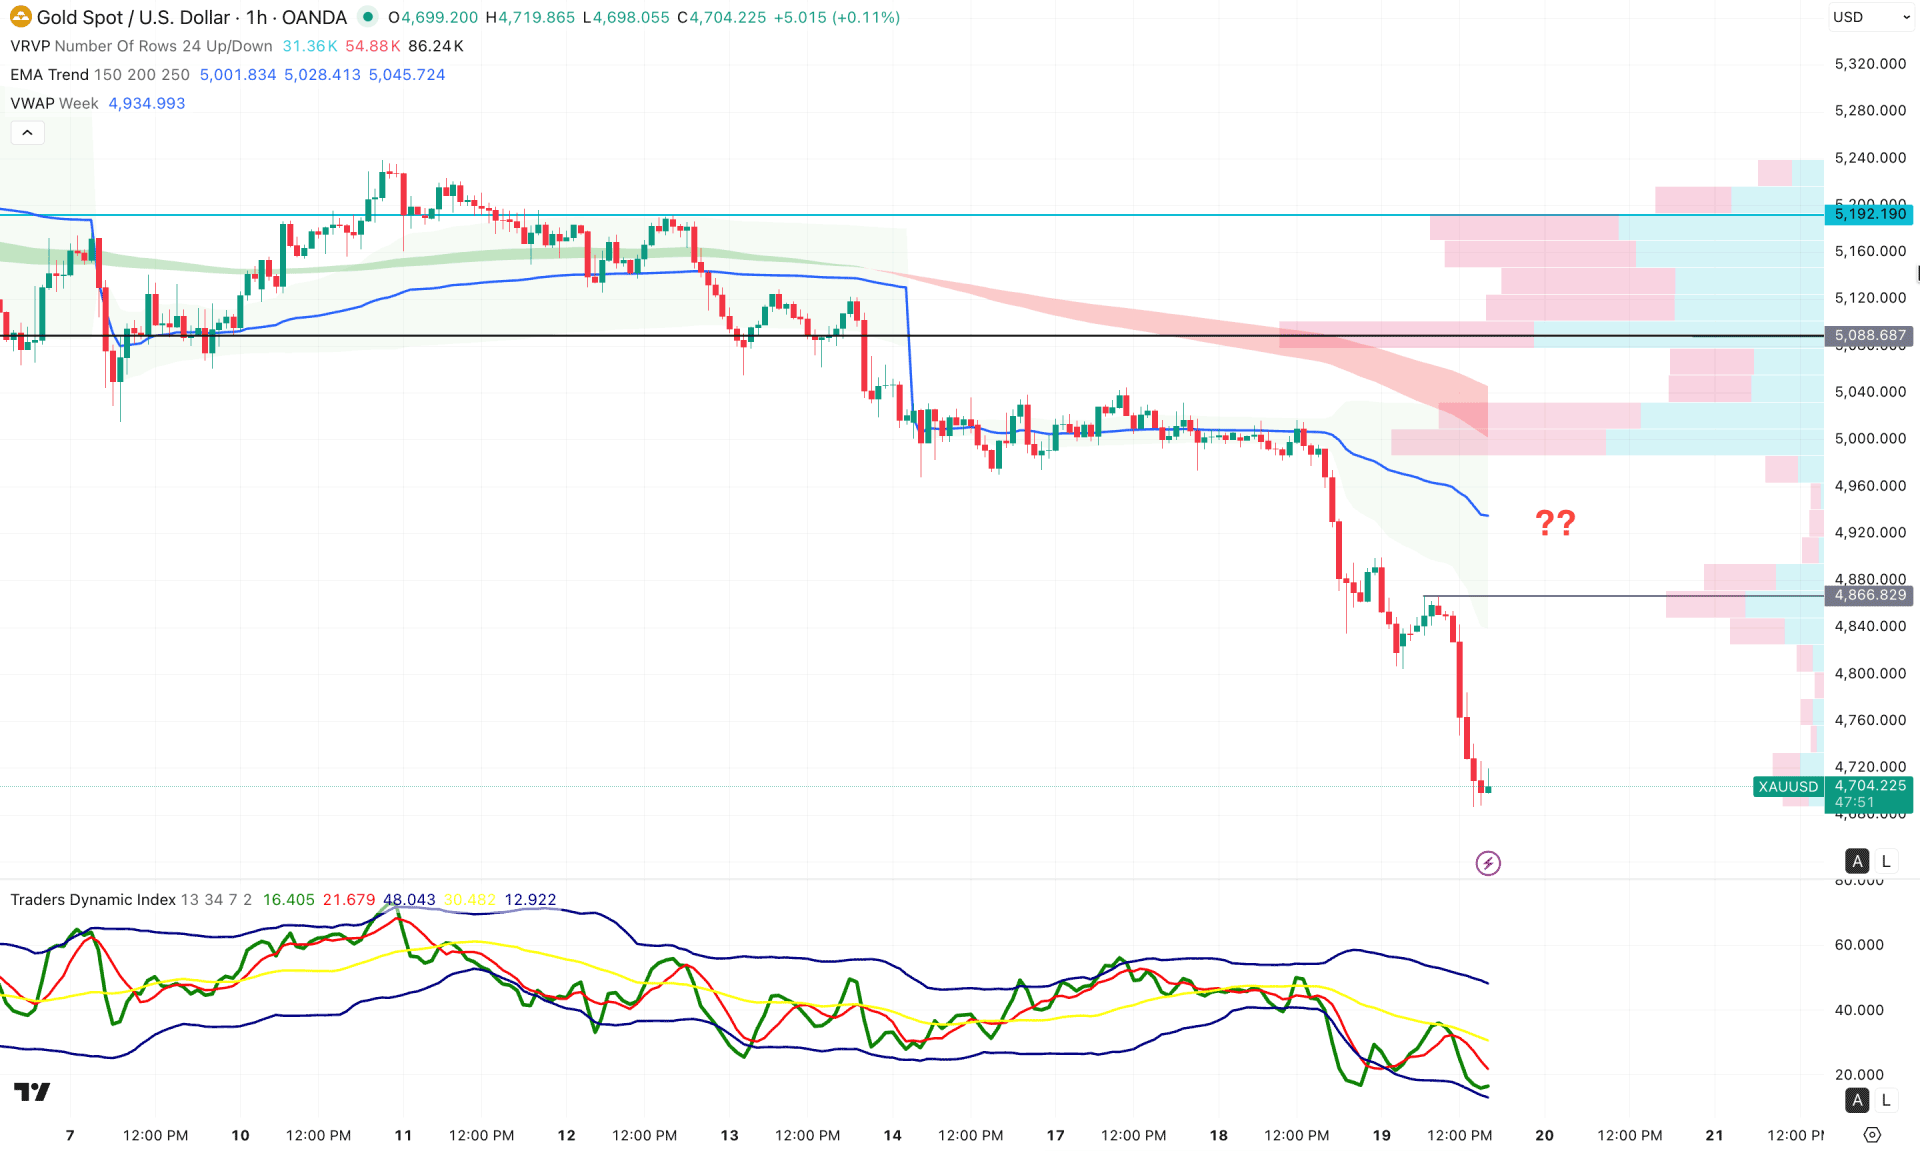
On the hourly timeframe, the current market momentum is extremely bearish, with no signs of bottom confirmation. The primary trading idea within this impulsive bearish pressure is to wait for a correction and then follow the prevailing trend from a reliable level.
In the current chart, the price has overextended its move from the high-volume level at 5088.68. Additionally, both the EMA wave and the VWAP line are positioned above the current price, with a downward slope, indicating a continuation of the bearish trend.
Based on the overall market structure, further bearish continuation is likely as long as the price remains below the 4866.82 swing high. However, any bullish recovery with an hourly close above the VWAP line could extend buying pressure toward the 5000.00 level before presenting another short opportunity.
Based on the overall market structure, XAUUSD is trading within a strong bearish trend, where more downside pressure could come. As the intraday price is extremely bearish, investors should wait for a reliable correction before following the market flow.


