
Published: October 19th, 2023
The enhanced risk aversion among market participants kept gold prices upward throughout the week. The increase in risk aversion followed the explosion at a hospital in Gaza, which prompted Israel and Palestine to trade responsibility for the incident. The resulting impact and repercussions reignited fears of a wider conflict, propelling the price of gold to $1950 per ounce.
Positive economic indicators persisted for another week in the United States, with retail sales exceeding expectations. Consequently, projections for a rate rise by the Federal Reserve at its December meeting have increased modestly. While some Fed policymakers have not ruled out further rate increases, they emphasize the significance of impending data.
The Fed is also encouraged by the upward trend of longer-dated U.S. Treasury securities. This week, the yield on the 10-year U.S. Treasury reached multi-year highs, with policymakers believing that higher yields on longer-dated Treasuries could alleviate some of their concerns.
Any escalation of U.S. involvement in the conflict could lead to a further increase in gold prices. If the conflict continues without a ceasefire or resolution, the $2,000 level will remain vulnerable, necessitating close monitoring in the coming days.
The Middle East is expected to pose the greatest threat to gold prices for the remainder of the week. In the coming days, no high-impact data releases are anticipated to impact Gold and Silver prices significantly. This is evidenced by the fact that Gold and Silver continued their upward trend despite the dollar's rise.
Let’s see the upcoming price direction from the XAUUSD technical analysis:
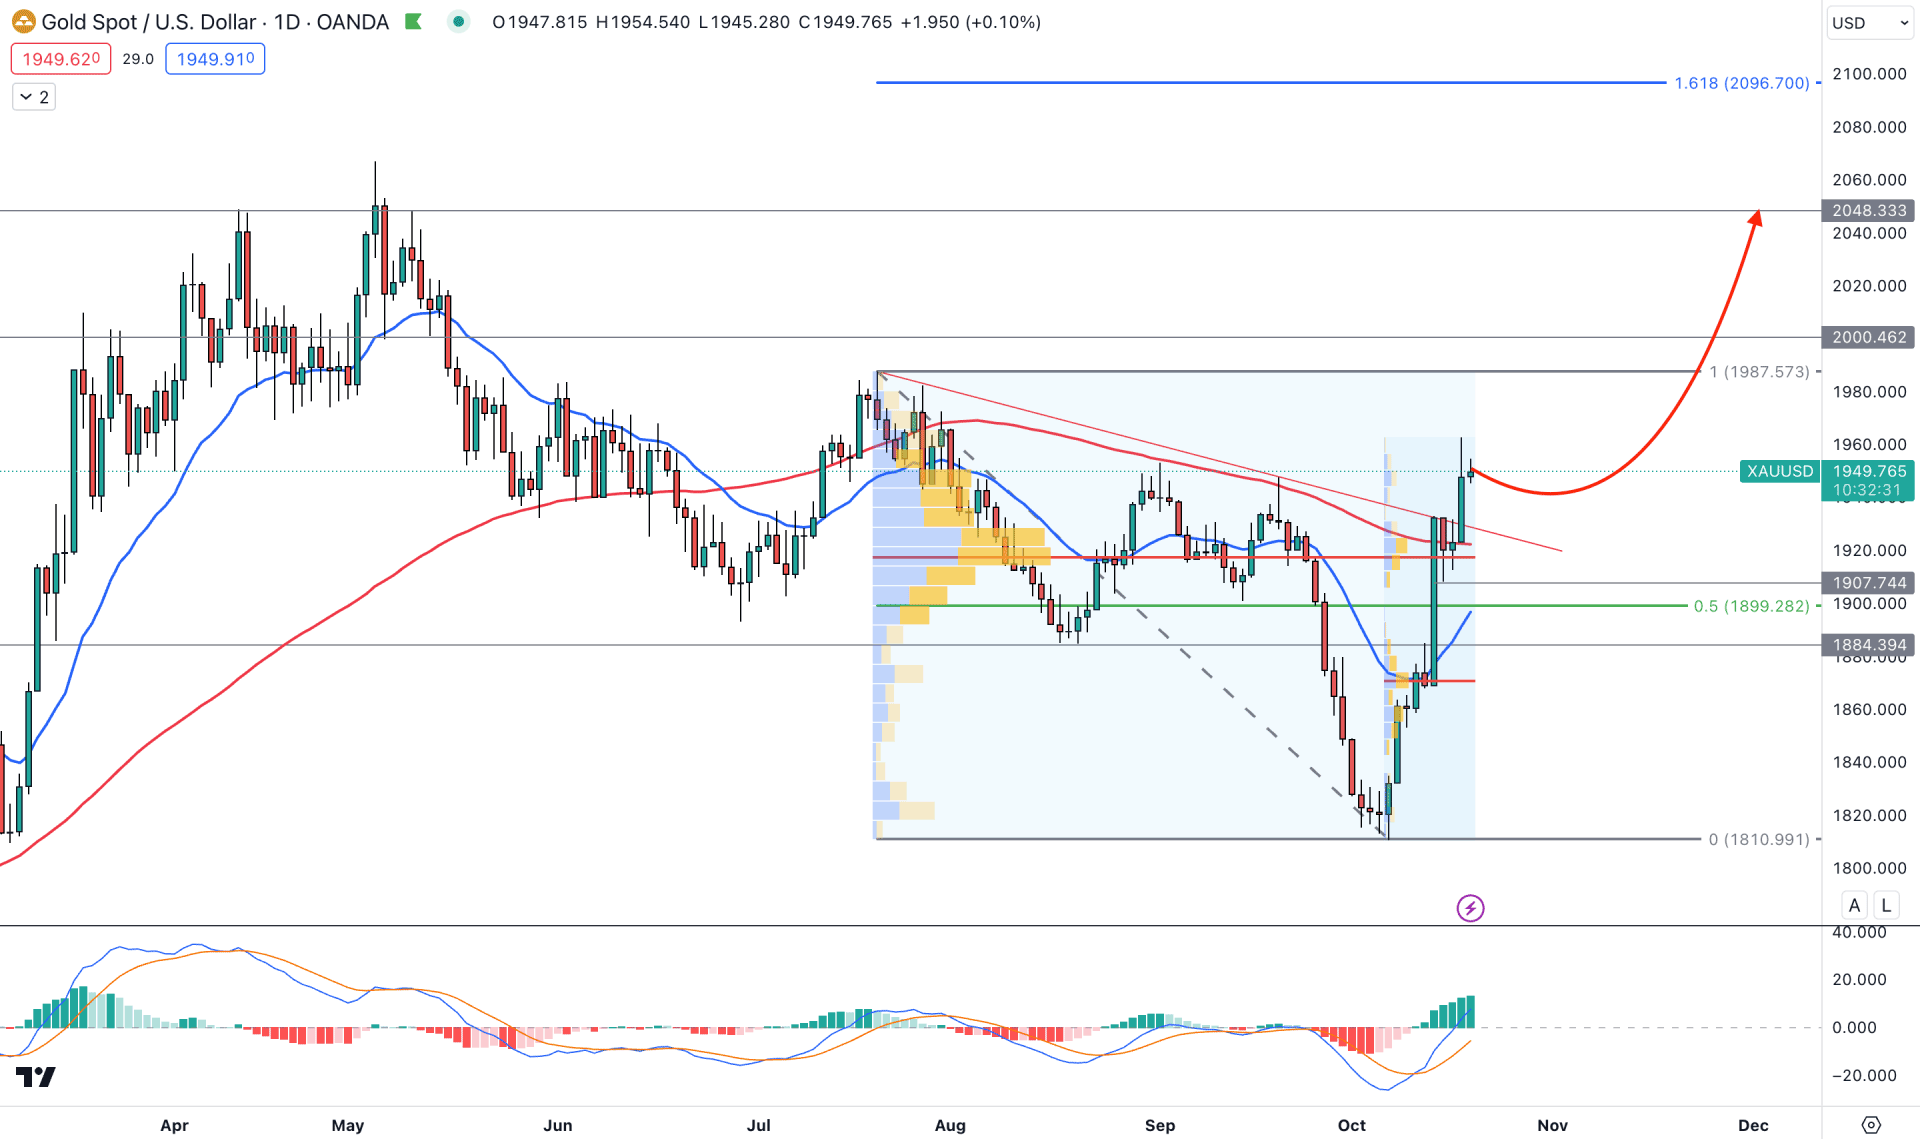
In the daily chart of XAUUSD, the recent V-shape recovery with a counter-impulsive momentum is the primary signal of possible bullish pressure. Moreover, the ongoing tension in the Middle East could work as an additional bullish factor for XAUUSD.
In the higher timeframe price action, a strong upside pressure is visible as the current monthly candle hovers above the September high. Moreover, the weekly candle formed a bullish two-bar reversal with a clear V-shape recovery. Therefore, the higher timeframe clearly shows a sellers’ failure in the market, which could result in a strong bullish trend continuation.
In the daily chart, a strong bullish price action is visible above the 100 and 20-day Simple Moving Average, which is a sign of an active bullish trend. Moreover, a strong bullish candle is also visible above the 1834.39 static level, which could be an additional bullish signal for XAUUSD.
The MACD Histogram is bullish in the secondary window, while the MACD signal line is aimed higher with a bullish crossover.
In the volume structure, the most active level since the July 2023 high is at the 1920.00 level, which is below the current price. Moreover, another strongest level since the 6 October low is at 1870.77 level. As both levels are below the current price, any long opportunity could work as a profitable trading signal.
Based on the daily market outlook, the upcoming price direction for XAUUSD would be bullish as long as it holds the buying pressure above the 1907.88 near-term swing low. In that case, the ongoing upside pressure could extend towards the 2000.00 psychological level.
On the bearish side, a sharp downside pressure with a daily candle below the 1900.00 psychological level could invalidate the ongoing buying pressure. In that case, investors might expect the bearish pressure to reach towards the 1874.00 demand level.
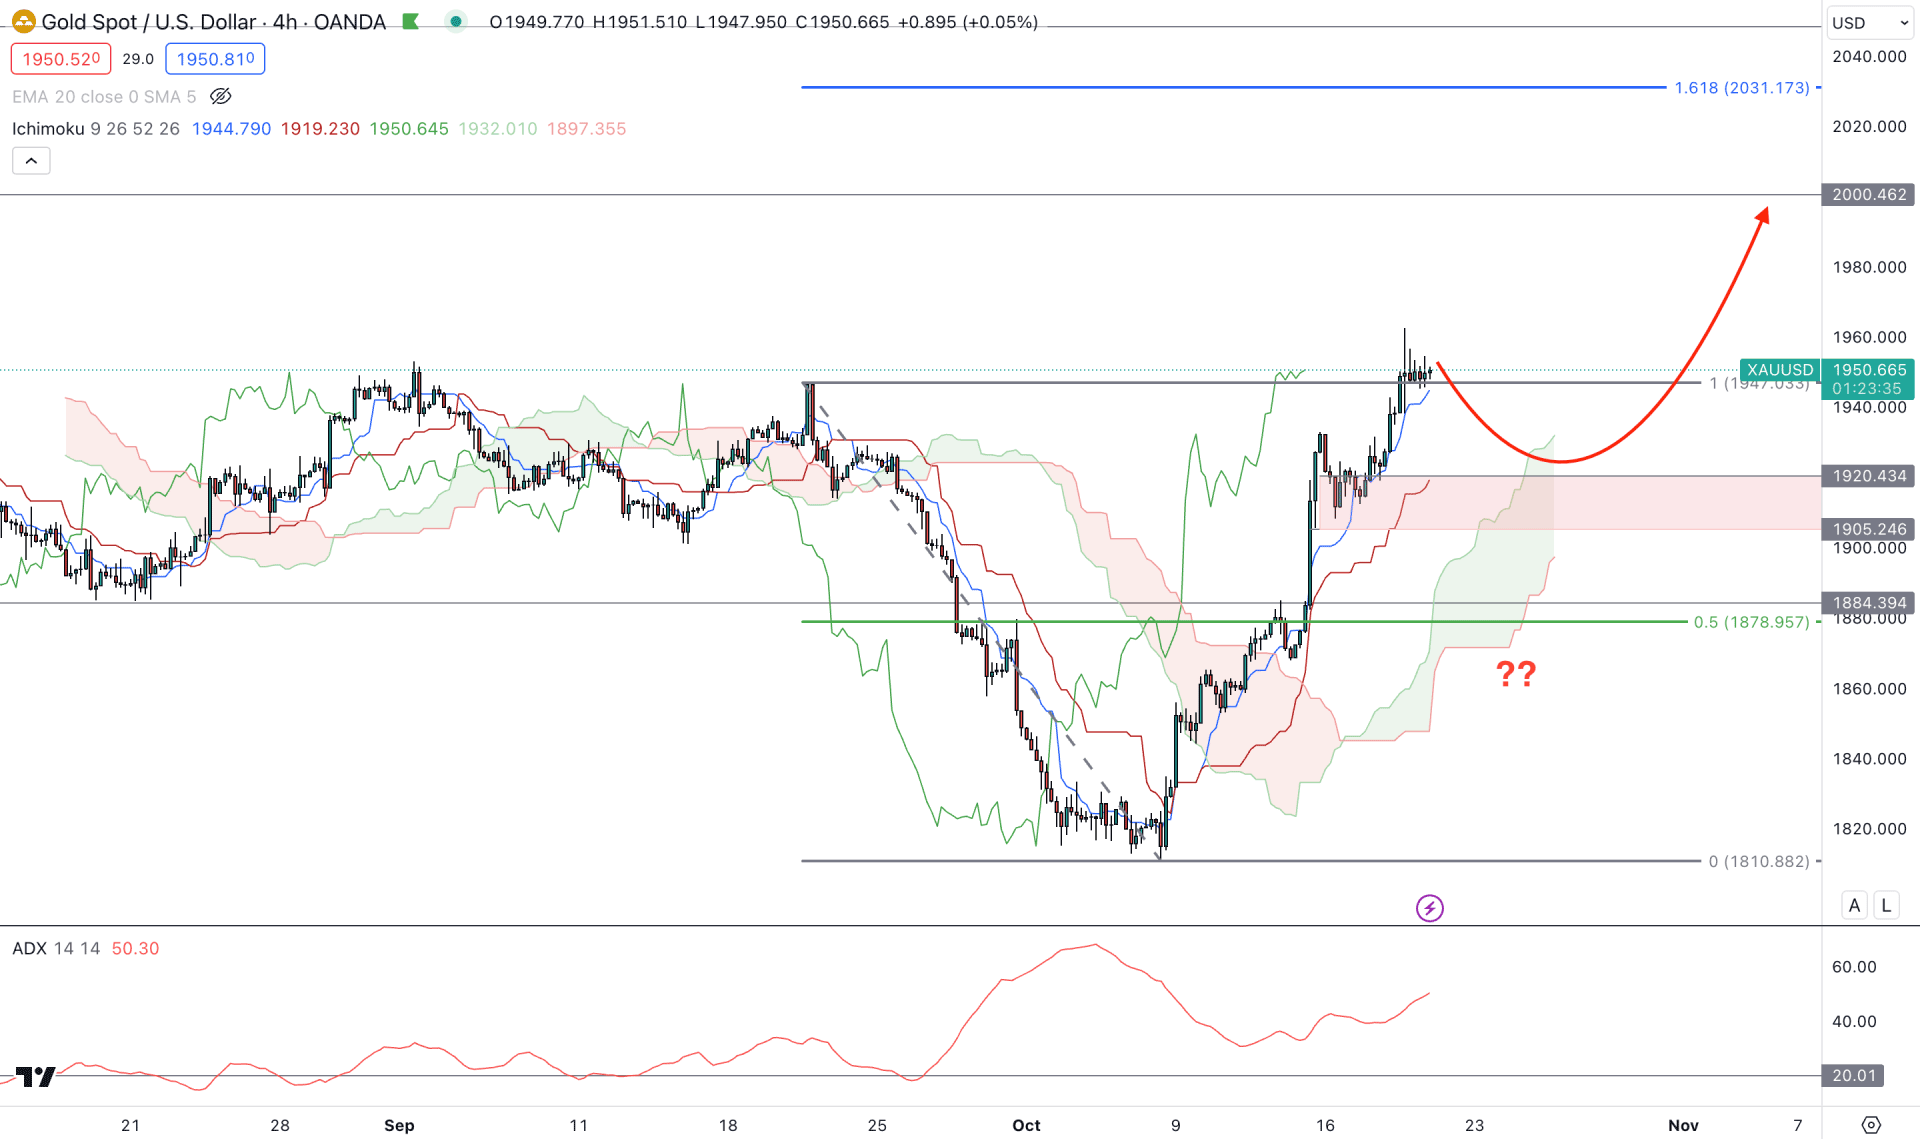
In the H4 chart, the broader market direction is bullish as the recent price moved above the Ichimoku Cloud zone with a bullish impulsive pressure. Moreover, the current ADX reading is 50.81, which indicates an ongoing trend.
In the future Ichimoku cloud, the Senkou Span A and B show upward pressures, while the Kijun Sen is working as a near-term support. Also, the price formed a rally-base-rally formation within the bullish trend, which could signal a possible bullish momentum.
Based on the H4 outlook, a minor downside correction is possible towards the 1900.00 area, but a solid bullish rejection from the 1925.00 to 1905.00 area could be a valid long opportunity. In that case, the upward pressure could reach towards the 2031.17 level, which is the 161.8% Fibonacci Extension level from the latest swing.
On the bearish side, a sharp bearish H4 candle below the 1884.39 static support level could limit the gain at any time.
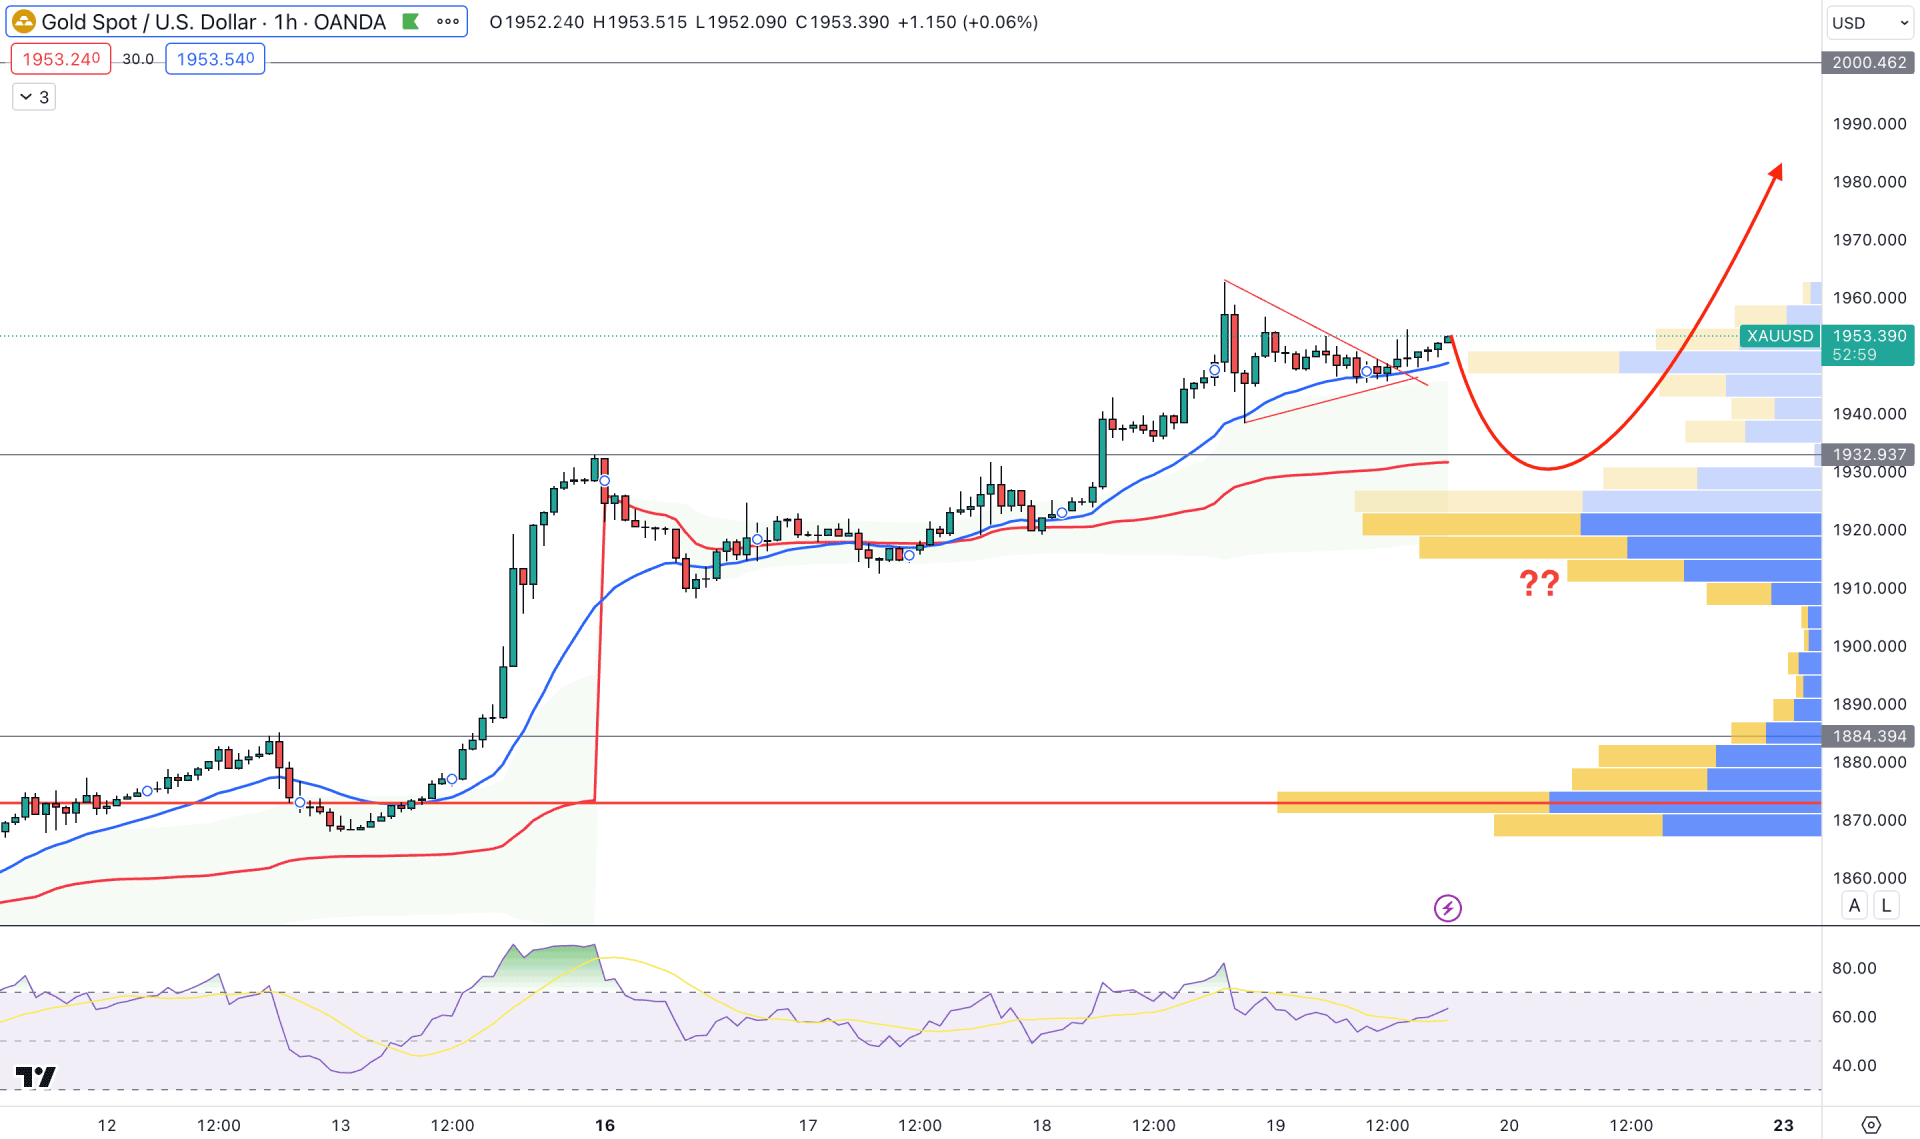
In the hourly chart, an ongoing bullish trend is visible, where a visible range high volume level below the current price supports the broader upside movement. Moreover, a bullish pennant pattern breakout from the dynamic 20 EMA support confirms the upward pressure.
In the indicator window, the Relative Strength Index (RSI) shows a stable momentum above the neutral 50.00 level.
Based on the hourly outlook, a sell-side liquidity sweep from the dynamic VWAP support could be a potential long opportunity in this pair, targeting the 1990.00 level. However, a deeper correction is possible towards the 1910.00 swing low, but breaking below the 1905.00 level could lower the price in the coming hours.
Based on the current multi-timeframe analysis, the broader market momentum is bullish, where an additional bullish rejection in the intraday chart could offer a trend trading opportunity. However, the ongoing volatility due to the war could be a matter of consideration, where any uncertain situation could create an excessive movement in Gold.


