Published: March 6th, 2025
In recent times, the price of gold (XAU/USD) has drawn some sellers, but it still holds beyond the $2,900 round number. The latest trade tariffs imposed by the US on Canada and Mexico included some concessions, which increased investor demand for riskier investments and ultimately caused movements out from safe-haven precious metals. Other than this, there is no underlying reason for the intraday decline, and it is more inclined to stay constrained.
The price of gold, a safe haven, continues to be driven by investors' concerns about US President Donald Trump's tariff policies and the growing possibility of a global trade war. Furthermore, the bullion's fall should be limited by concerns that Trump's plans will hamper US economic expansion and require the Federal Reserve (Fed) to slash interest rates several times in 2025. Consequently, negative traders should be cautious.
On Tuesday, US President Donald Trump doubled charges on Chinese goods to twenty percent and imposed fresh 25% tariffs on the majority of imports from Canada and Mexico. In retaliation, China imposed up to 15% tariffs on a range of US agricultural exports, while Canada declared retaliatory duties against over $100 billion worth of US goods.
Concerning the tariffs placed on Canada and Mexico, the White House declared that US automakers would have to wait one month before they could comply with the terms of the US–Mexico–Canada Agreement. Investors' desire for risky assets is thus increased, which prevents traders from making strong bullish wagers on the safe-haven XAU/USD combination. Although the spotlight is still on Friday's US Nonfarm Payrolls, investors now turn to the US's regular Weekly Initial Jobless Claims report for some boost.
Let's see the complete outlook for this instrument from the XAUUSD technical analysis:
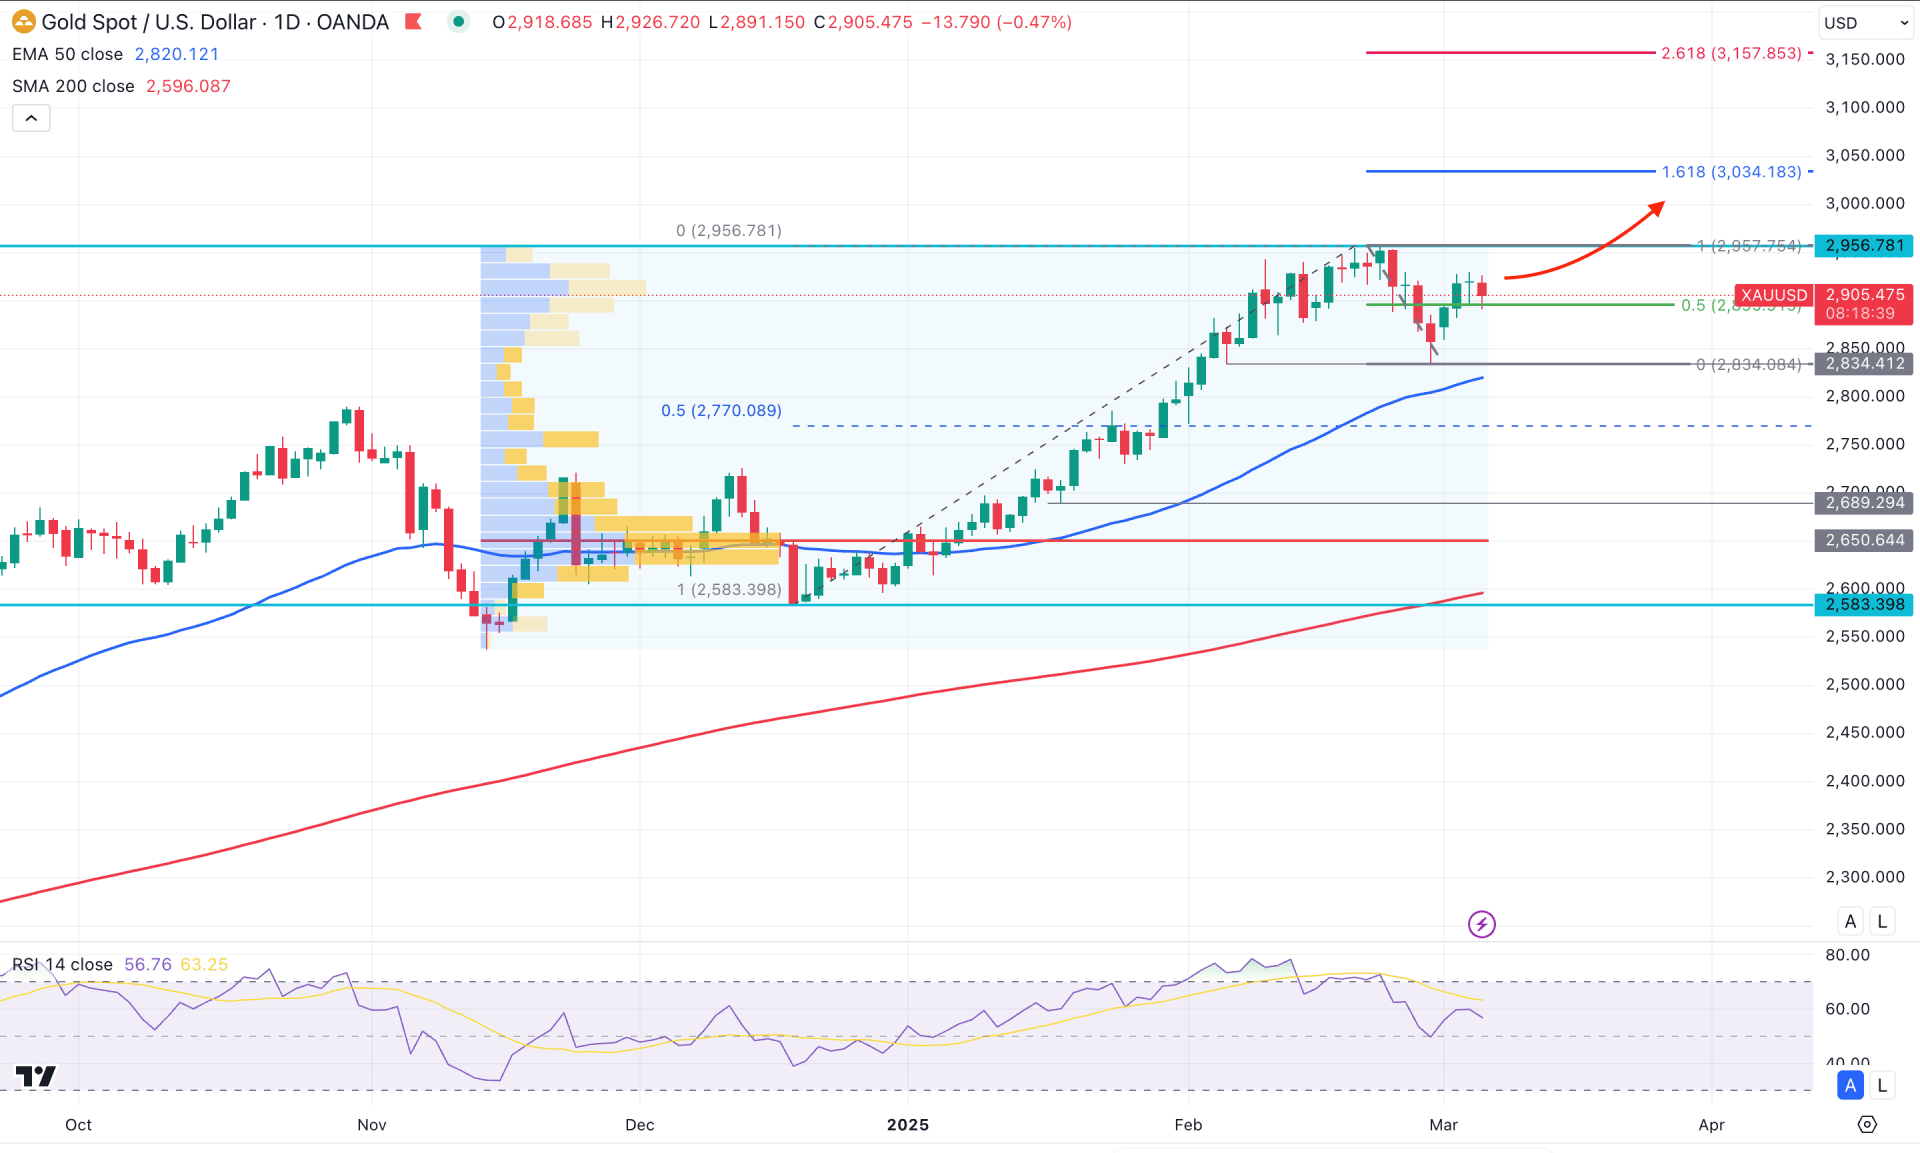
In the daily chart of gold, extended buying pressure from the 2583.39 level fueled the momentum and pushed prices to a new all-time high at the 2956.57 level. After reaching the peak, the market formed a new swing low, signaling the primary sign of a downside correction.
In the higher time frame, the price is still trading above the February 2025 high, indicating a bullish continuation. However, investors should monitor how the price behaves relative to the monthly open, as a drop below the 2871.18 level could eliminate all the gains from the entry point. The weekly chart already shows signs of recovery, with a strong engulfing candlestick pattern forming from the previous all-time high. Since the current price is trading within an inside bar, a solid break below the weekly low could signal a downside continuation.
Even though the major market trend is bullish, the volume structure looks favorable to sellers. No high volume level has formed above the all-time high to suggest a trend change; however, the existing high from November 2024 at 2634.75 is also below the current price. Considering the sentiment, an extensive downside correction is likely, which needs to be completed before prices can continue higher.
Looking at the main chart, the 200-day Simple Moving Average and the 50-day Exponential Moving Average aimed higher, signaling a potential bullish continuation opportunity. As the current price is trading above these key levels, the dynamic suggests a potential downside correction is still pending.
Based on the daily market outlook, gold is trading with strong momentum supported by several fundamental factors. In this case, investors should remain cautious before opening a short position, as further indications of a trend reversal are needed. Until then, the bullish continuation remains likely, with a break above the 2928.69 level, potentially initiating a continuation towards the 3000.00 psychological level.
On the bearish side, more downside correction is likely, with immediate support at the 2834.08 level. Reaching this near-term level could offer another long opportunity at a discounted price. However, a break below the 50-day Exponential Moving Average could lead to consolidation and possibly a move towards the 2689.29 key support level.
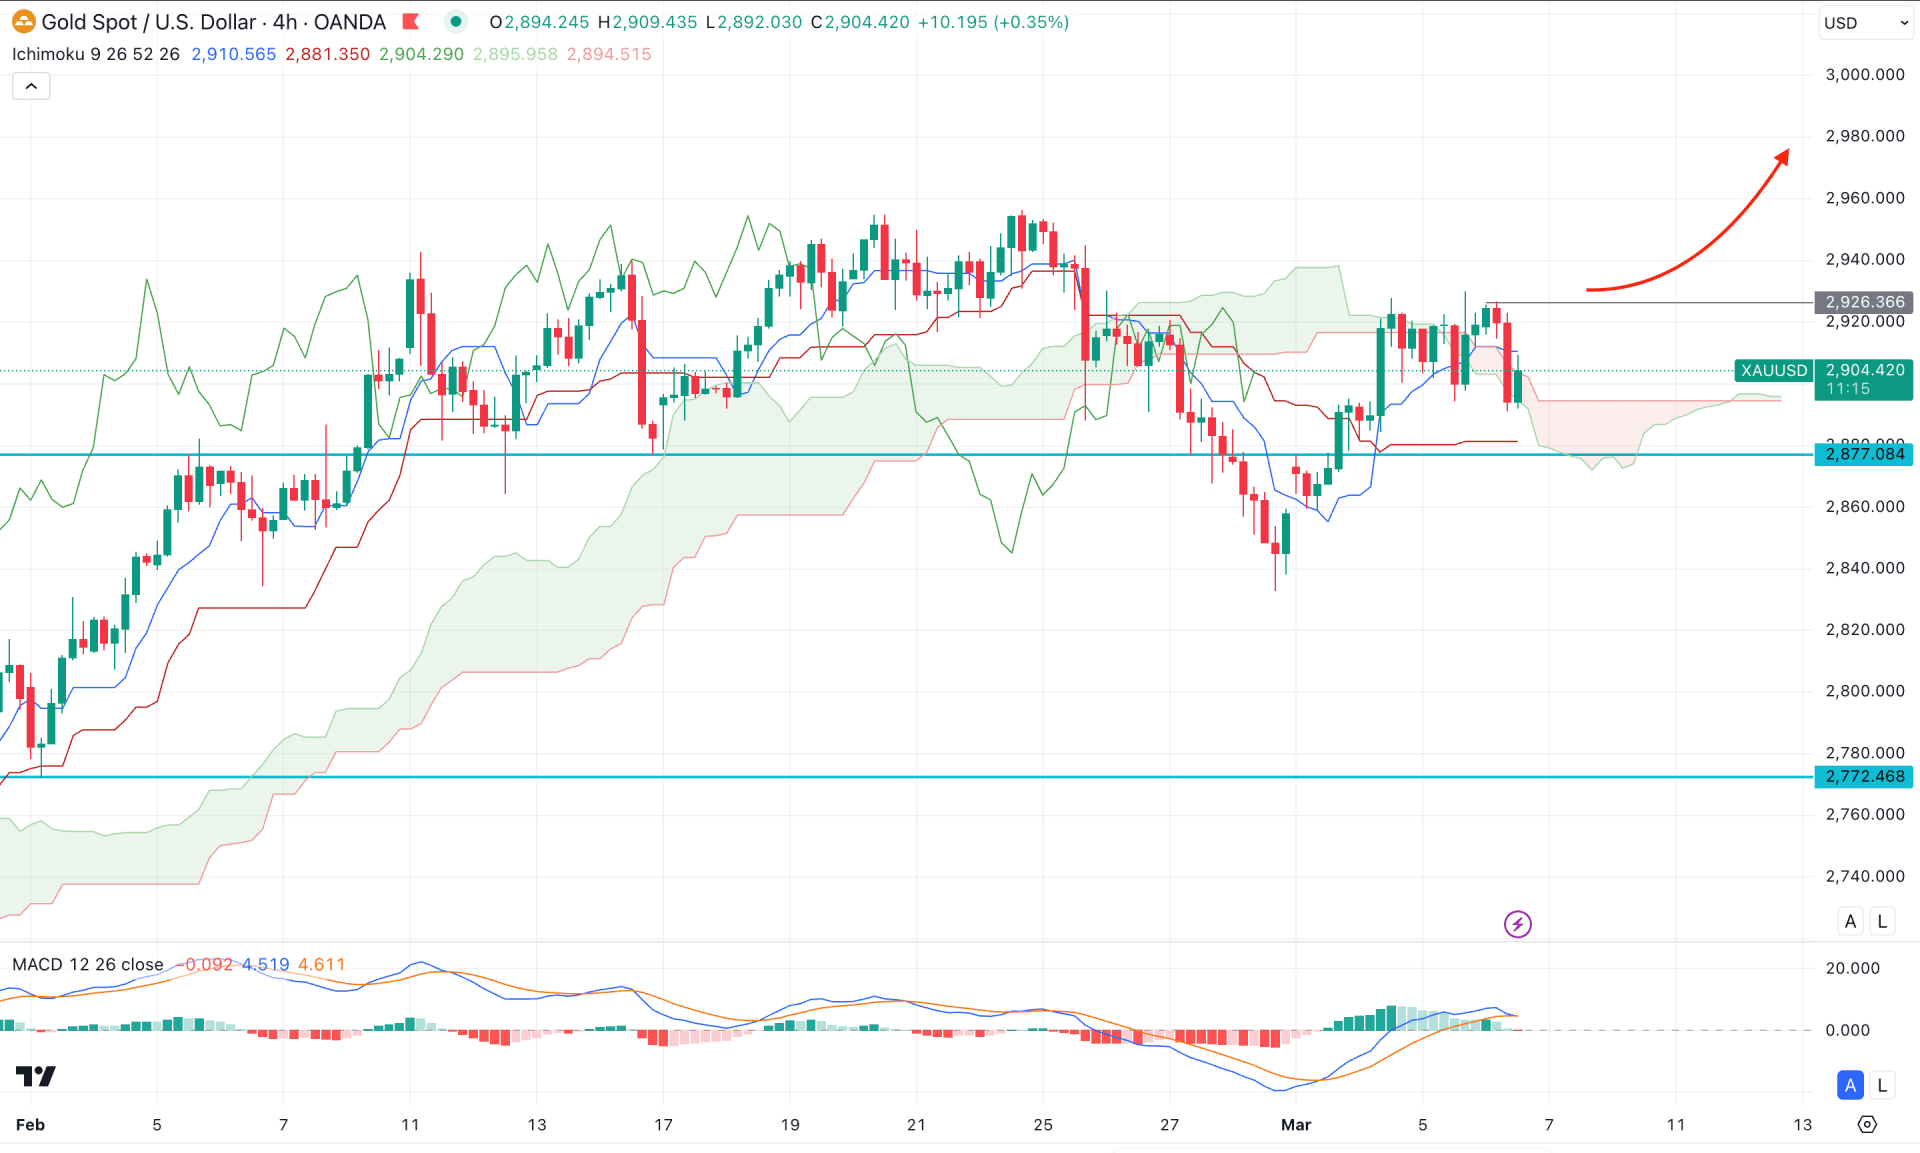
In the H4 timeframe, the broader market direction is sideways. The current price is hovering above the cloud support, but there is insufficient buying pressure above it. Moreover, the thickness of the future cloud is not solid enough to indicate a stable trend.
In the indicator window, the histogram has risen above the neutral point after reaching the highest level in a month. Furthermore, the signal line has formed a bearish crossover from the positive area.
Based on the outlook, a strong bullish reversal is needed before confirming the continuation of the uptrend. The ideal approach is a bullish H4 candle above the 2926.36 resistance level before aiming for the 3000.00 psychological level.
On the other hand, early selling pressure is visible in the indicator window, which requires more confirmation from the candlestick pattern. A bearish break below the 2877.08 level with a redistribution could push the price below the 2800.00 area.
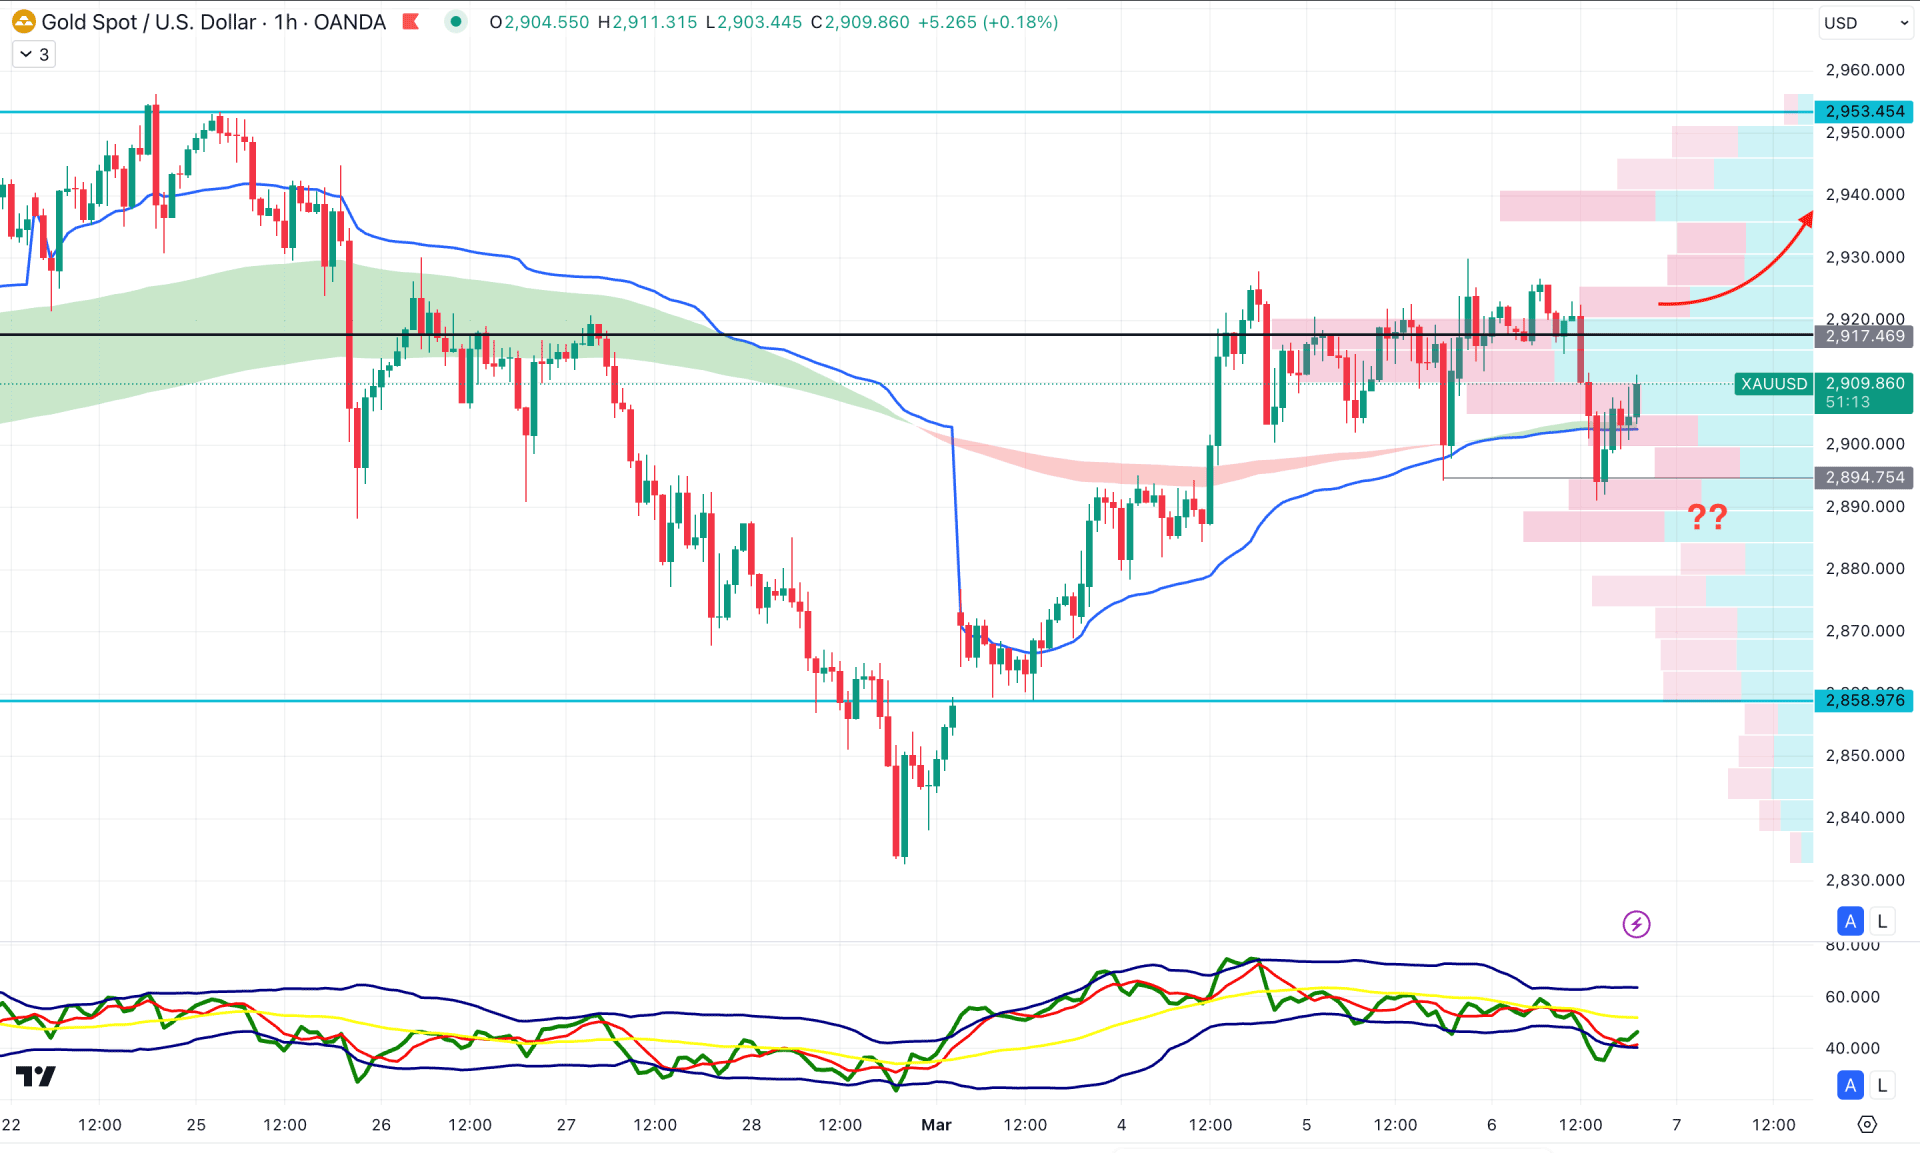
In the hourly time frame, the current price is trading sideways within a bullish rally-base-rally formation. However, the most recent bullish reversal sweeping liquidity from the 2894.76 level could be a potential bullish signal. The high-volume line is above the current price, and there is no clear direction from the moving average wave. In this case, a trend might form after a clear direction is established from the range breakout.
In the indicator window, the Traders Dynamic Index has found the bottom, and a higher rebound is visible. Overcoming the 2917.48 level with a valid hourly candle could present a long opportunity, aiming for the 2853.45 level. On the other hand, immediate selling pressure with a bearish scan below the BWAP line might extend the losses and find support in the 2800.00 to 2870.00 area.
Based on the current multi-timeframe analysis, the XAUUSD price is more likely to maintain the bullish momentum until a strong bearish exhaustion appears at a significant high area. As long as political uncertainty persists in the trade war sentiment, a bullish continuation is likely to appear. In that case, the ideal trading approach should be to look for a minor bullish recovery from a pullback with a valid candle formation.


