
Published: December 6th, 2023
The US Dollar has halted its two-day recovery despite the downgrade of China's government credit ratings outlook from stable to negative by Moody's Investors Service. In contrast, Moody's upheld the "A1" long-term rating for China's sovereign bonds.
Investor sentiment is being affected by the uncertainty surrounding the interest rate prognosis of the US Federal Reserve. The Services PMI for November increased to 52.7 from 51.8 in October, whereas US JOLTS Job Openings fell to 8.733 million, the lowest level in two and a half years.
A deterioration in risk sentiment and a robust US employment report may offer supplementary backing for the ongoing recovery of the US Dollar, thereby instigating a renewed decrease in the price of gold.
Let's see the future price direction of Gold from the XAUUSD technical analysis:
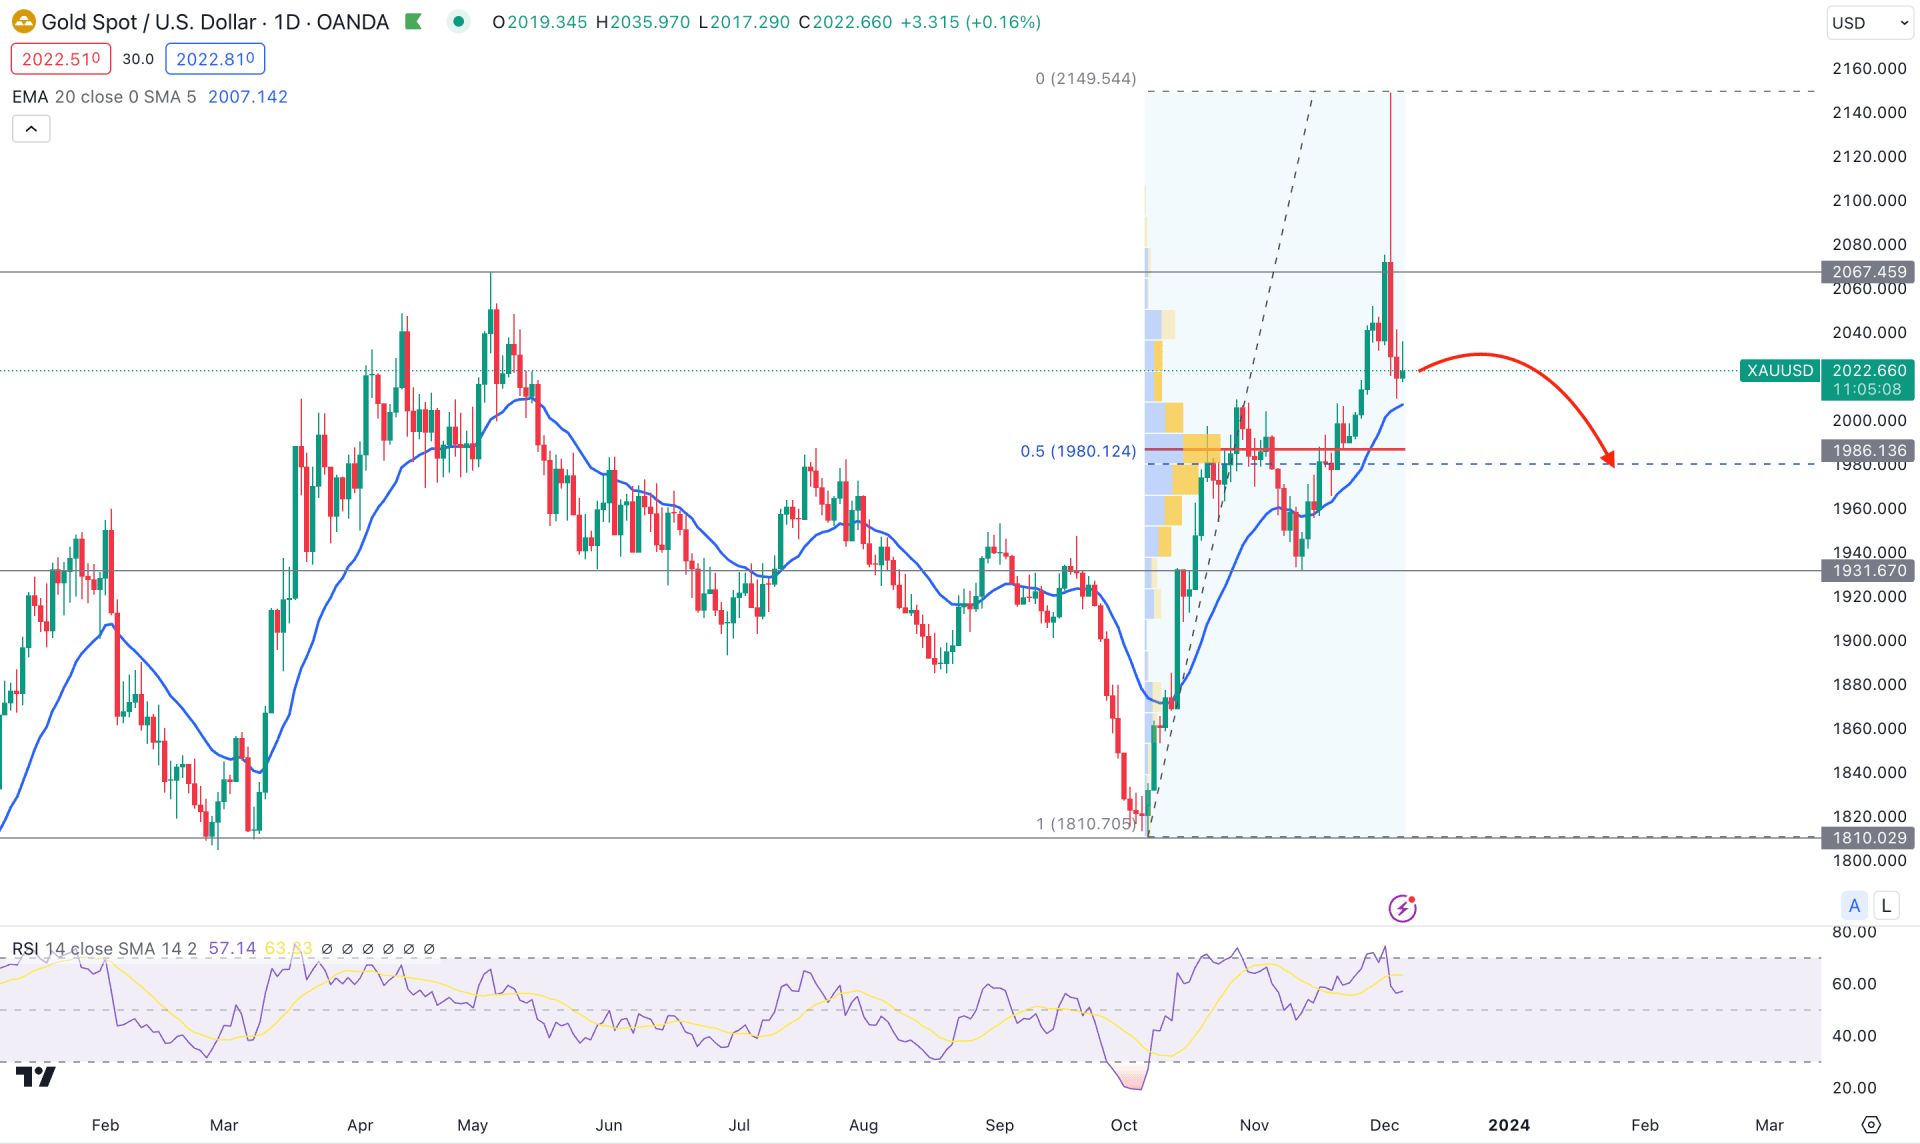
The overall market momentum in the daily chart of XAUUSD is bullish as the current price still trades above the dynamic 20 EMA. Moreover, the bullish pressure above the all-time high and an immediate bearish reversal indicates a strong buy-side liquidity sweep, which could end up changing the existing market trend.
The 50% Fibonacci Retracement level from the 1810.00 low to the 2149.54 high is at the 1890.12 level. Therefore, as the current price trades above the 1890.12 level, we may consider it a premium zone, from where a downside pressure might provide a higher return.
In the higher timeframe, the current bearish pressure in the weekly timeframe still remains within the last bullish week's body, which suggests ongoing buying pressure. In that case, investors should monitor how the weekly candle closes after the Non-farm payroll release. If bears can hold the loss below the 2009.00 support level, we may see additional selling pressure in the coming weeks.
In the volume structure, the most active level since October 2023 is found at the 1986.00 level, which is just above the 1980.12 level. As bearish exhaustion is present from the all-time high level, we may consider the 1980.12 high volume level to be the primary barrier to sellers. In that case, investors should monitor how the price reacts in this zone, from where a bullish reversal could appear.
In the daily chart, the dynamic 20 EMA is acting as an immediate support from where a bullish reversal may come. Moreover, the 14-day RSI formed a bearish reversal from the overbought 70.00 level, which supports the ongoing selling pressure.
Based on the daily outlook, the current bearish pressure could test the 1980.00 support level. However, the downside possibility depends on how the high-volume data comes out next Friday. A bearish daily candle below the 1977.00 level could extend the loss toward the 1931.00 support level.
On the bullish side, a struggle to break below the dynamic 20 EMA could indicate a trend reversal possibility in this pair, which can resume the gain towards the 2100.00 psychological level.
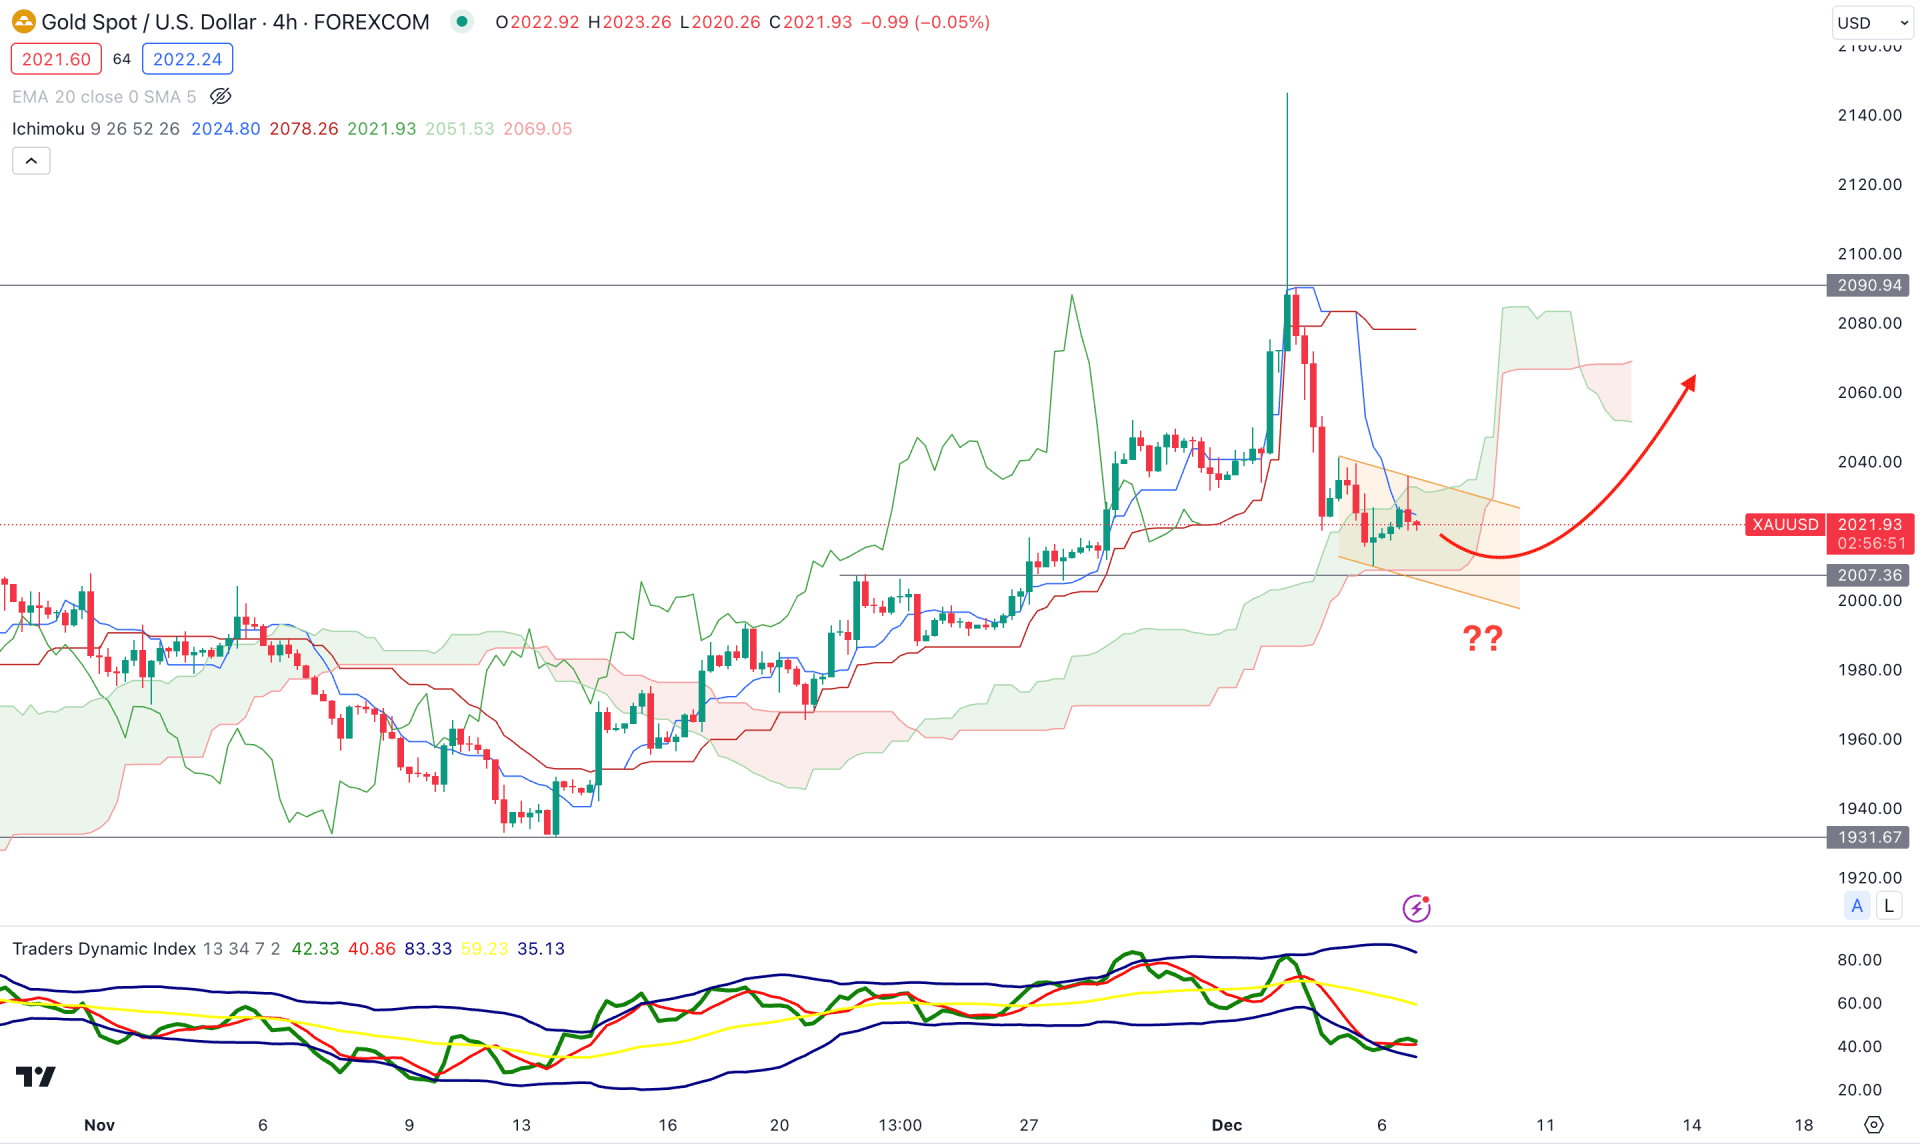
In the H4 chart of XAUUSD, the overall market momentum is indecisive, as the latest impulsive downside pressure faced a barrier at the Ichimoku Cloud support.
In the future cloud, a bearish flip is seen, suggesting a trend reversal. Moreover, the Senkou Span A is below the Senkou Span B, which indicates a bearish continuation.
In the secondary window, the dynamic TDI level shows an oversold condition as it reaches the lower band zone. In that case, a bearish trend continuation is possible as long as the TDI level remains below the 50.00 line.
Based on the H4 structure, a bullish channel breakout with an H4 close above the 2036.00 level could be a bullish opportunity, targeting the 2080.00 level.
On the bearish side, an additional downside pressure below the Cloud support could extend the loss, where the main aim is to test the 1950.00 level.
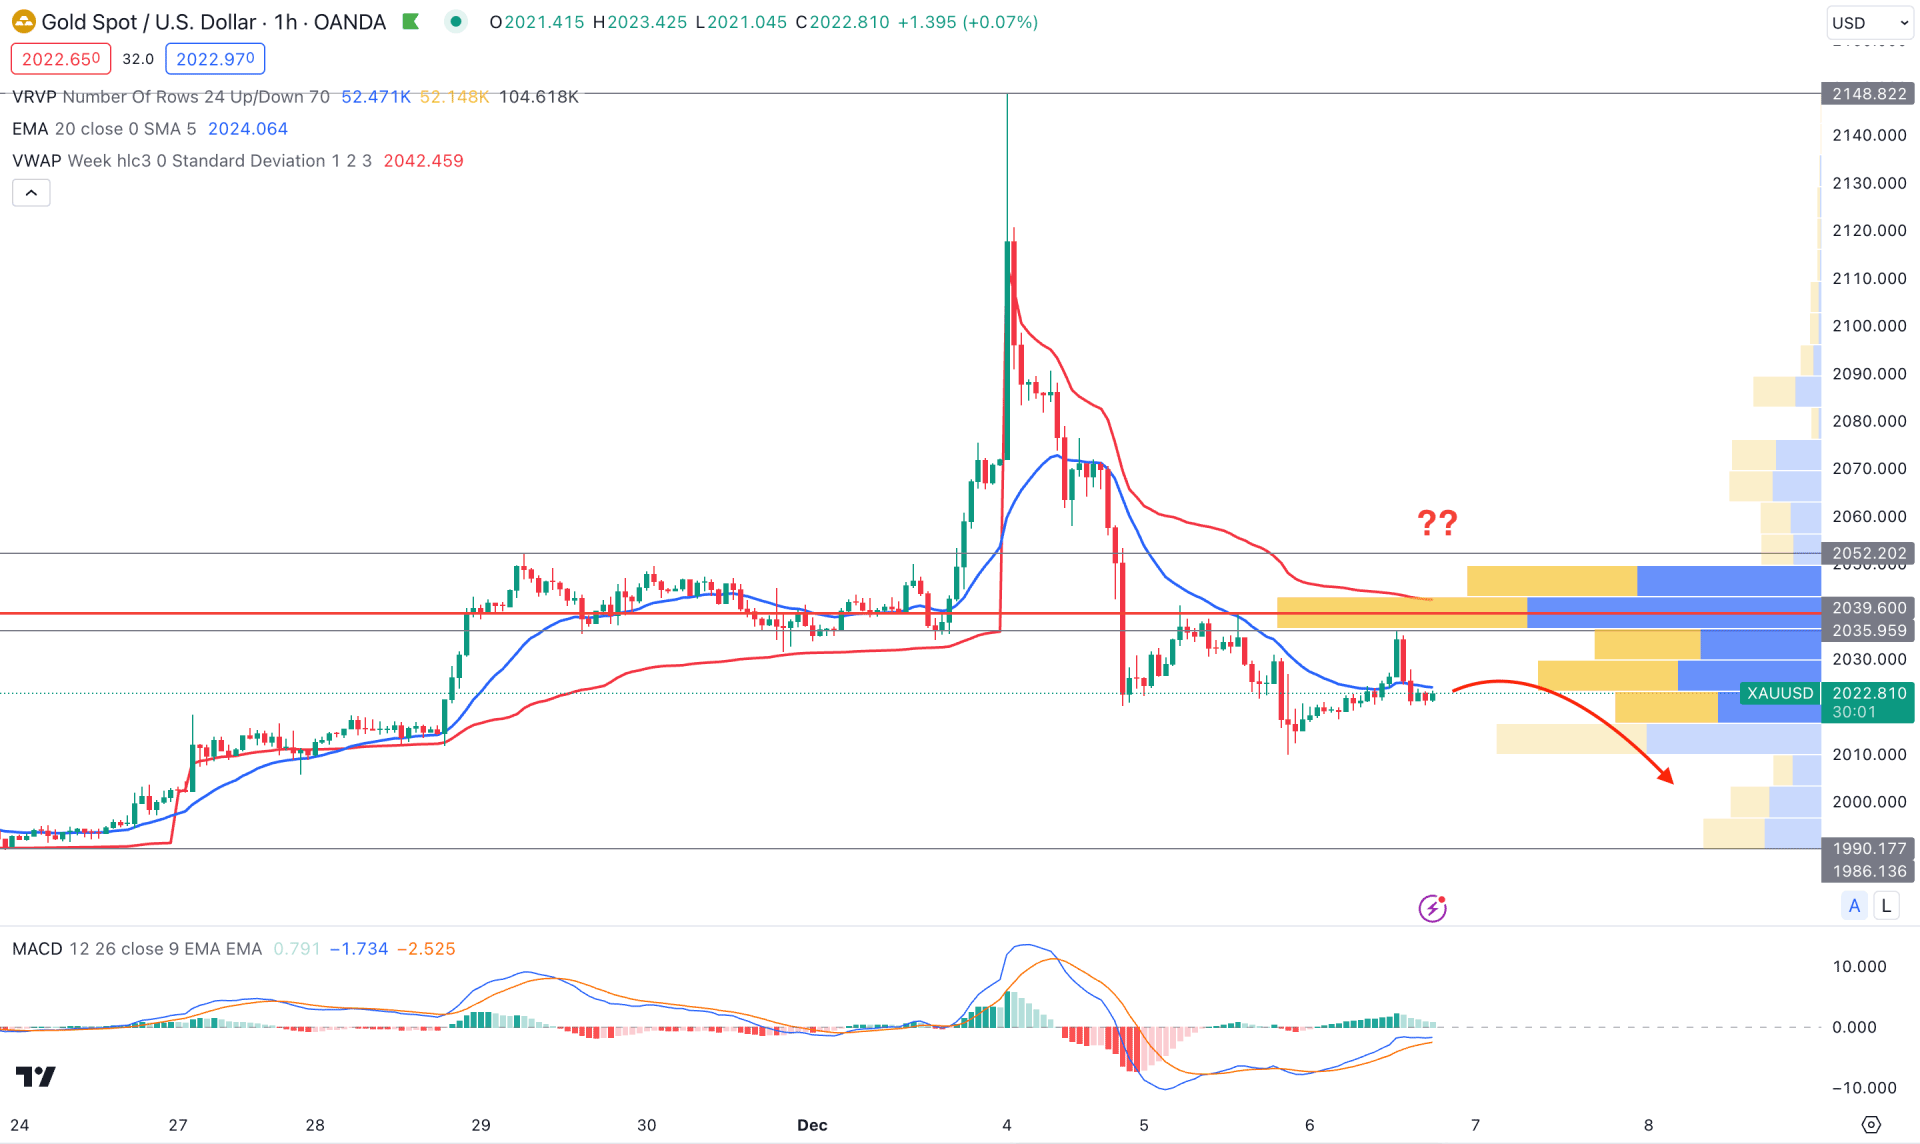
In the hourly chart, the XAUUSD bearish momentum is solid as the current price trades below the visible range high volume level. Moreover, the dynamic 20 EMA and weekly VWAP are working as resistances, which could work as a confluence selling pressure.
In the indicator window, the MACD Histogram looks sideways as it reaches the neutral level, while Signal lines are below the zero level.
Based on this outlook, the recent price stalls below the dynamic 20 EMA, suggesting a bearish continuation towards the 1990.00 level.
However, a valid long signal might come after violating the 2039.60 high volume level, which could increase the price towards the 2080.00 level.
Based on the current market outlook, bullish exhaustion at the all-time high could offer a long-term bearish opportunity. However, investors should wait for the Non-farm payroll to come, where a valid bearish weekly close would be another solid signal to go short.


