
Published: August 17th, 2023
After the downside pressure on Wednesday, the gold price is currently attempting to maintain its position near the $1,900 level. Wednesday's publication of robust macroeconomic data from the US was the main reason for the downward pressure on Gold. Investors are currently awaiting additional momentum from impending US economic indicators to assess the possibility of the US Federal Reserve (Fed) tightening monetary policy.
US Housing Starts (MoM) data for July was released on Wednesday, showing an increase to 1.452 million from the previous month's 1.398 million, exceeding expectations of 1.448 million. In addition, Monthly Industrial Production increased by 1%, exceeding expectations of 0.3% and rectifying the previous month's 0.8% decline. However, US Building Permits increased marginally in July to 1.442 million from 1.441 million, falling short of the anticipated 1.463 million.
There are concerns regarding China's weakening economic prognosis, which may impact gold's ability to maintain its value. In addition, the resilient performance of the US economy has resulted in higher yields on US Treasury bonds, which has strengthened the US Dollar (USD). This USD appreciation could exert additional downward pressure on the gold price.
Can XAUUSD begin a bullish trend from the 1900.00 level? Let’s see the upcoming price direction of Gold from the XAUUSD technical analysis:
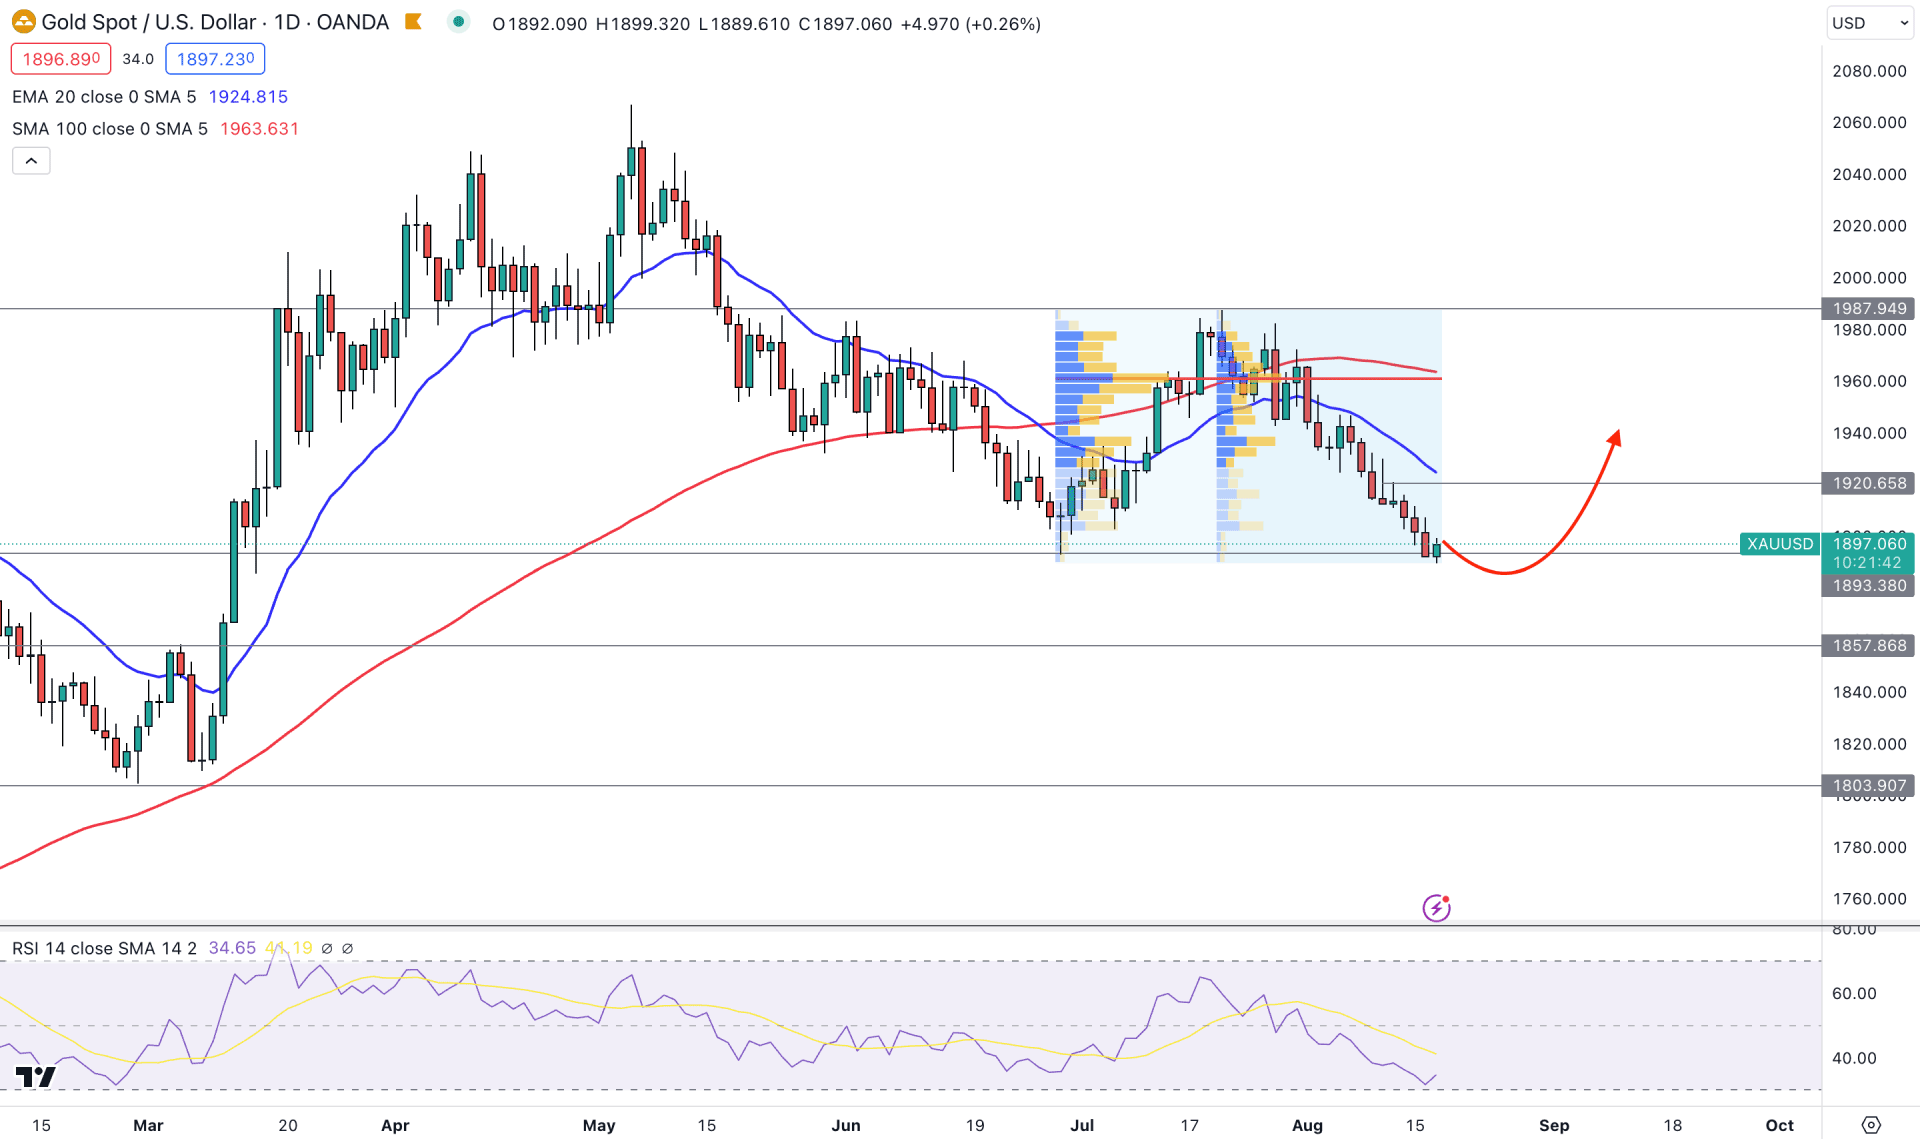
In the daily price of XAUUSD, the overall market trend is corrective as the current price consolidates at the 1900.00 psychological area. The fourth consecutive bearish week supports the downside pressure, while the current monthly candle shows an immediate reversal from the July close. As the current price is trading at a multi-week low, any bullish reversal could indicate a sell-side liquidity sweep.
In the volume structure, the downside momentum is still potent, as there has been no significant high volume zone below the price since June 2023. The latest high volume from 29 June and 20 July is at 1961.16 level, where the 100-day SMA remains as a confluence resistance. However, the current price is trading 3.3% or 626 pips down from its high volume level, which signals a pending mean reversion.
The daily chart shows that the 20-day EMA level is above the 1920.68 resistance level, while the current RSI is at 34.00. Therefore, it is a sign that the current market momentum is bearish and bulls need a solid recovery before anticipating a bullish trend.
Based on the daily market outlook, the conservative buying approach in this pair is to wait for a daily candle above the 1920.00 level. However, an immediate bullish recovery and a daily close above the 1900.00 psychological level could offer an aggressive long approach. In both cases, the primary aim for the bullish trend is to test the 1950.00 resistance level.
The alternative approach is to find a solid bearish rejection from dynamic 20 EMA in the 1910.00 to 1920.00 area, which can lower the price towards the 1857.86 support level.
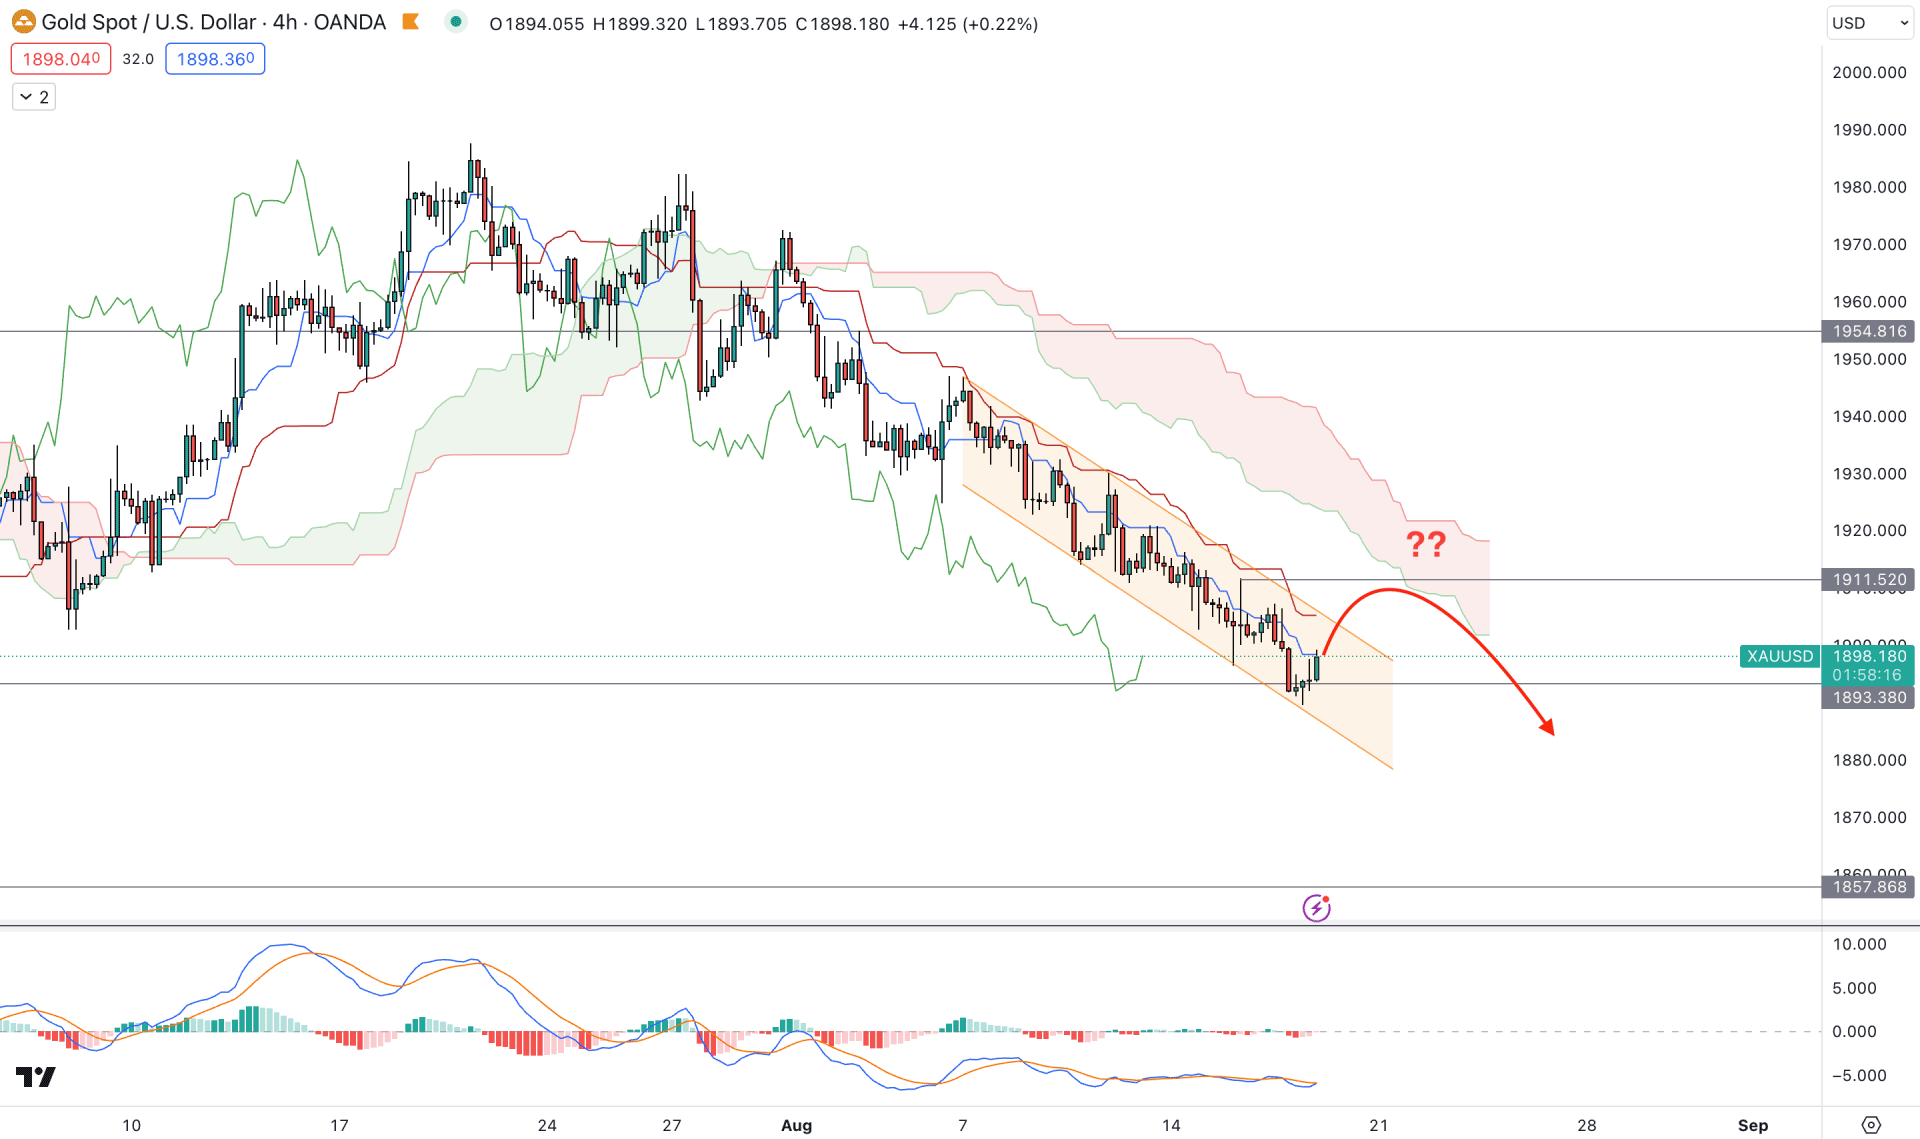
In the H4 timeframe, the overall market structure is clearly bearish as the price keeps pushing down from the dynamic Kijun Sen resistance, while the broader structure is below the Cloud resistance. In that case, the primary intention for this pair is to look for short opportunities as long as the price trades below the cloud zone.
In the indicator window, the MACD Signal lines are flat at the oversold zone, while the current Histogram is neutral. Moreover, the future cloud shows a bearish trend continuation, which needs a proper breakout before anticipating a trend change.
Based on the H4 structure, a bearish trend trading opportunity is potent in this pair, where an additional bearish rejection from the dynamic Kijun Sen could lower the price toward the 1870.00 level. On the other hand, a valid breakout and an H4 candle close above the Kumo Cloud are needed before aiming for the 1940.00 level.
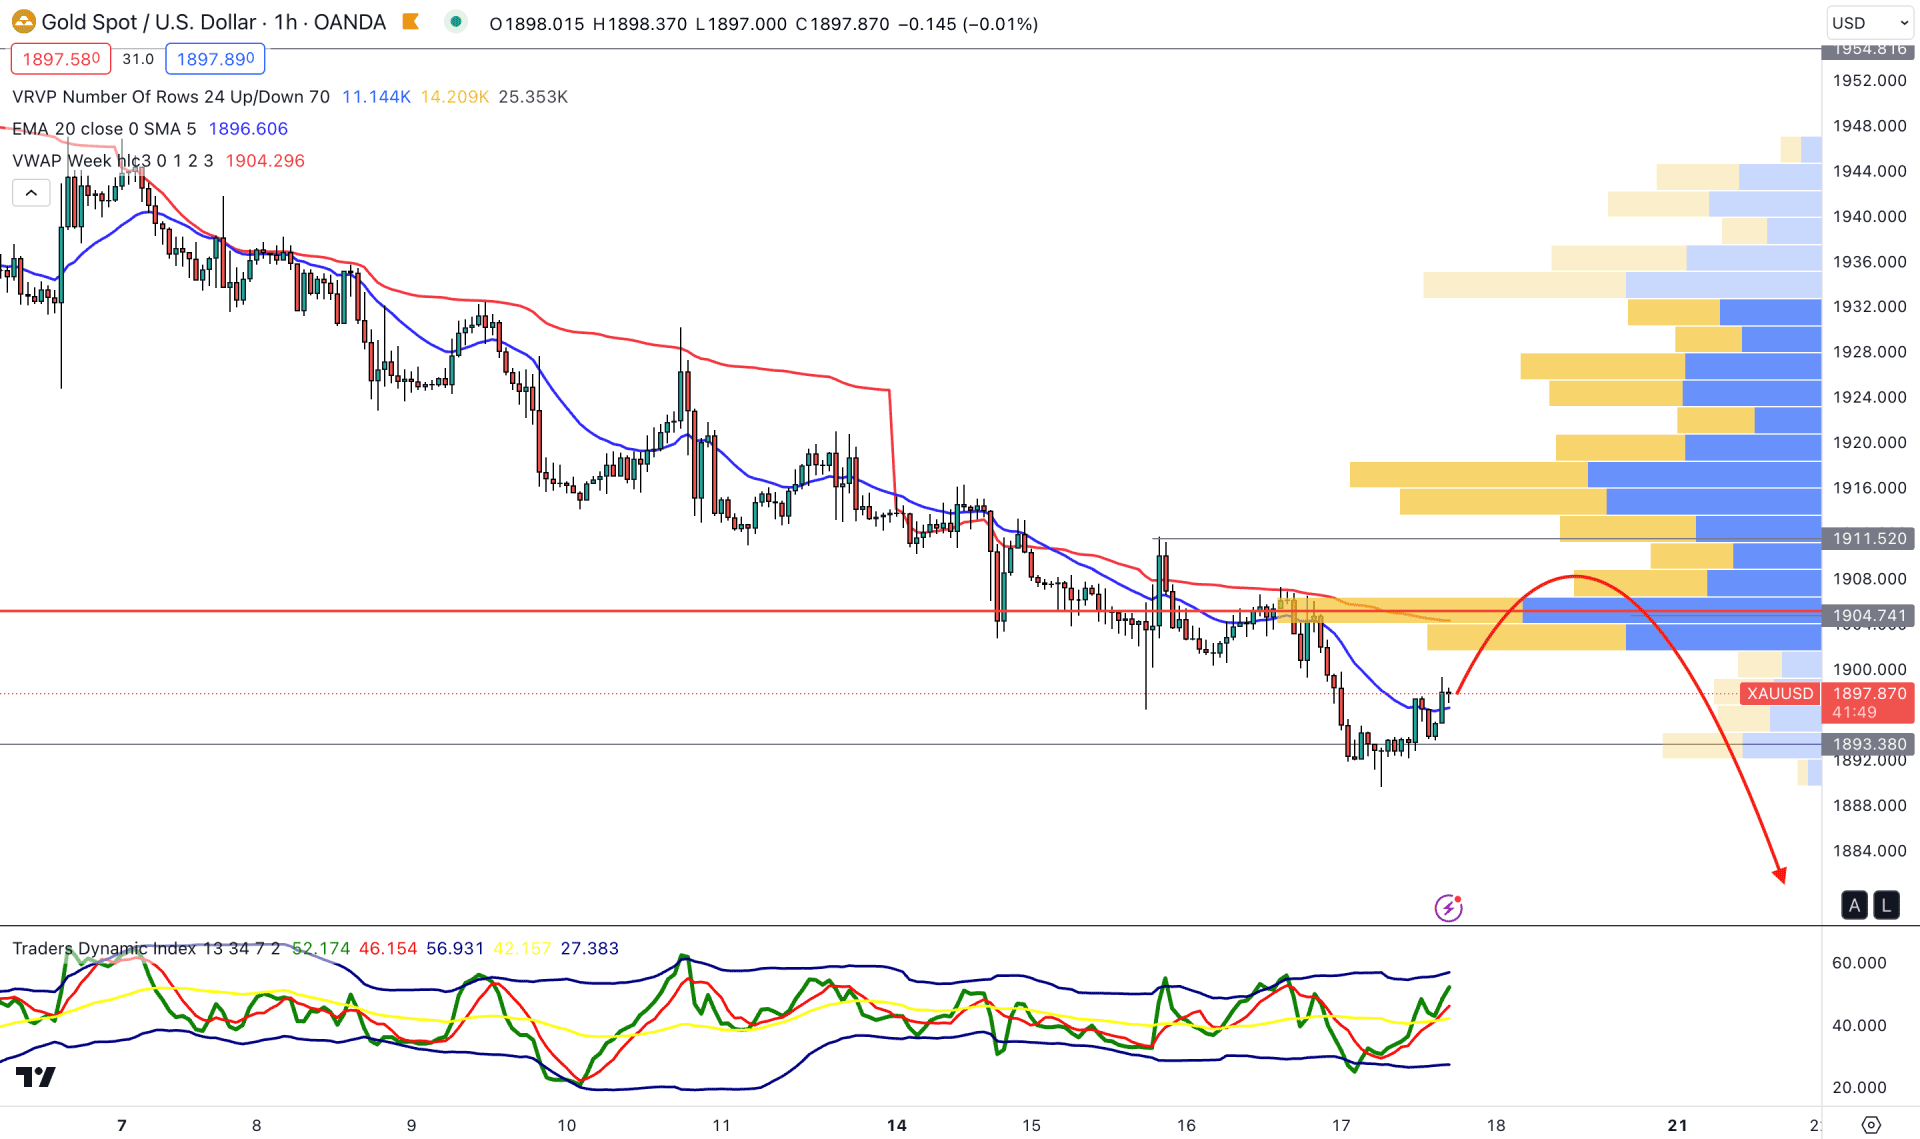
In the H1 chart of XAUUSD, the broader outlook is bearish, but the current downside pressure within a channel could be a potential long opportunity after a valid breakout.
Moreover, the current TDI level in the indicator window shows a bullish rebound where the current level is above the neutral 50.00 line.
Based on the H1 structure, the bearish trend needs a valid pullback to resume, but an H1 candle above the 1911.50 level could invalidate the bearish possibility.
Although the current daily trend is bearish, the higher timeframe’s direction is still bullish. A valid pullback with a solid rebound could remove all gains from bears and can form a stable trend at any time.


