
Published: November 17th, 2021
The benchmark 10-years US Treasury bond Yield moved below 1.5% last week and lost an additional 3% daily. After high-tiered macroeconomic releases, the US Dollar lost its momentum due to the recent inflation report. Last week, the US PPI report came without any change at 8.6% yearly in October. However, the major attention was the US annual inflation that jumped to 6.2% in October. As a result, investors have started pricing in sooner-than-expected rate hikes that pushed the US Treasury bond yield higher.
On the other hand, Gold faced a strong demand as a traditional inflation hedge that pushed the XAU/USD price to rebound from the $1830 key support level and advance to a five-month high near the $1870 area.
This week, the US Retail came with a better than expected result at a 1.7% increase from the previous report of a 0.8% increase. However, the positive US report failed to catch investors’ attention where XAU/USD price is still under solid bullish pressure.
Let’s see the upcoming price direction from the XAU/USD technical analysis:
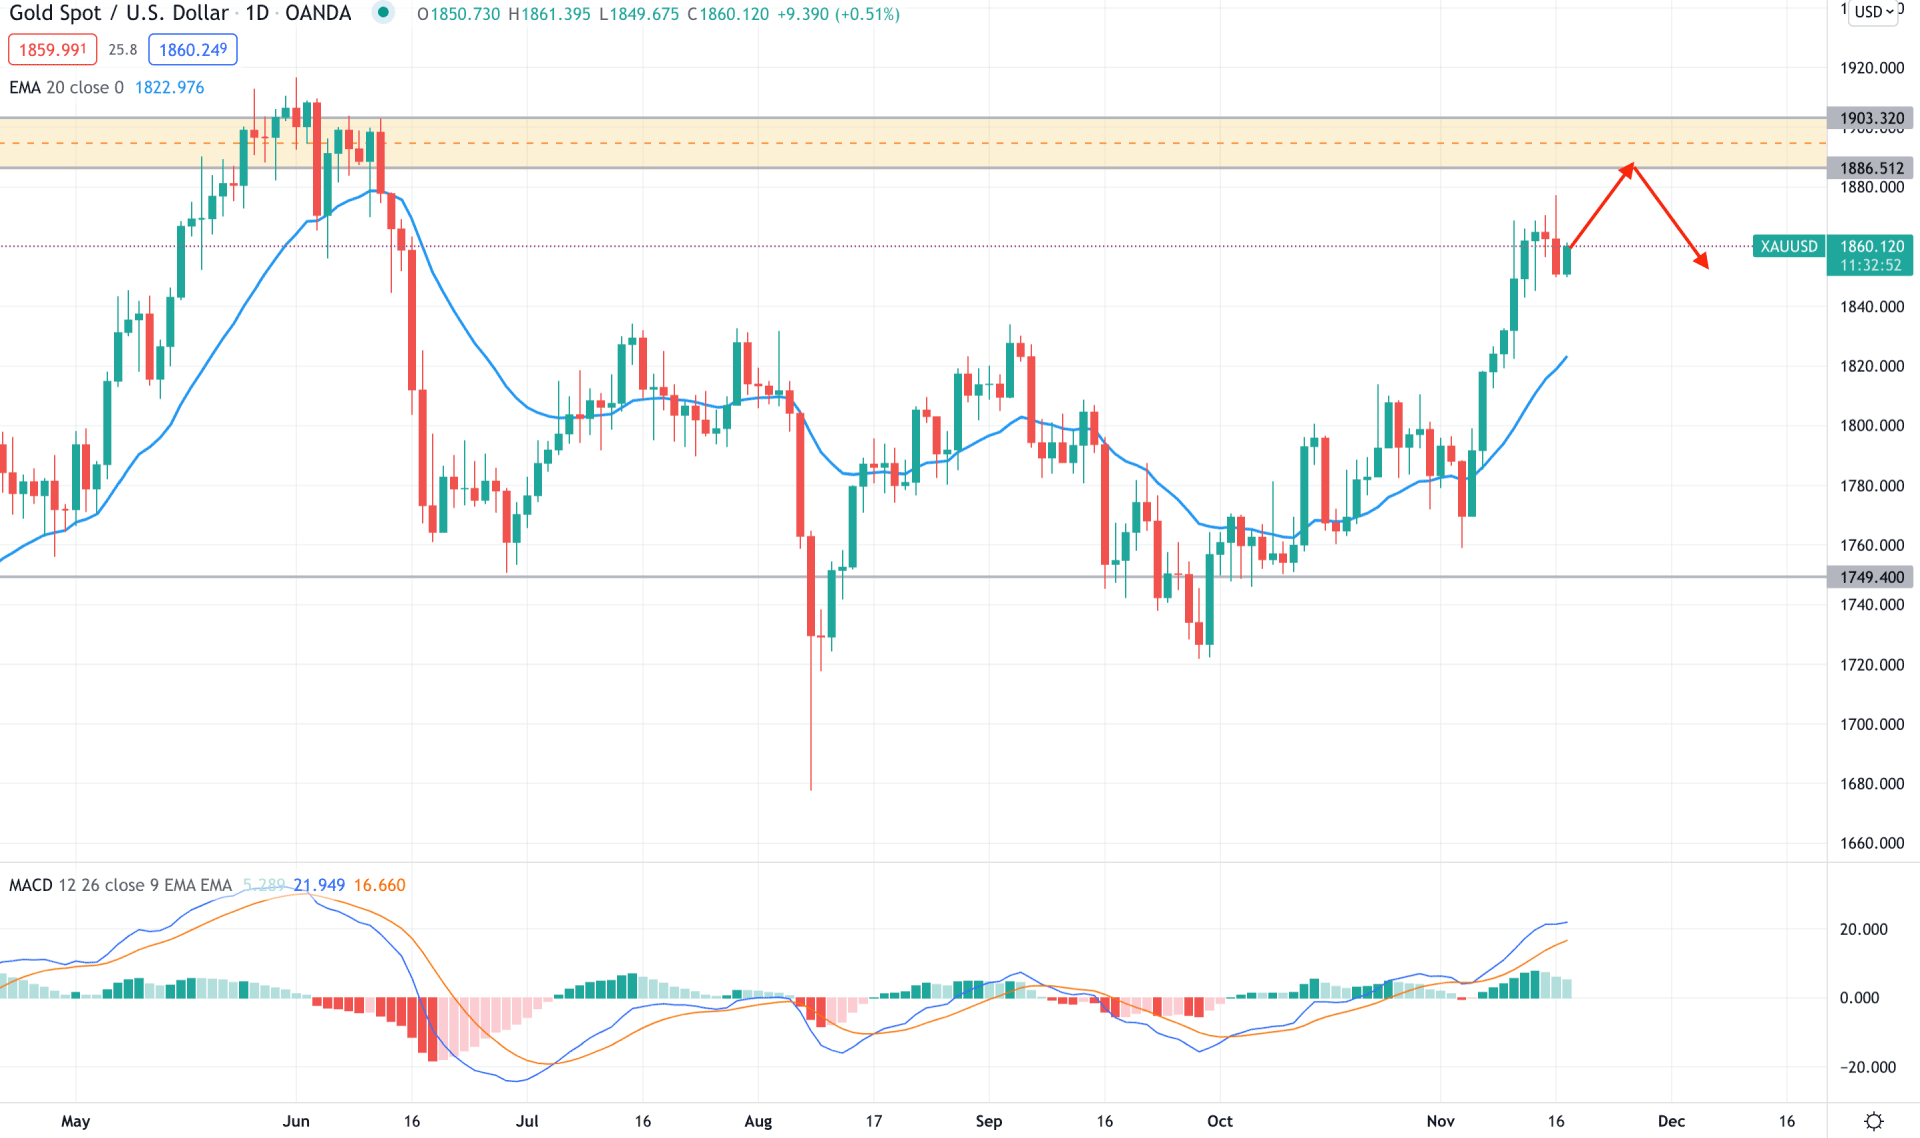
XAU/USD bulls remained aggressive as soon as the price moved above the dynamic 20 EMA with a bullish daily close. As a result, the price increased with an impulsive bullish pressure that made a decisive breakthrough above the 1835 resistance level. The bullish break of structure opened room for testing the 1900 key resistance area in the coming days.
In the daily chart, we can see the MACD Histogram remains bullish for a considerable time where the gap between the price and dynamic 20 EMA is expanded. In this context, an immediate bullish pressure towards the 1886-1903 supply zone would be a solid selling opportunity in this pair towards the target of the 1835 area. On the other hand, if the current price moves lower and rejects the dynamic 20 EMA with a bullish daily candle, we can consider the upcoming price pressure as bullish towards the target of the 1920 area.
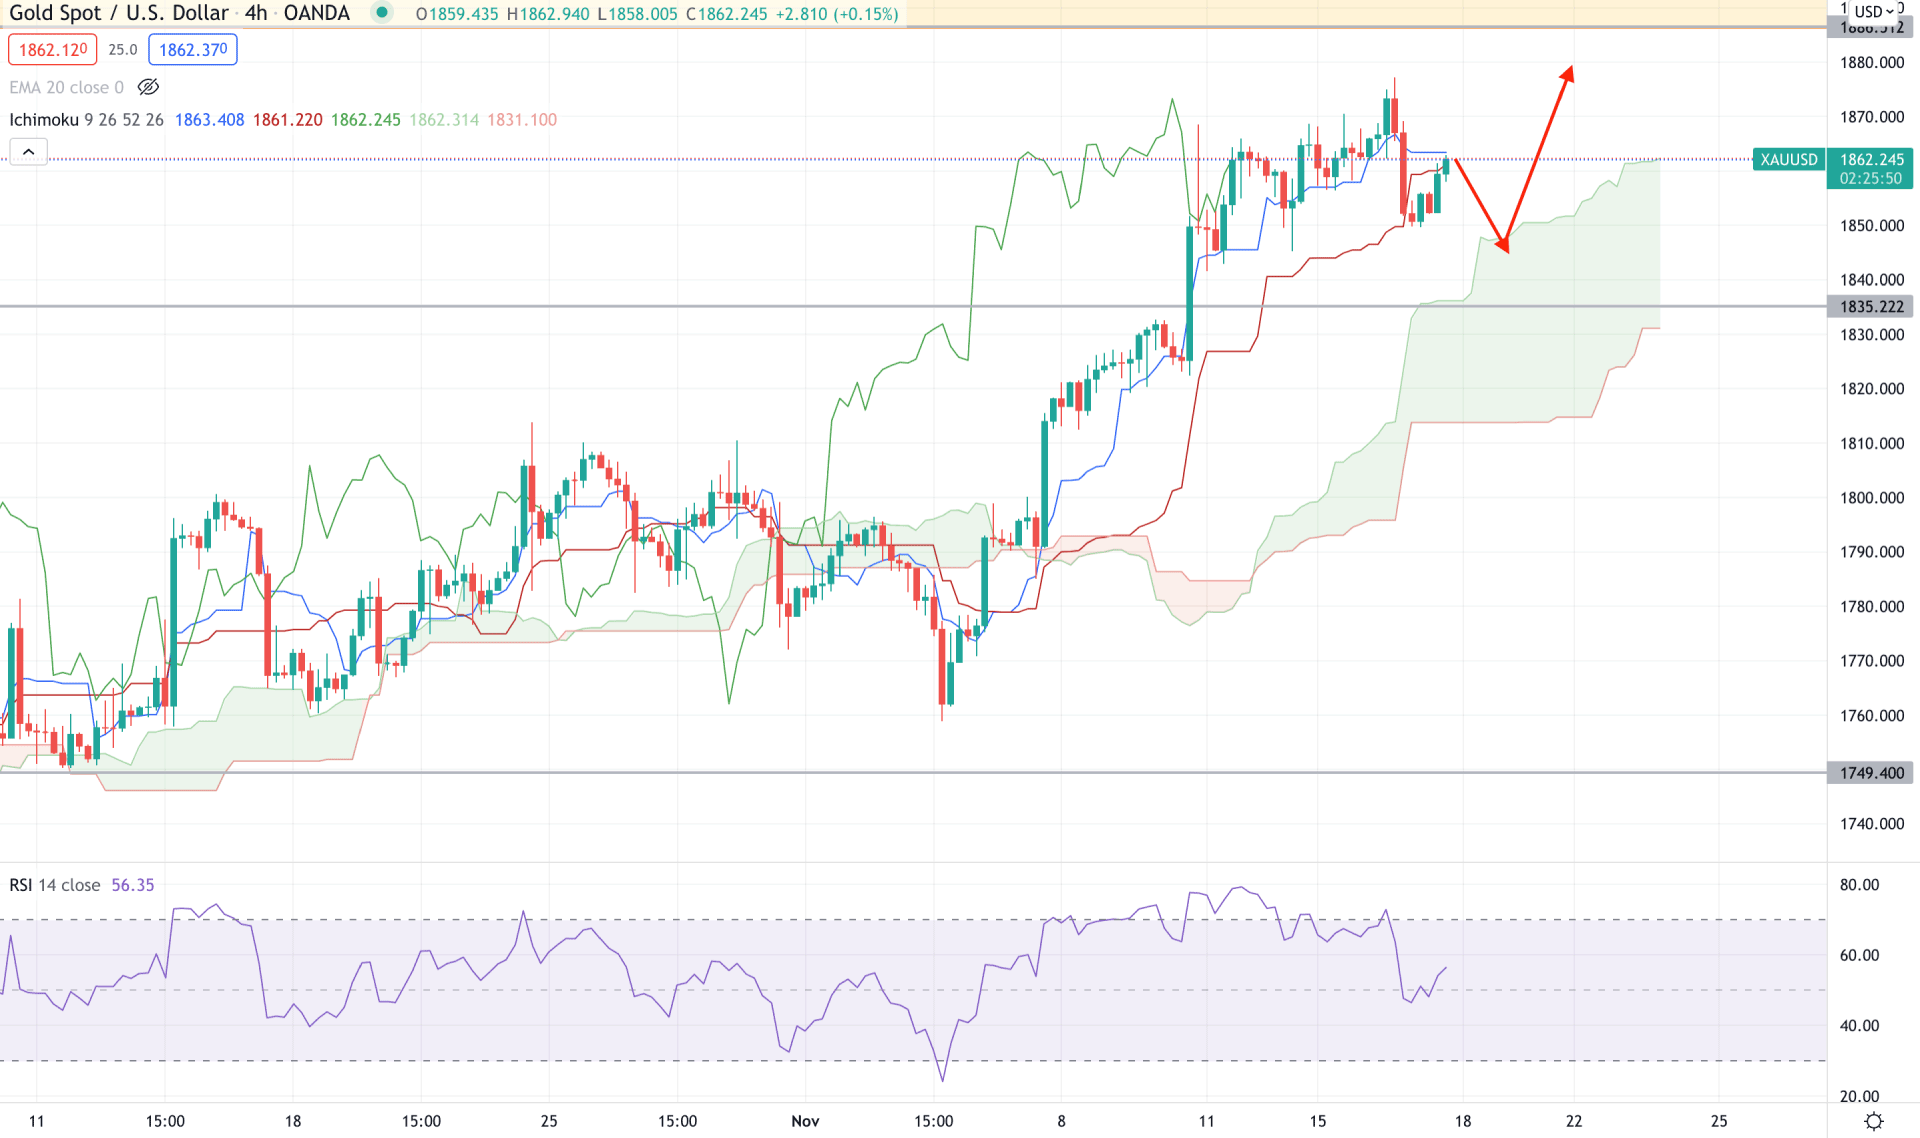
According to the Ichimoku Cloud, XAU/USD is within a strong bullish pressure where the future cloud remains bullish. The Senkou Span A is above the Senkou Span B in the future cloud, while the Chikou Span is closer to the price. Moreover, the price is above the static support level of 1835.00, which is another bullish indicator for this pair.
The above image shows that the price made a solid bearish pressure yesterday that caused bulls to remain aggressive above the dynamic Tenkan Sen. However, the bearish pressure was unable to take the price below the dynamic Kijun Sen while the RSI is still above the 50 levels.
Based on the H4 context, a bearish correction is still pending in this pair towards the Cloud support. The price is facing a minor resistance from the dynamic Kijun Sen. Any bullish rejection from cloud support may increase the price in the 1920 area. On the other hand, a break below the 1835 key support level would increase the broader correction in the price towards the 1813 level.
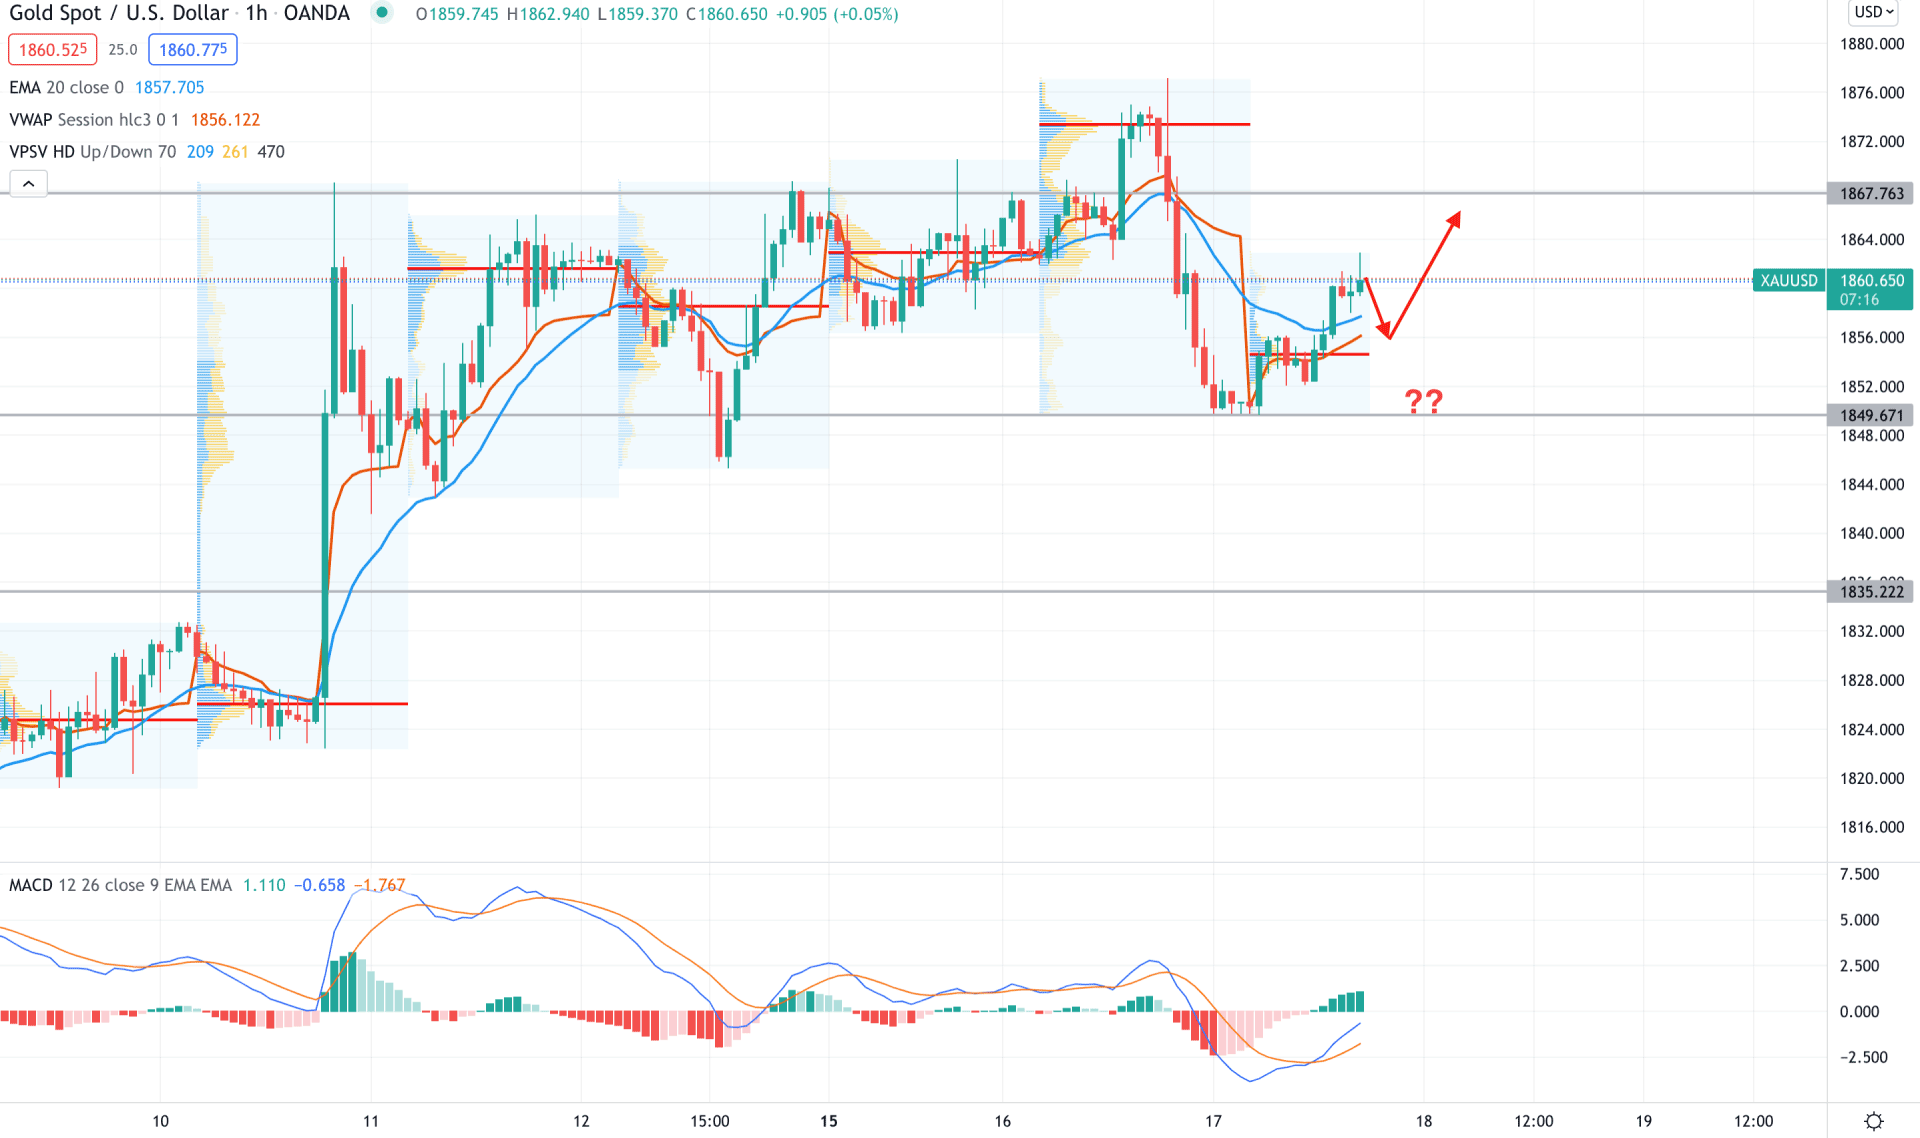
In the intraday chart, XAU/USD is trading within a corrective momentum where the price moved lower from the most recent high volume level of 1873.00 level with an impulsive bearish pressure. As a result, the intraday price moved below the dynamic 20 EMA and weekly VWAP while the long-term outlook was still bullish.
The MACD Histogram turned bullish in the indicator window as the price showed a bullish pressure from the 1849.67 intraday support level. Moreover, the most recent price rebounded higher above the dynamic level with solid support from the volume at the 1854.00 level. Therefore, based on the current context, the bullish possibility towards the 1880 level is valid as long as bulls hold the price above the 1854.00 level. On the other hand, any break below the 1849.67 level would be an alarming sign for bulls that may lower the price towards the 1835.00 area.
As per the current market condition, XAU/USD has a higher possibility of moving corrective where a buying opportunity from the 1849.00 level would be adequate. On the other hand, a break below the 1835.00 level may invalidate the bullish possibility and lower the price towards the 1813.00 level.