

Published: July 21st, 2026
Investors are optimistic about a diplomatic approach to the problem despite the ongoing military conflict involving the US and Iran. Actually, according to American Secretary of State Marco Rubio, Washington is still amenable to a diplomatic resolution with Iran. As a result, the US dollar's monetary reserve position is compromised, which is thought to be a major advantage for the commodity.
However, investors are still concerned about inflation driven by energy, which would compel the United States Federal Reserve (Fed) to maintain its hawkish posture and support the US dollar.
Based on the CME Group's FedWatch Tool, investors are pricing in roughly an 83% possibility that the Fed will increase borrowing costs before the end of this year. The forecast, in turn, reinforces the immediate optimistic USD undertone and requires prudence before initiating aggressive bullish wagers on the low-yielding Gold.
Meanwhile, the current escalation of US-Iran relations might further boost the Greenback's monetary reserve position and help restrict the precious metal. Actually, the US military successfully carried out a 10th straight night of bombings on Iran, with the White House insisting the attacks will keep going until President Donald Trump chooses otherwise.
Iran, however, claimed to have retaliated by attacking US military installations and related infrastructure around the Gulf. This increases the possibility of a more widespread regional war, which would provide the USD more support.
Let's see the complete outlook from the XAUUSD price analysis:
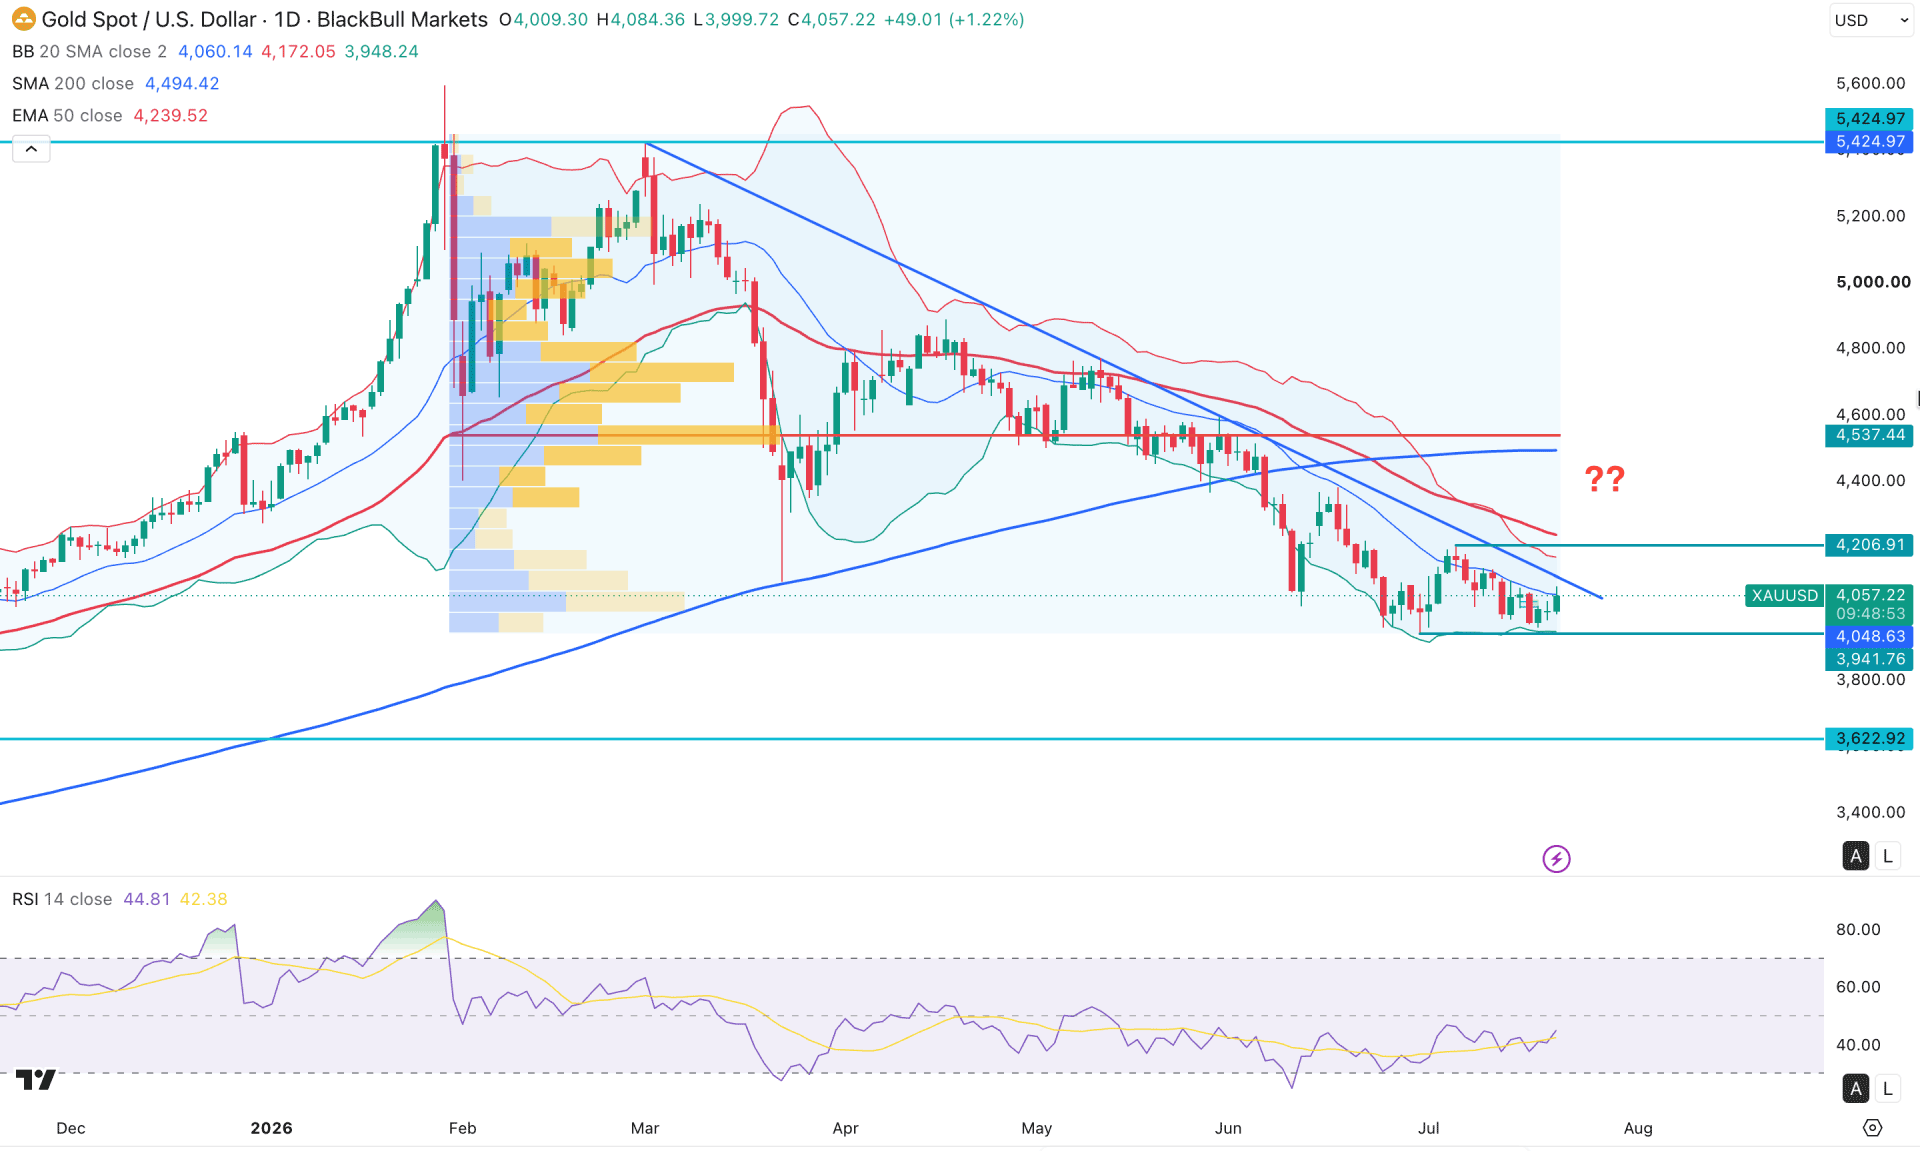
In the daily chart of XAUUSD, the recent price shows massive selling pressure from the existing all-time high level, taking the price near the yearly low area. Although the downside pressure has come with counter bearish momentum, more confirmation is needed before anticipating downward continuation.
Looking at the higher timeframe, the monthly candles suggest a free fall, as four consecutive bearish months are visible, eliminating the gains achieved during mid-2025. The current price is trading sideways within a massive bearish monthly candle, signaling further downside possibility. The lower timeframe shows collective momentum, as the price has reached a crucial bottom, but no sign of a bullish rebound is visible.
In terms of volume, the entire structure shows that the most active level since January 2026 is well above the current price. As long as the market remains below the high-volume line, the primary anticipation would be on the selling side, even if a decent or moderate bullish correction appears.
In the main price chart, the upper Bollinger Band is working as a crucial resistance with a downward slope. However, the lower band remains flat, signaling a minor barrier for sellers. A death cross formation is also visible, as the EMA is showing a downward correction after crossing below the 200-day SMA.
The Relative Strength Index shows the price strength, while the current line is having a bullish move after visiting the 30.00 oversold level.
Based on the overall market structure, XAUUSD is within corrective bearish pressure, although a considerable bullish correction is pending. The immediate crucial resistance level is located at 4206.91, which could be an important barrier. Primarily, bearish pressure remains valid as long as the price stays below this line. However, a buy-side liquidity grab from this area followed by an immediate rejection below the 50-day EMA would present a high-probability short opportunity.
On the other hand, overcoming the 4206.91 level with a bullish daily candle close would confirm a descending trendline breakout. In that case, the price might rise and test the 4537.44 resistance level.
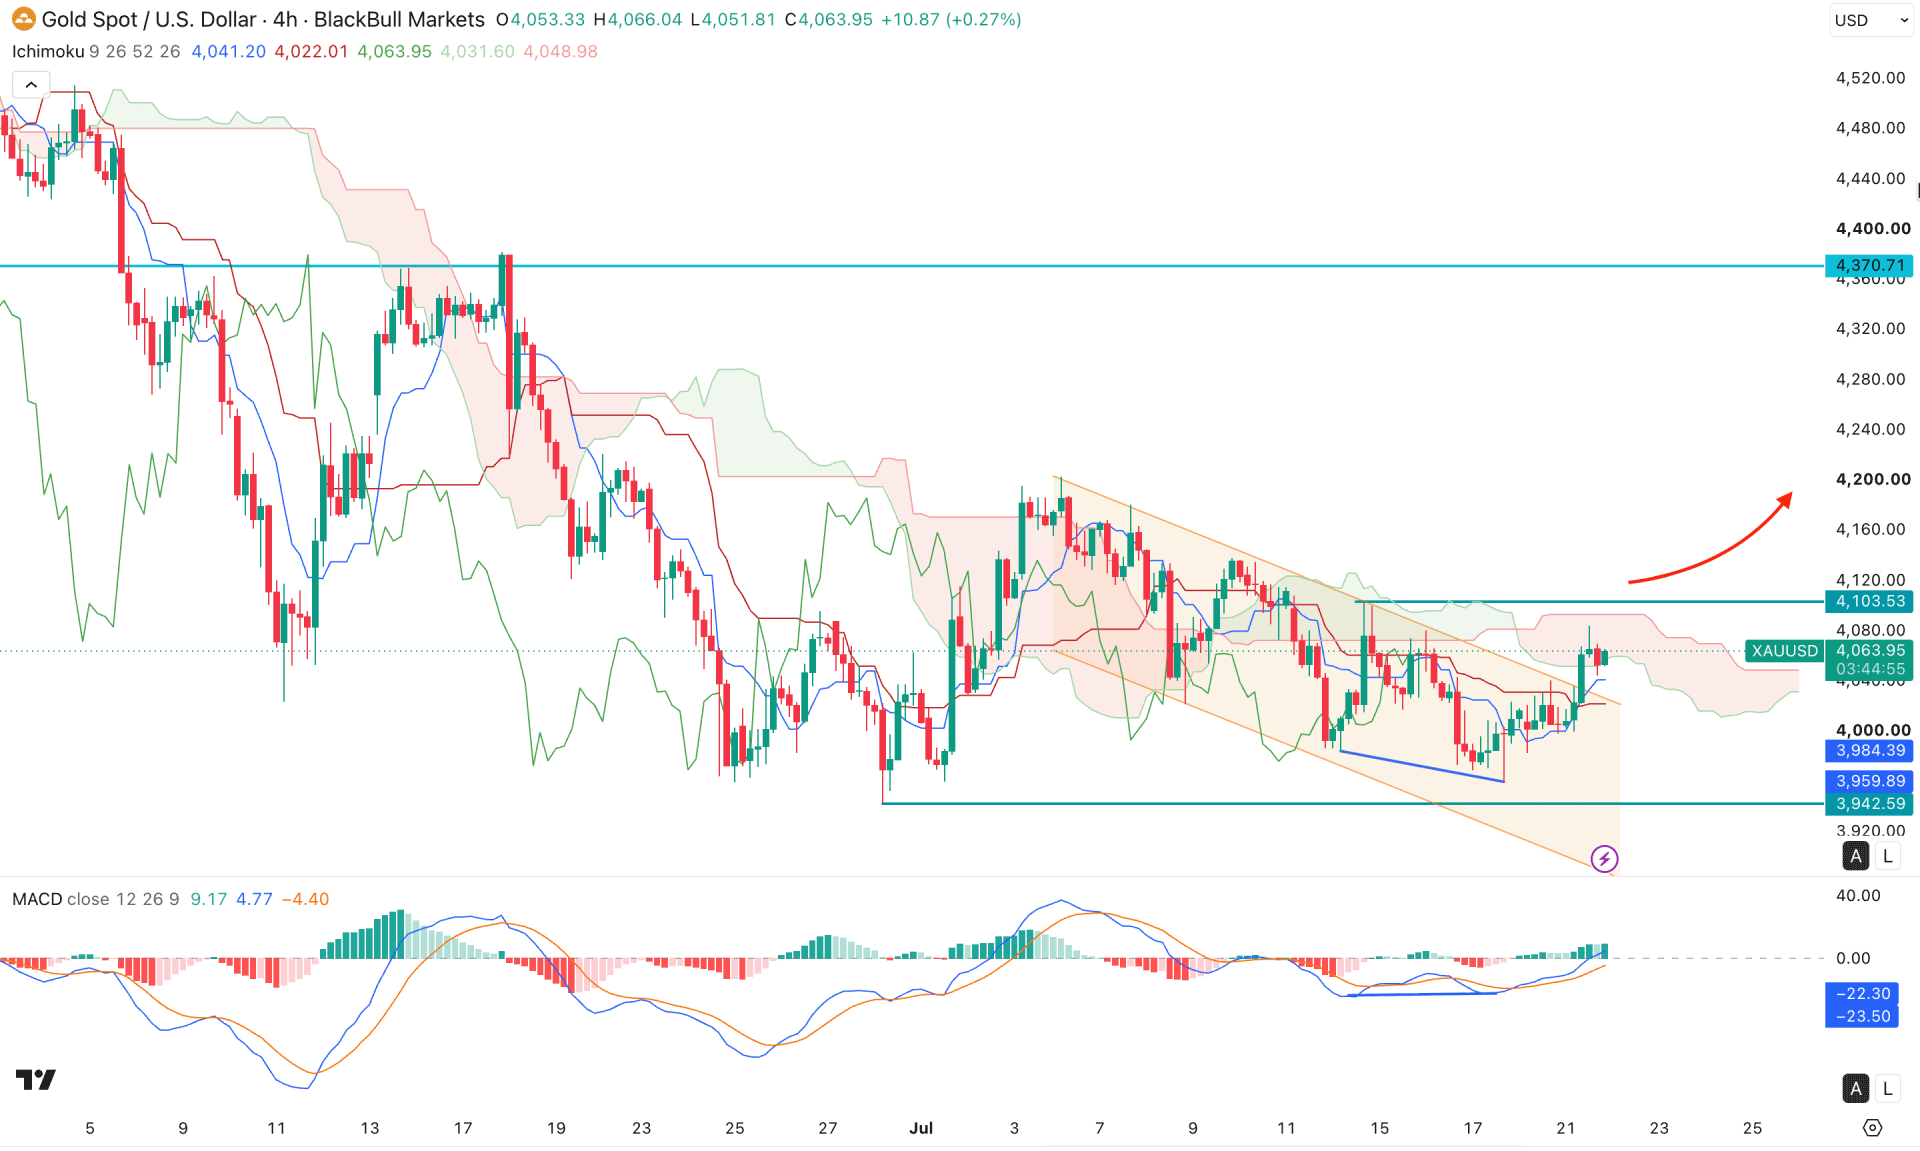
In the four-hour timeframe, the price shows corrective pressure within an impulsive bullish wave, signaling a possible bullish recovery. A descending channel breakout is visible, even though there is no significant bullish follow-through from the channel resistance.
The most recent price is still considering the Ichimoku cloud as a resistance. However, the future cloud shows bullish traction, signaling a potential recovery. An early bullish signal is present from the dynamic lines, where the Tenkan-sen is above the Kijun-sen with a bullish crossover.
In the indicator window, potential divergence is visible, with the MACD histogram maintaining positive momentum for a considerable period.
Based on the bullish structure, XAUUSD is trading within a broader range, and an early bullish reversal signal is present. As long as the price remains below the 4103.53 resistance level, recovery remains uncertain. A downside move below the key level could trigger a short opportunity targeting the 3959.89 level. A break below this level could extend losses toward the 3900.00 area.
The alternative trading approach is to wait for a break above the 4103.53 level, which could validate a new swing high formation. After a corrective move, a rebound from the dynamic support area would offer a long opportunity targeting the 4370.71 level.
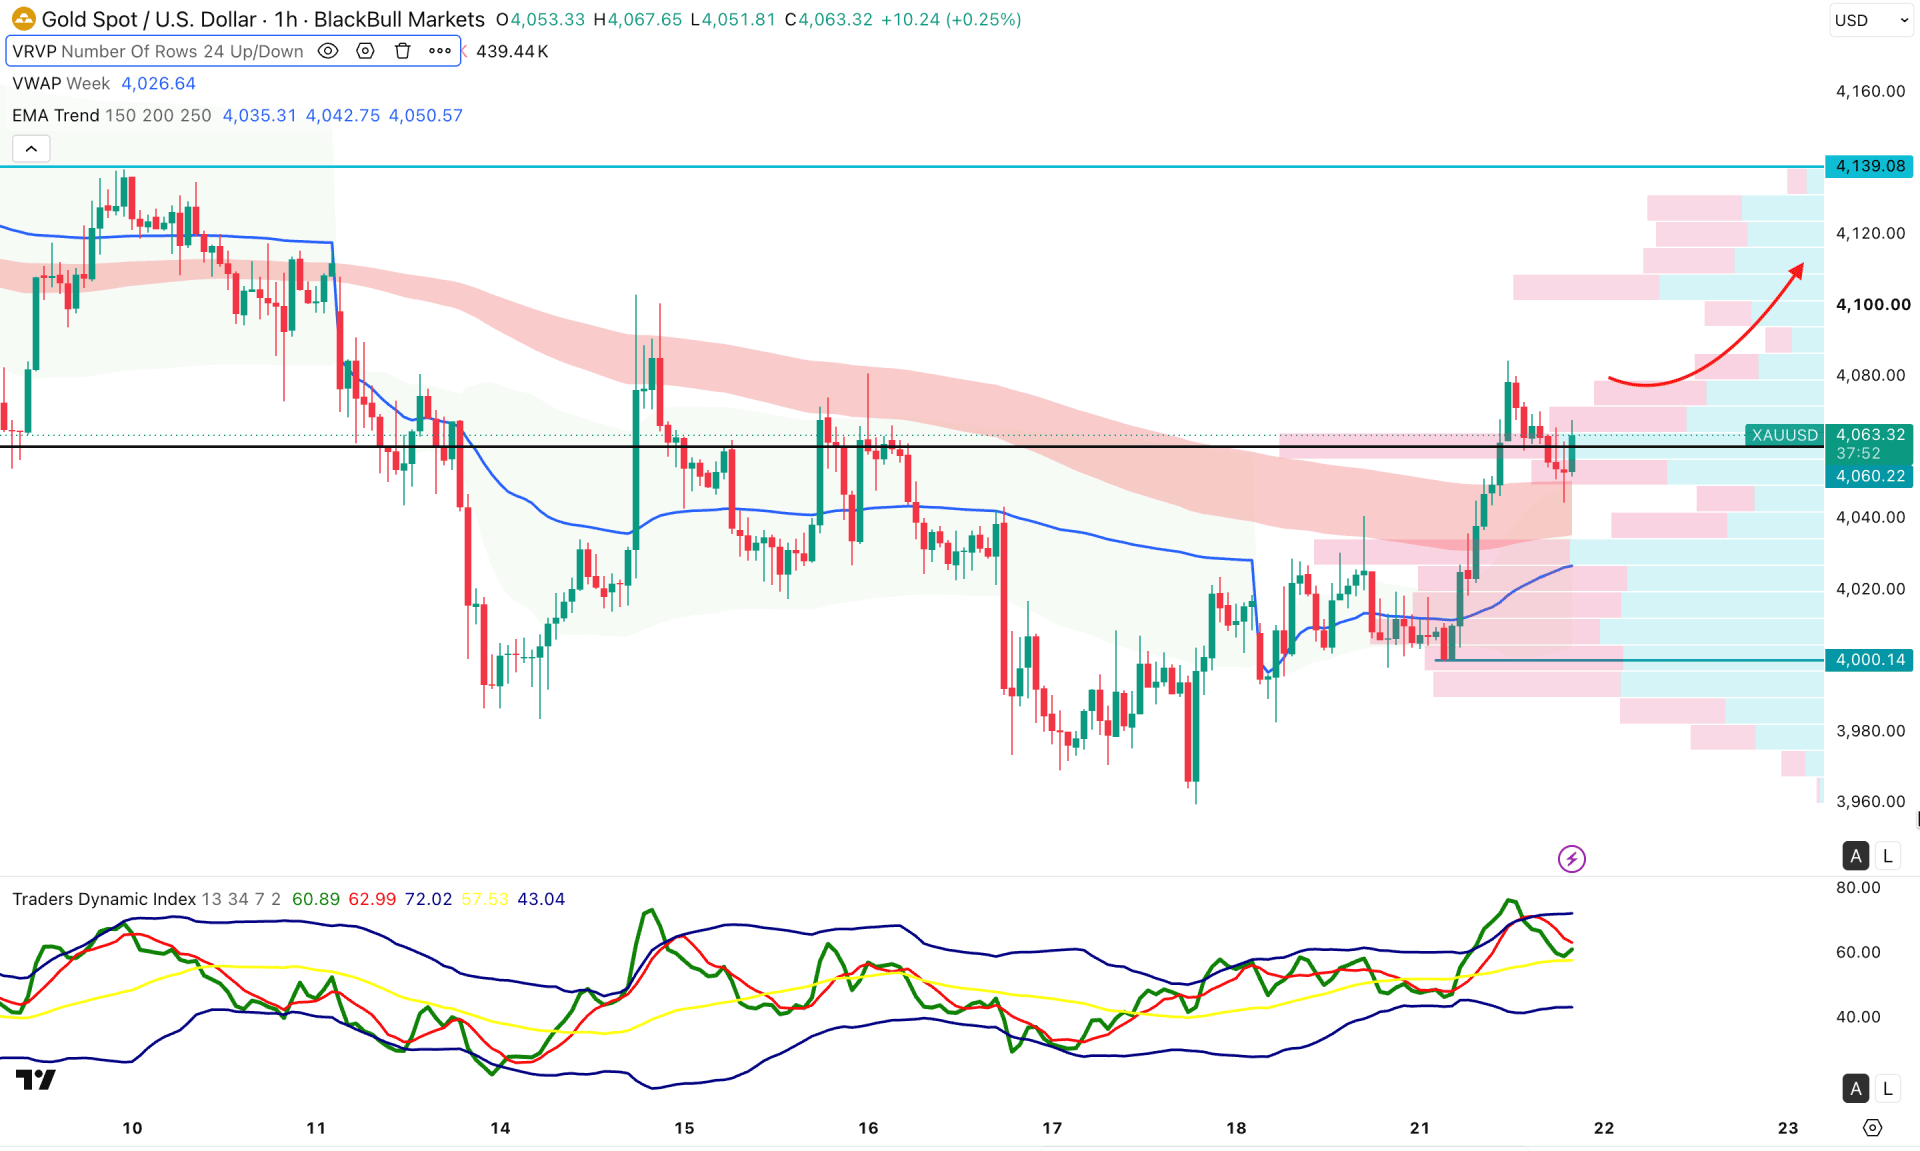
In the lower timeframe, the XAUUSD price is trading within impulsive buying pressure, where the current price is hovering near the intraday peak. The price has moved above the EMA cloud area, while the weekly VWAP level is below the current price and acting as a crucial support level. As long as these levels remain below the current price, the primary anticipation would be to look for long trades.
In the indicator window, the Traders Dynamic Index is holding above the 50.00 neutral level after reaching that zone, signaling ongoing bullish activity in the market.
Based on this outlook, minor downside pressure is visible, but as long as the price remains above the weekly VWAP line, the bullish trend may continue. The immediate resistance to watch is 4190.08, which could be tested before activating a stronger bullish move.
On the other hand, failure to hold the current price area, followed by a breakdown below the 4000.00 psychological level, could eliminate the buying scenario and extend the ongoing selling pressure.
Based on the overall market outlook, XAUUSD has moved sideways following strong selling pressure from the all-time high. This structure suggests the possibility of a bullish recovery; however, a valid price action confirmation with a reliable bottom formation is required to consider long positions.


