
Published: March 14th, 2023
With US Non-Farm Payroll (NFP) data announcing increasing unemployment and dropping wage rates, the XAUUSD price increased considerably last week.
This mixed data has caused market analysts to find a stronger position for the CPI, which came slightly below last month’s report. At the time of writing, interest rate estimates have been revised downward to a final rate of 5.283%. The discussion over whether the Federal Reserve will raise interest rates by 25 or 50 basis points is trending towards a 25 basis point hike unless next week's inflation data displays elevated pressure.
Yet, it is important to note that the banking industry is facing challenges due to the environment of high-interest rates brought about by tight monetary policy. After the recent Silicon Valley Bank (SVB) saga, the Federal Reserve may be compelled to move cautiously to avoid aggravating the fragility of certain sectors of the global financial markets.
In the meantime, the Safe Haven nature of Gold has started playing an important role in the financial market. The recent upside rally, backed by a strong bullish trend, is a primary sign that bulls are in control, but more confirmation is needed before taking a trading decision.
Let’s see the upcoming price direction from the XAUUSD technical analysis:
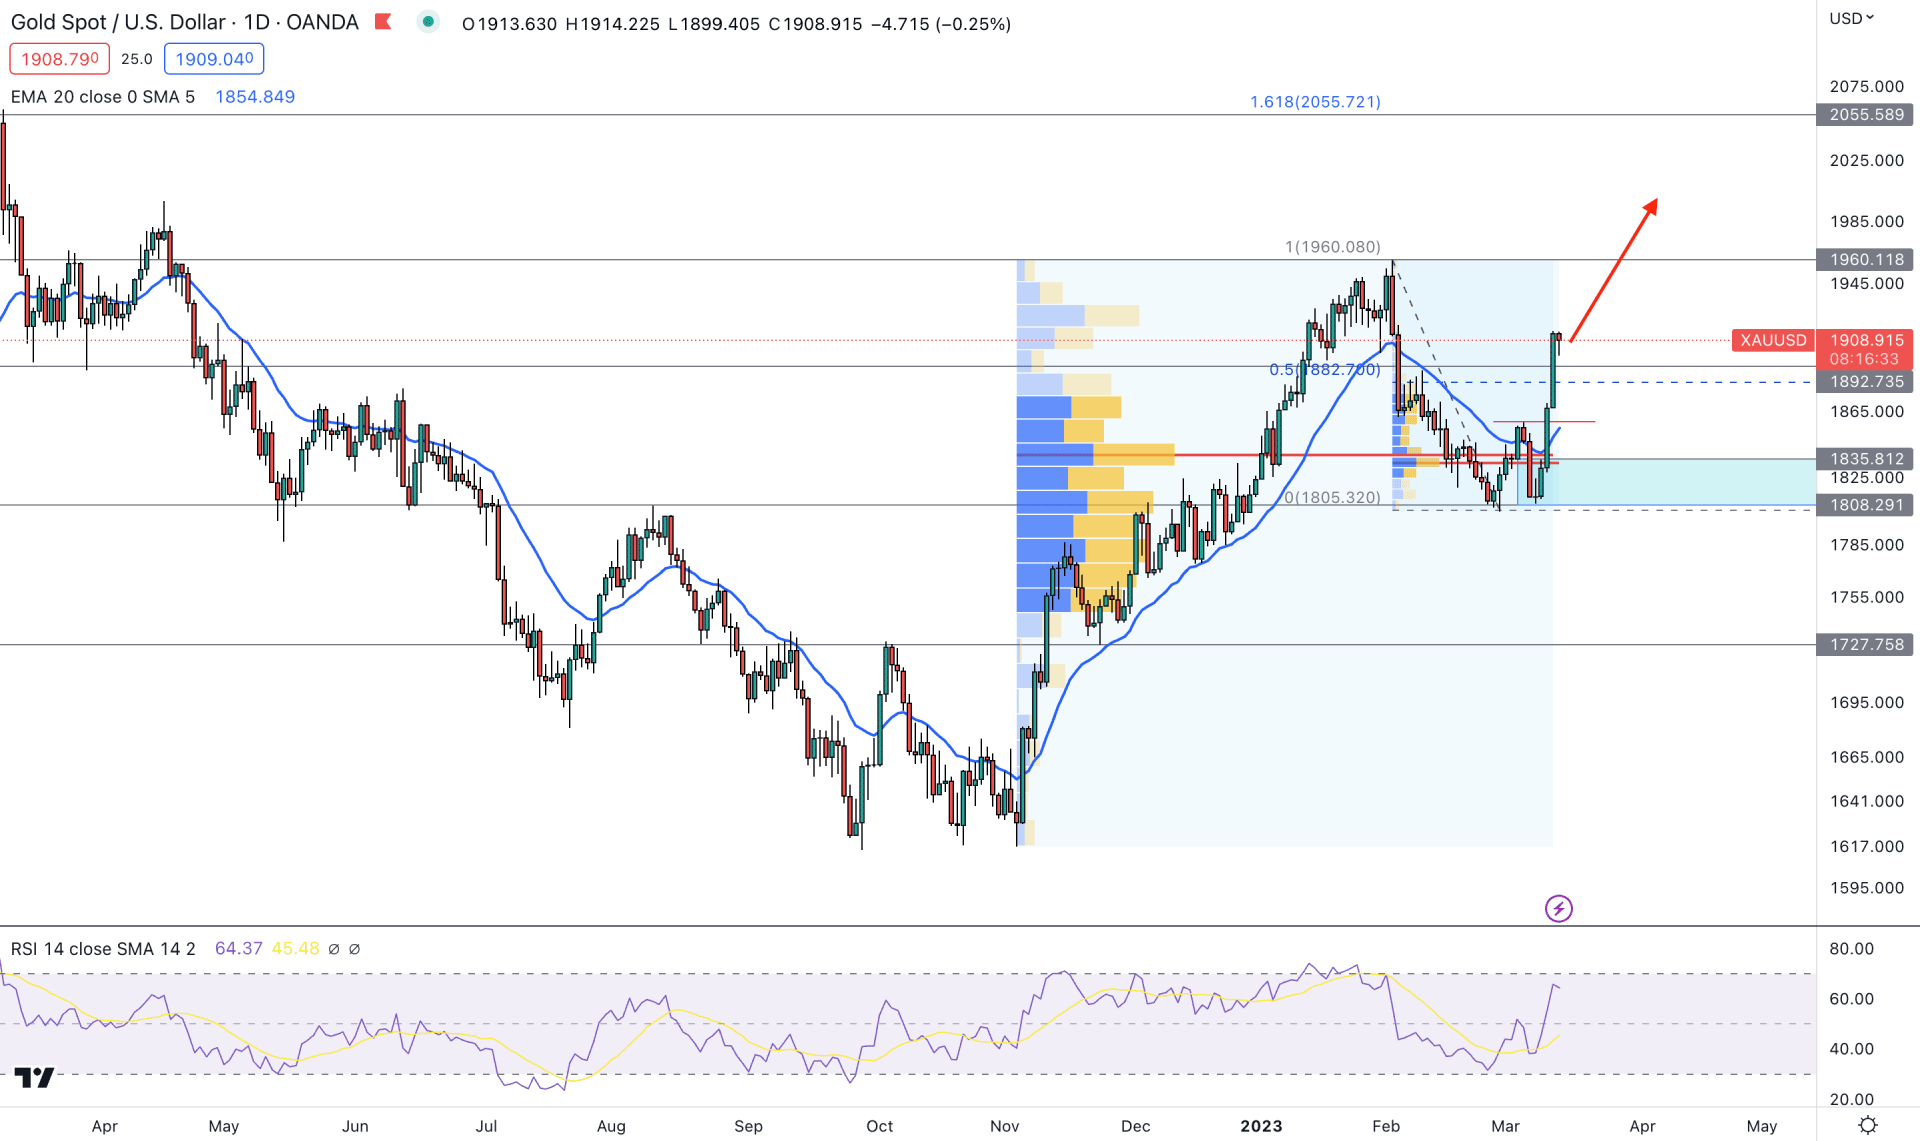
In the weekly timeframe, the overall market structure is strongly bullish, where a bullish trend continuation is visible from the 108.29 level with a bullish engulfing candlestick formation. The clear bullish bias is also visible from the daily price as the price aimed higher from a solid bottom.
After making a low at the 1616.44 level, the bull run was initiated in the XAUUSD daily chart. Moreover, the buying pressure has a strong interest by institutions as the latest high volume levels are below the current price.
The highest trading volume level since 31 October 2022 is at 1837.18 level, which is 700 pips below the current price. Another high volume level since 30 January 2023 is also below the current price at the 1833.40 level. As both lines are below the current price, any upside possibility in the intraday chart could provide a high probable buying opportunity.
In the main chart, the dynamic 20-day Exponential Moving Average is below the price, working as an immediate support level. Moreover, a bullish structure breaks at the 1858.04 level with a daily candle close, opening the upside possibility solid.
Based on the current daily outlook, strong buying pressure may come in this pair where the primary target is the 2055.58 level, which is 161.8% Fibonacci Extension level from the February high to the March low.
On the other hand, bearish correction is possible towards the 1835.81 to 1808.29 demand zone, but breaking below the 1808.00 level could lower the price towards the 1780.00 area.
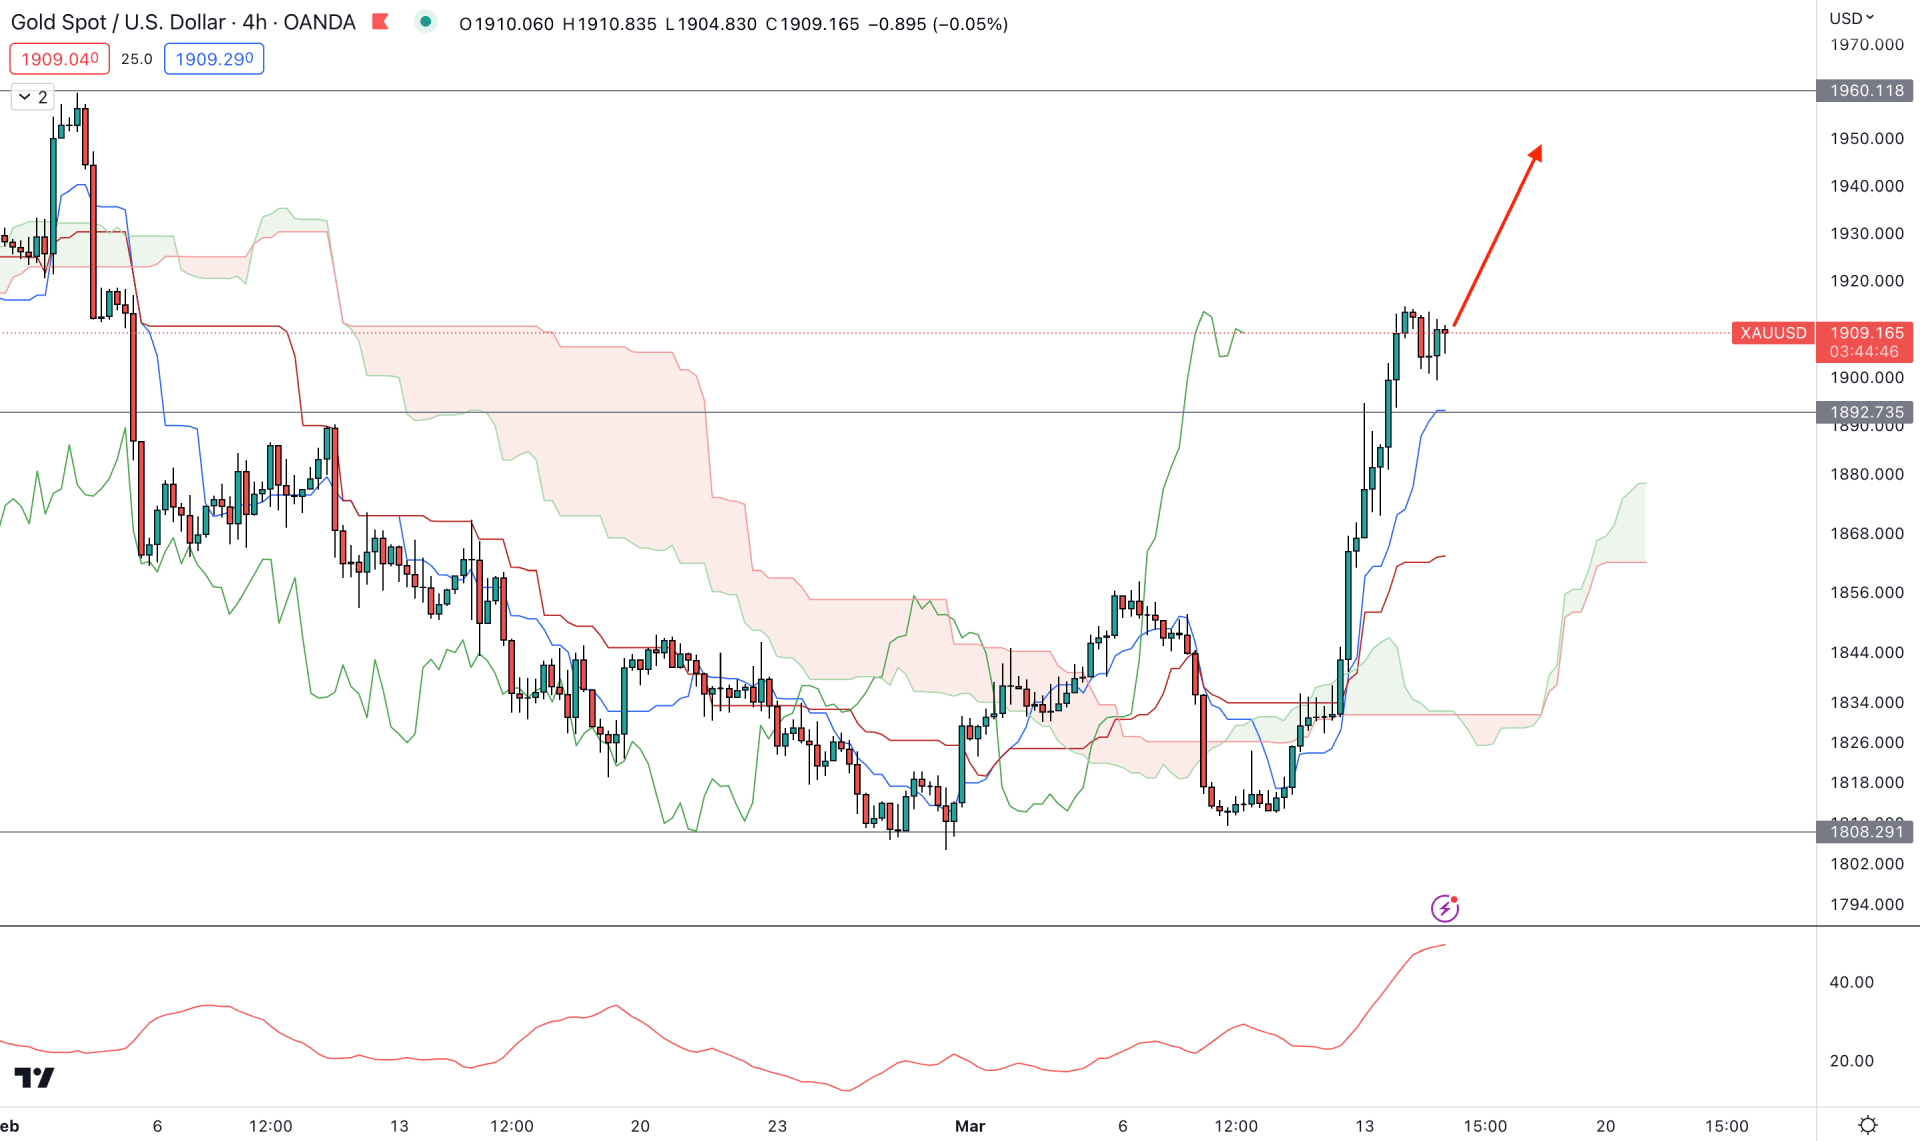
In the H4 chart, the broader market outlook is bullish as the current price is above the Kumo Cloud for a considerable time.
Moreover, the future cloud is bullish, where the Senkou Span A moved above the Senkou Span B with a strong gap. The indicator window also shows a bullish trend trading opportunity, where the current ADX level is stable above the satisfactory 20.00 level.
Based on this structure, a minor correction is possible, but a bullish rejection from the dynamic Tenkan Sen could provide the first buying opportunity. In that case, the primary aim is to test the 1960.00 near-term resistance level.
On the other hand, breaking below the Tenkan Sen support could lower the price towards the 1861.00 cloud support in the coming days.
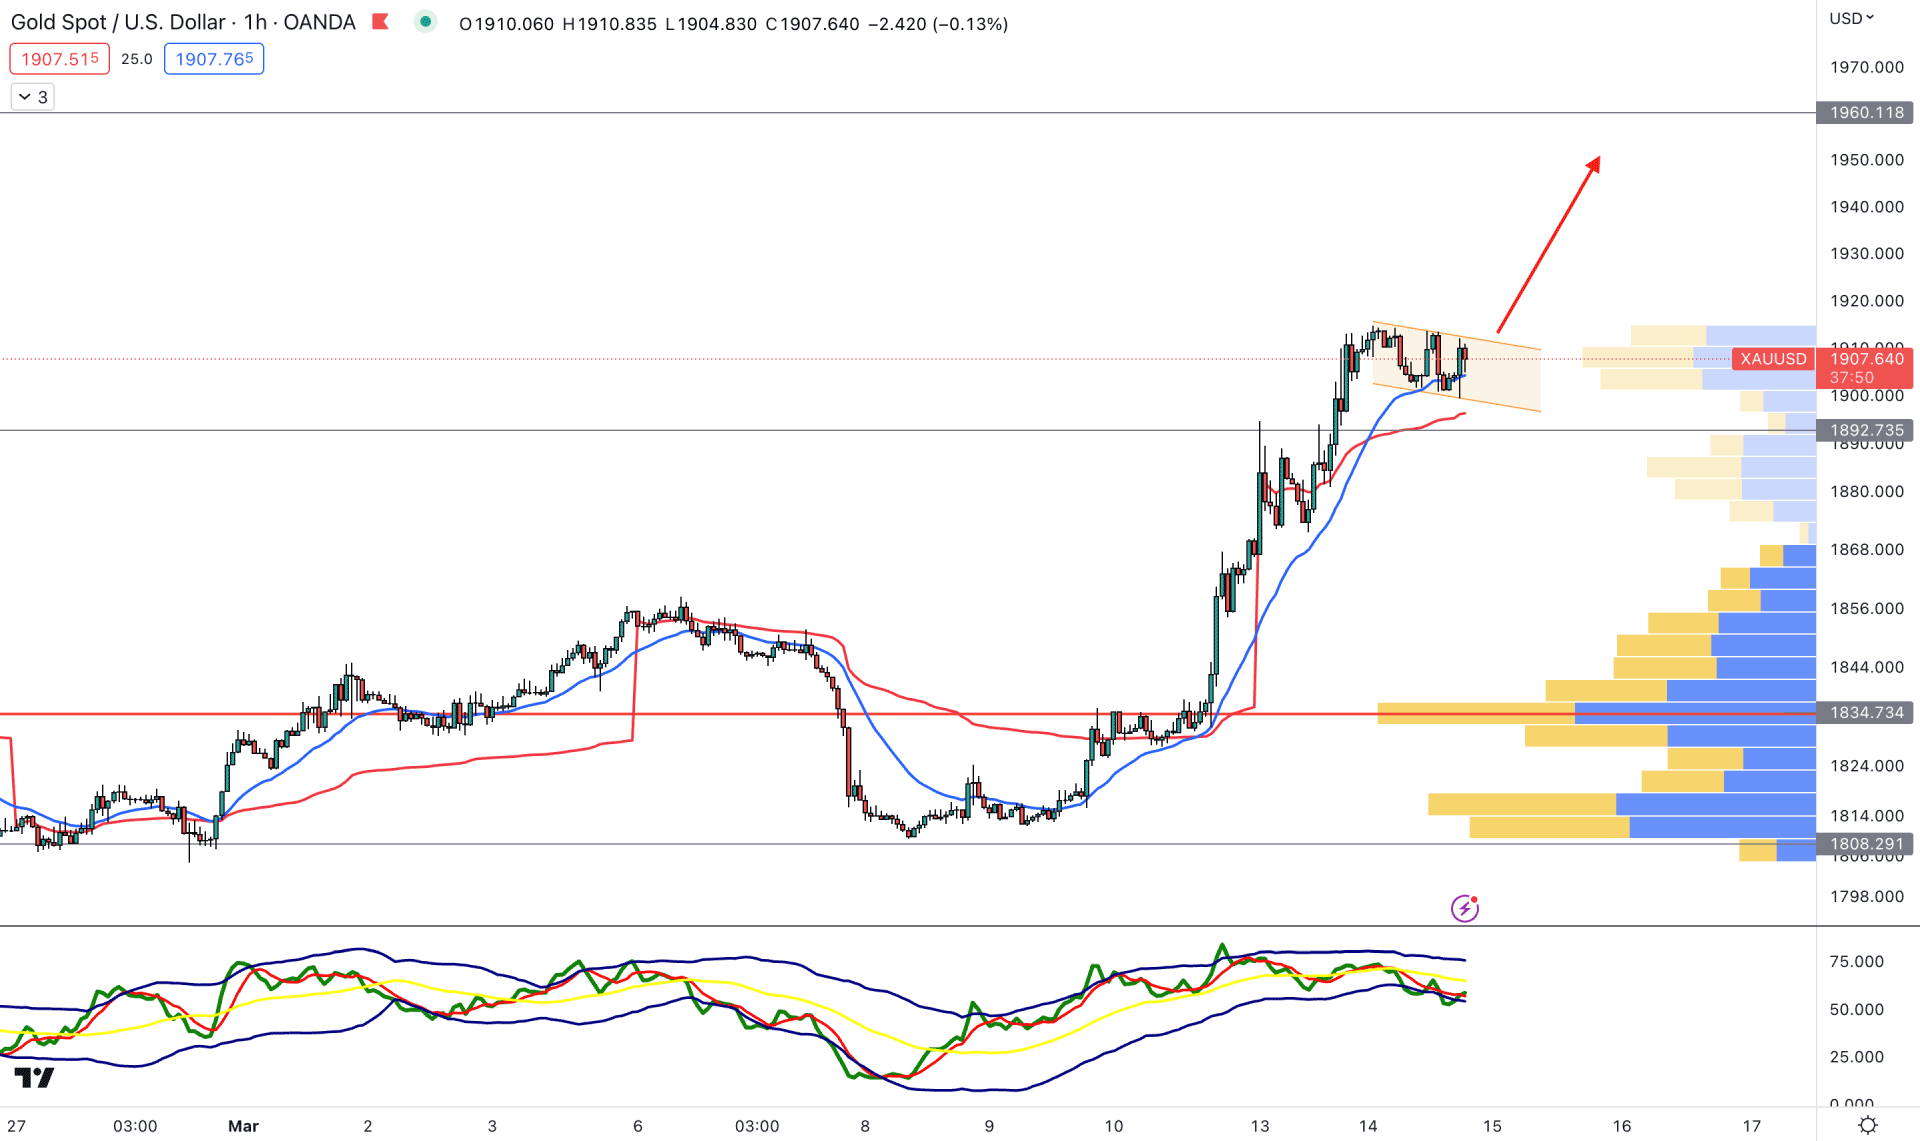
In the H1 timeframe, the XAUUSD is trading sideways after a strong bullish leg where a descending channel formation is seen at the 20 EMA support. Moreover, the dynamic weekly VWAP is below the 20 EMA and working as an additional push to bulls.
The visible range high volume level is below the current price, which is signaling that bulls are active in the market. Moreover, the Traders Dynamic Index (TDI) has rebounded from the lower band and reached the 50% area.
Based on the current price outlook, the buying possibility is potent after a valid channel breakout. On the other hand, breaking below the dynamic VWAP support could lower the price towards the 1834.00 high volume area.
Based on the current market structure, XAUUSD has a higher possibility of extending the current bullish pressure. However, a minor downside correction is still pending where any intraday buying pressure from a reliable support level could offer an early buying opportunity.


