
Published: June 15th, 2023
The Federal Reserve held the target range for the federal funds rate steady at 5.0% to 5.25% on Wednesday. However, the central bank's "dot plot" forecast shows the median projection of individual Fed policymakers for future interest rates. According to the report, the committee expects to hike rates twice more by the end of the year, up from 5.6%.
In a press conference, Fed Chair Jerome Powell said that the central bank is "not done yet" raising rates. He also said that the Fed is "prepared to adjust" monetary policy if necessary to achieve its goals of maximum employment and price stability.
The Fed's decision will likely have a mixed impact on the economy. On the one hand, it will provide some relief to businesses and consumers who are facing higher borrowing costs. On the other hand, it could slow the pace of economic growth. The Fed must carefully balance these two objectives to determine the pace of future rate hikes.
The hawkish Fed pushed a bullish impact to the US Dollar index and the stock market, but the XAUUSD faced some pressure.
Let’s see the upcoming price direction of Gold from the XAUUSD technical analysis:
Currently, XAUUSD is trading below May 2023 low with a drop base drop formation on the weekly timeframe. Although the macro outlook is bullish, more downward pressure is pending in this pair from the technical perspective.
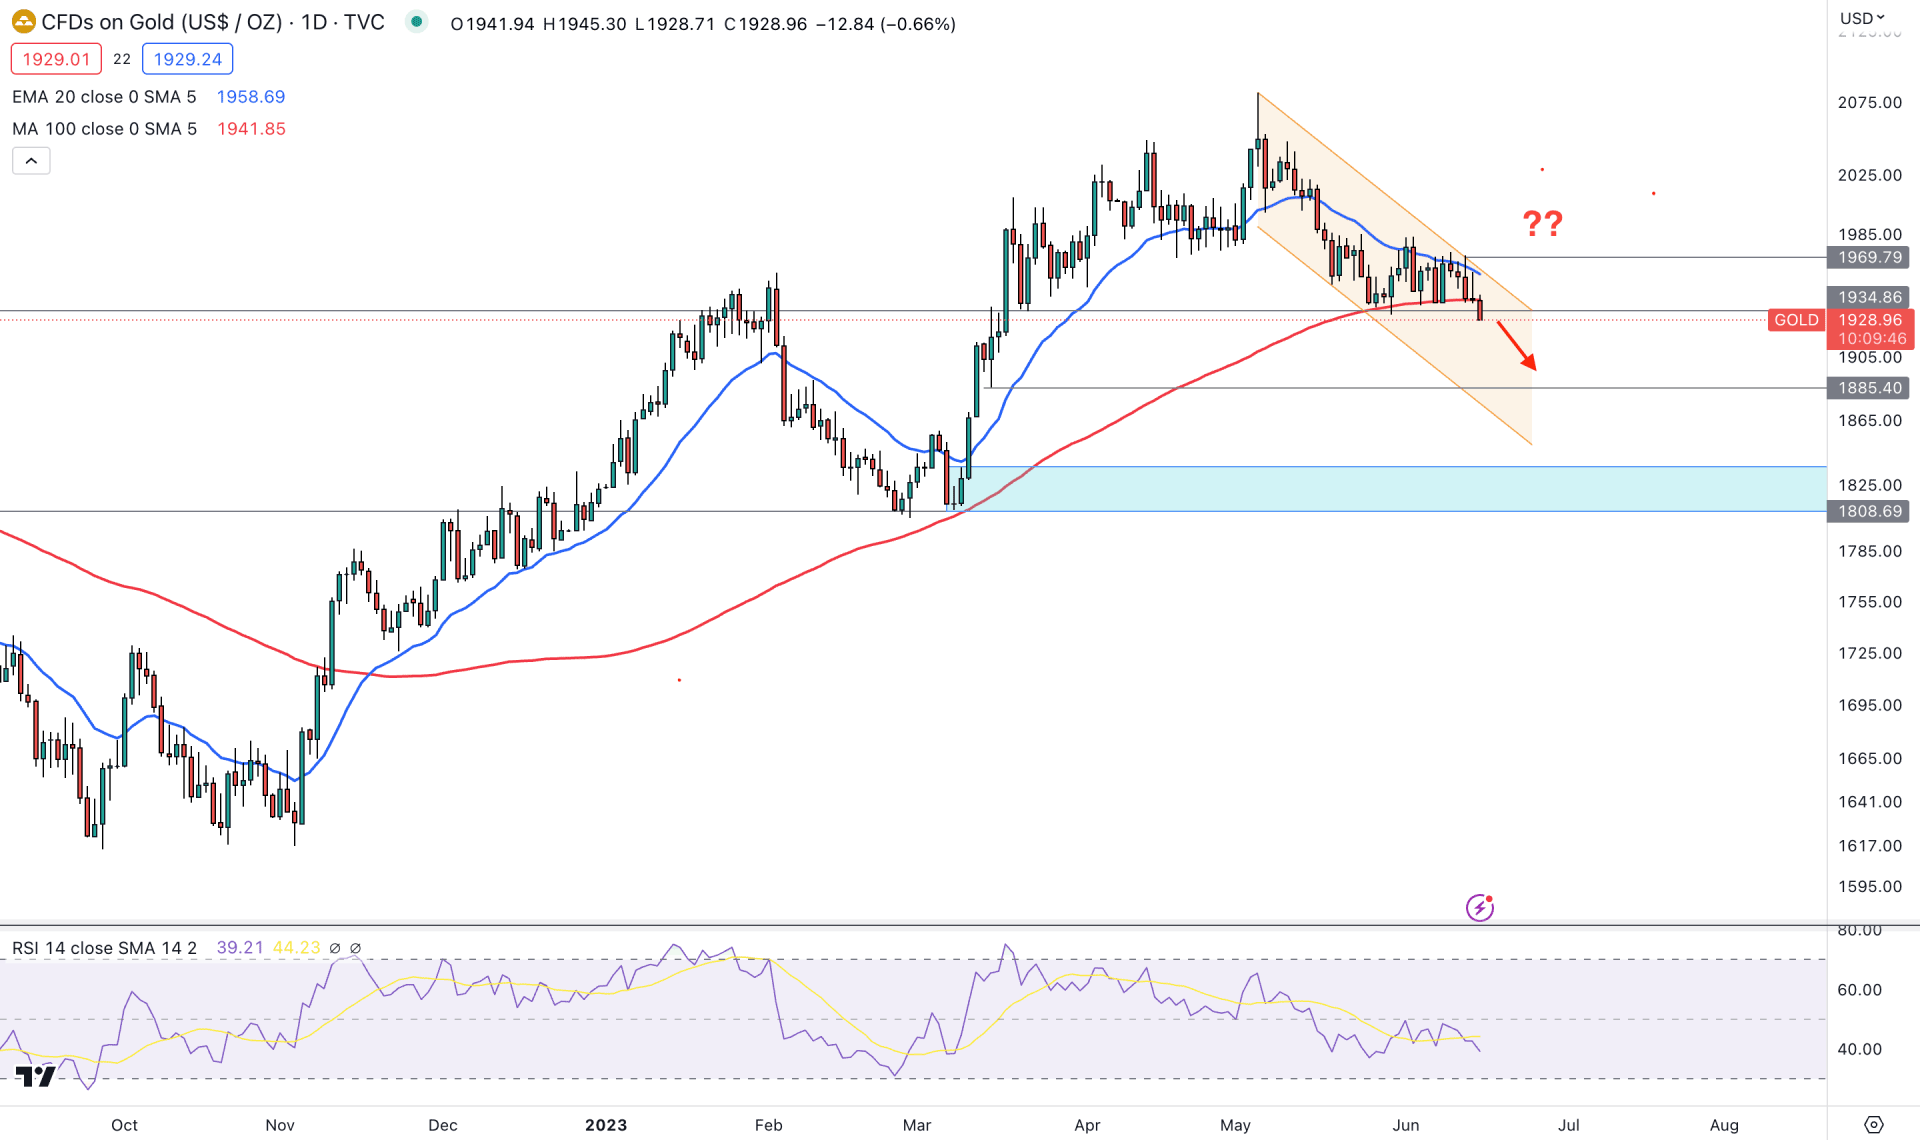
According to the daily price, the downward 20-day Exponential Moving Average level capped the XAUUSD price with a downswing. Moreover, the 100-day SMA is at the 1942.00 level, with the intraday price trading below it.
Looking from left to right- the XAUUSD price formed several higher highs, but after testing the 2081.00 high, it is the first time price showed a selling pressure below the 1934.86 critical support level.
As per the above image, the XAUUSD price trades within a descending channel where the latest price tested the channel resistance at the 1969.79 level. As long as the 1969.79 level is protected, investors might expect the downside momentum to continue as a channel extension.
In the indicator window, the 14-period RSI shows a downward pressure by holding the momentum below the 50.00 line. It is a sign that bears are taking control of the price until the RSI reaches the 30.00 oversold level.
On the bearish side, sellers have already taken the price below the 100-day SMA level. Therefore, a bearish D1 candle below the 1930.00 level could initiate a sharp sell-off towards the 1918.00 level in this pair. Also, the 1900.00 level would be a strong barrier, as breaking below this level could be an alarming sign for bulls.
A strong recovery above the 100-day SMA is needed on the bullish side before aiming for a long position. Moreover, breaking above the 1969.79 static resistance could be the conservative bullish approach, targeting the 2000.00 level.
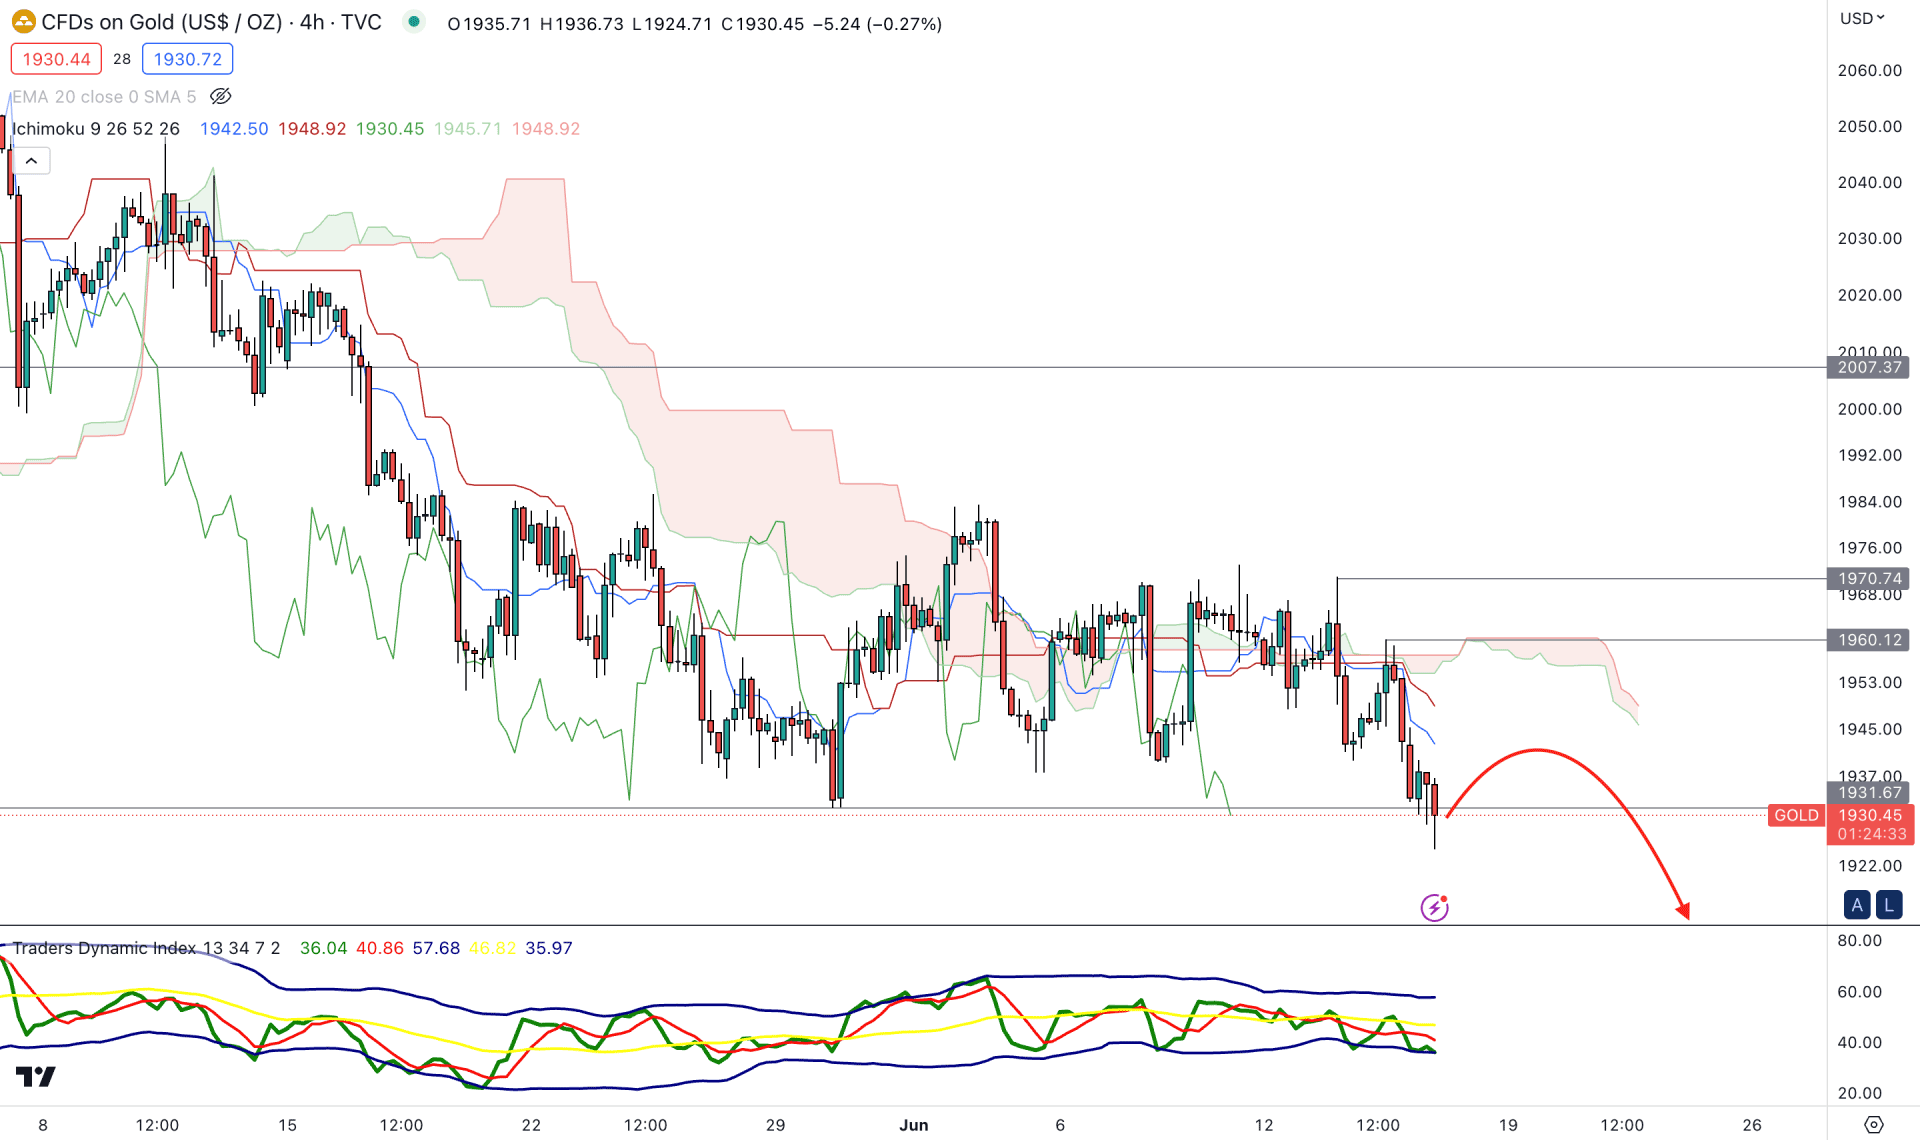
According to the Ichimoku Cloud analysis, the current market momentum is below the Cloud support, which signals a strong bearish momentum for the XAUUSD price.
In the future cloud, the Senkou Span A is below B, signaling a bearish momentum, while the gap between the current price and dynamic Kijun Sen is high.
The indicator window shows an oversold condition, where the current TDI level touched the lower band boundary.
Based on this structure, we may expect a bullish correction but a bearish continuation may appear after having a valid rejection from the Kijun Sen resistance.
On the other hand, the sell-side possibility is valid as long as the 1960.00 swing high is protected. Above this level, a strong bullish H4 candle may alter the current market trend towards the 1980.00 level.
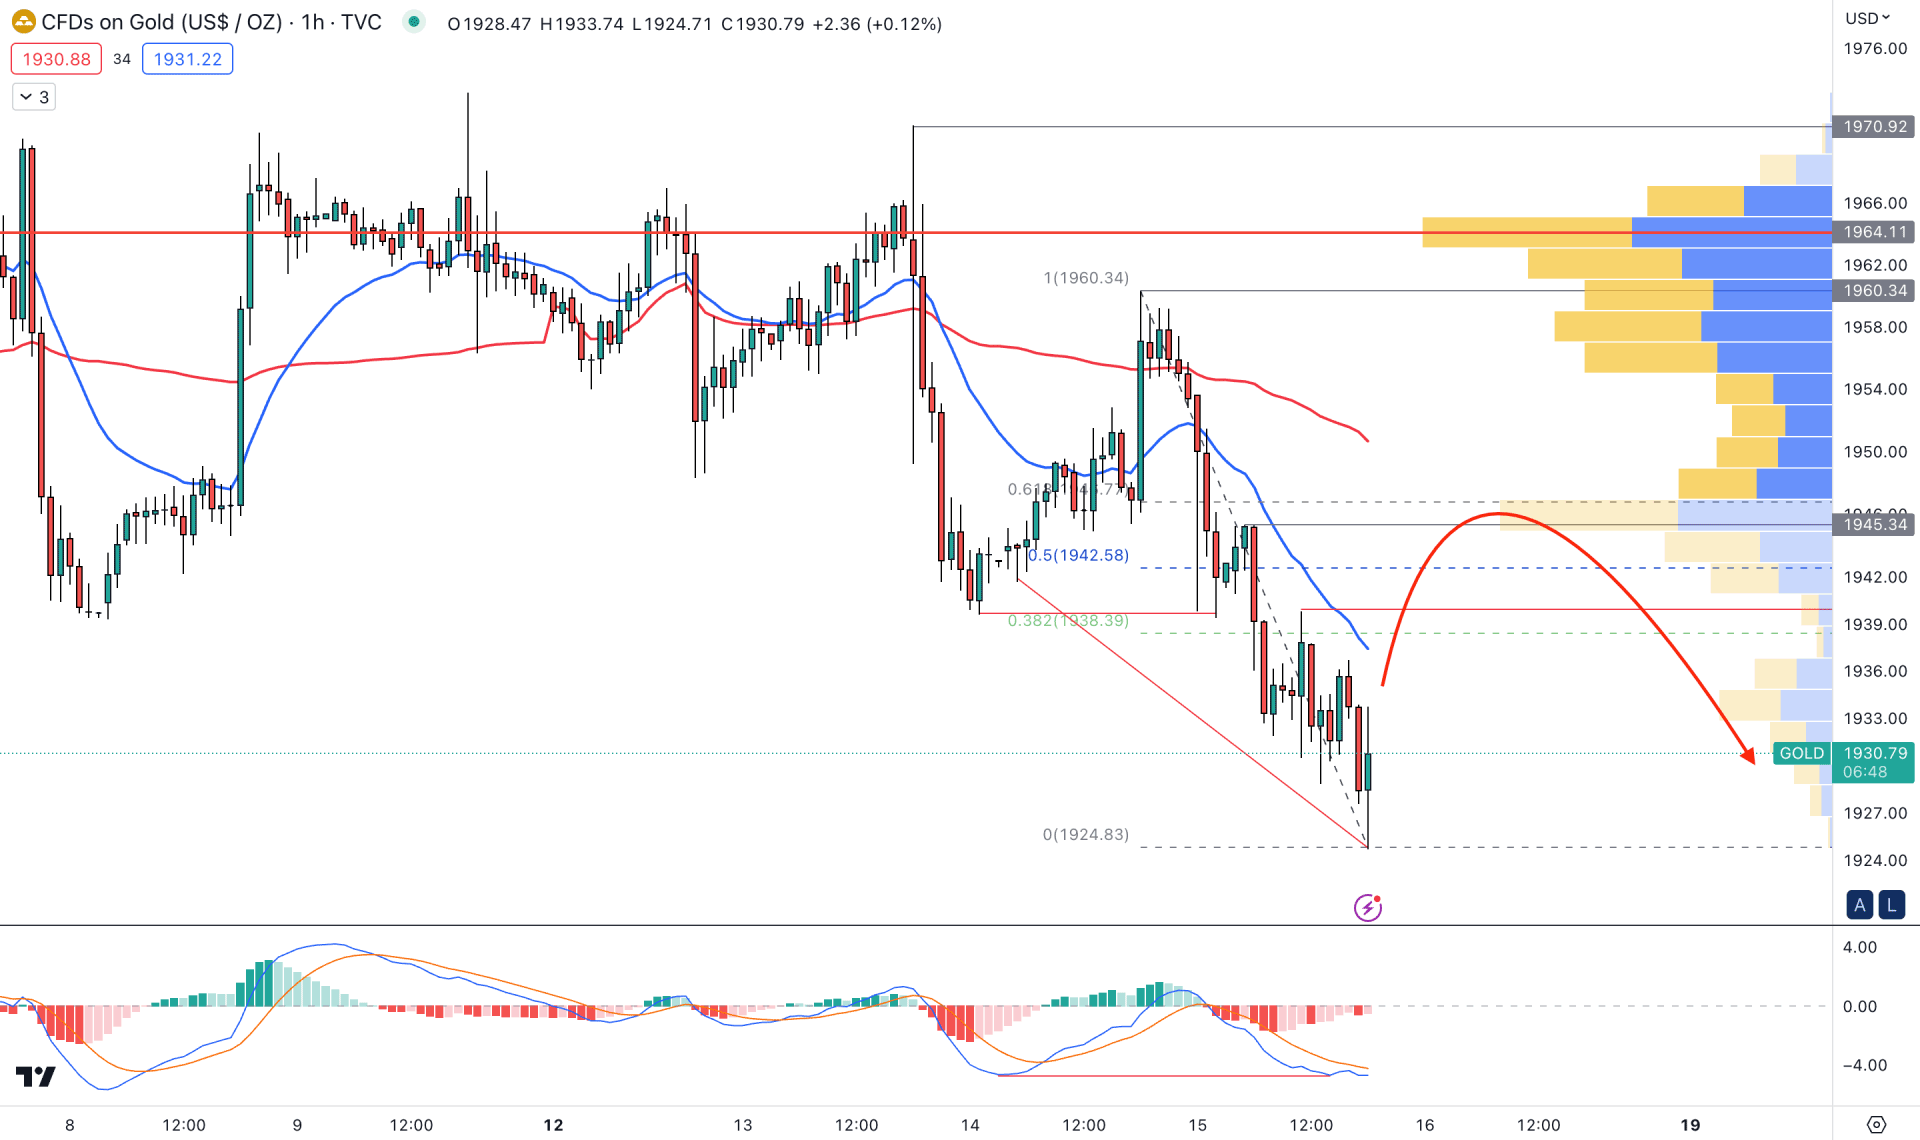
In the hourly chart, the current price is trading below the visible range high volume level, but the gap with the price is higher. It signifies that the broader market direction is bearish, where a minor upward correction is pending.
In the current swing from 1924.83 to 1960.34, the current price is trading at the discounted zone, and a buying pressure above the 1945.00 internal swing level could increase the selling pressure.
The dynamic 20 EMA is above the price, working as a resistance, but the gap between the 20 EMA and VWAP is higher, indicating volatility.
Based on this outlook, upward pressure may come where bulls may regain momentum toward the 1950.00 to 1960.00 area. However, any strong bearish rejection from the dynamic 20 EMA or VWAP could offer a sell signal, targeting the 1920.00 level.
Based on the current multi-timeframe analysis of XAUUSD, a bearish correction is active on the higher timeframe price action, which can lower the price towards the 1920.00 or 1900.00 level. A valid channel breakout with a strong price action above the 1970.00 for longterm bulls is needed before aiming for the 2000.00 level.


