
Published: October 12th, 2022
On Tuesday, the yellow metal showed sellers' presence in the market but failed to close the daily candle below the trendline support. Resurgent demand for USD continued to support XAU sellers; a small pullback in the U.S. treasury yield helped comfort the bullion pain.
Janet Yellen, US Secretary, said, “I believe the dollar's current level reflects appropriate policies.” that steadily reflected the dollar bulls. The comments from Andrew Bailey, BOE governor, and Loretta Mester, Cleveland Fed President, also favored it. Mester mentioned that the FED needs to keep up with increasing interest rates, where further increases in rates would influence investors to move on to high-yielding assets like the USD.
On the other hand, if central banks fail to hold the economy from excessive tightening, a recession could occur. Therefore, the current trading days are crucial for precious metal traders, as any party can win, depending on the market condition.
The Non-farm payroll has provided a sign of another rate hike in November, but investors should closely monitor this week’s Inflation report, where any ease in CPI could work as a bullish factor for Gold.
Let’s see the future price action of Gold from XAUUSD Technical analysis:
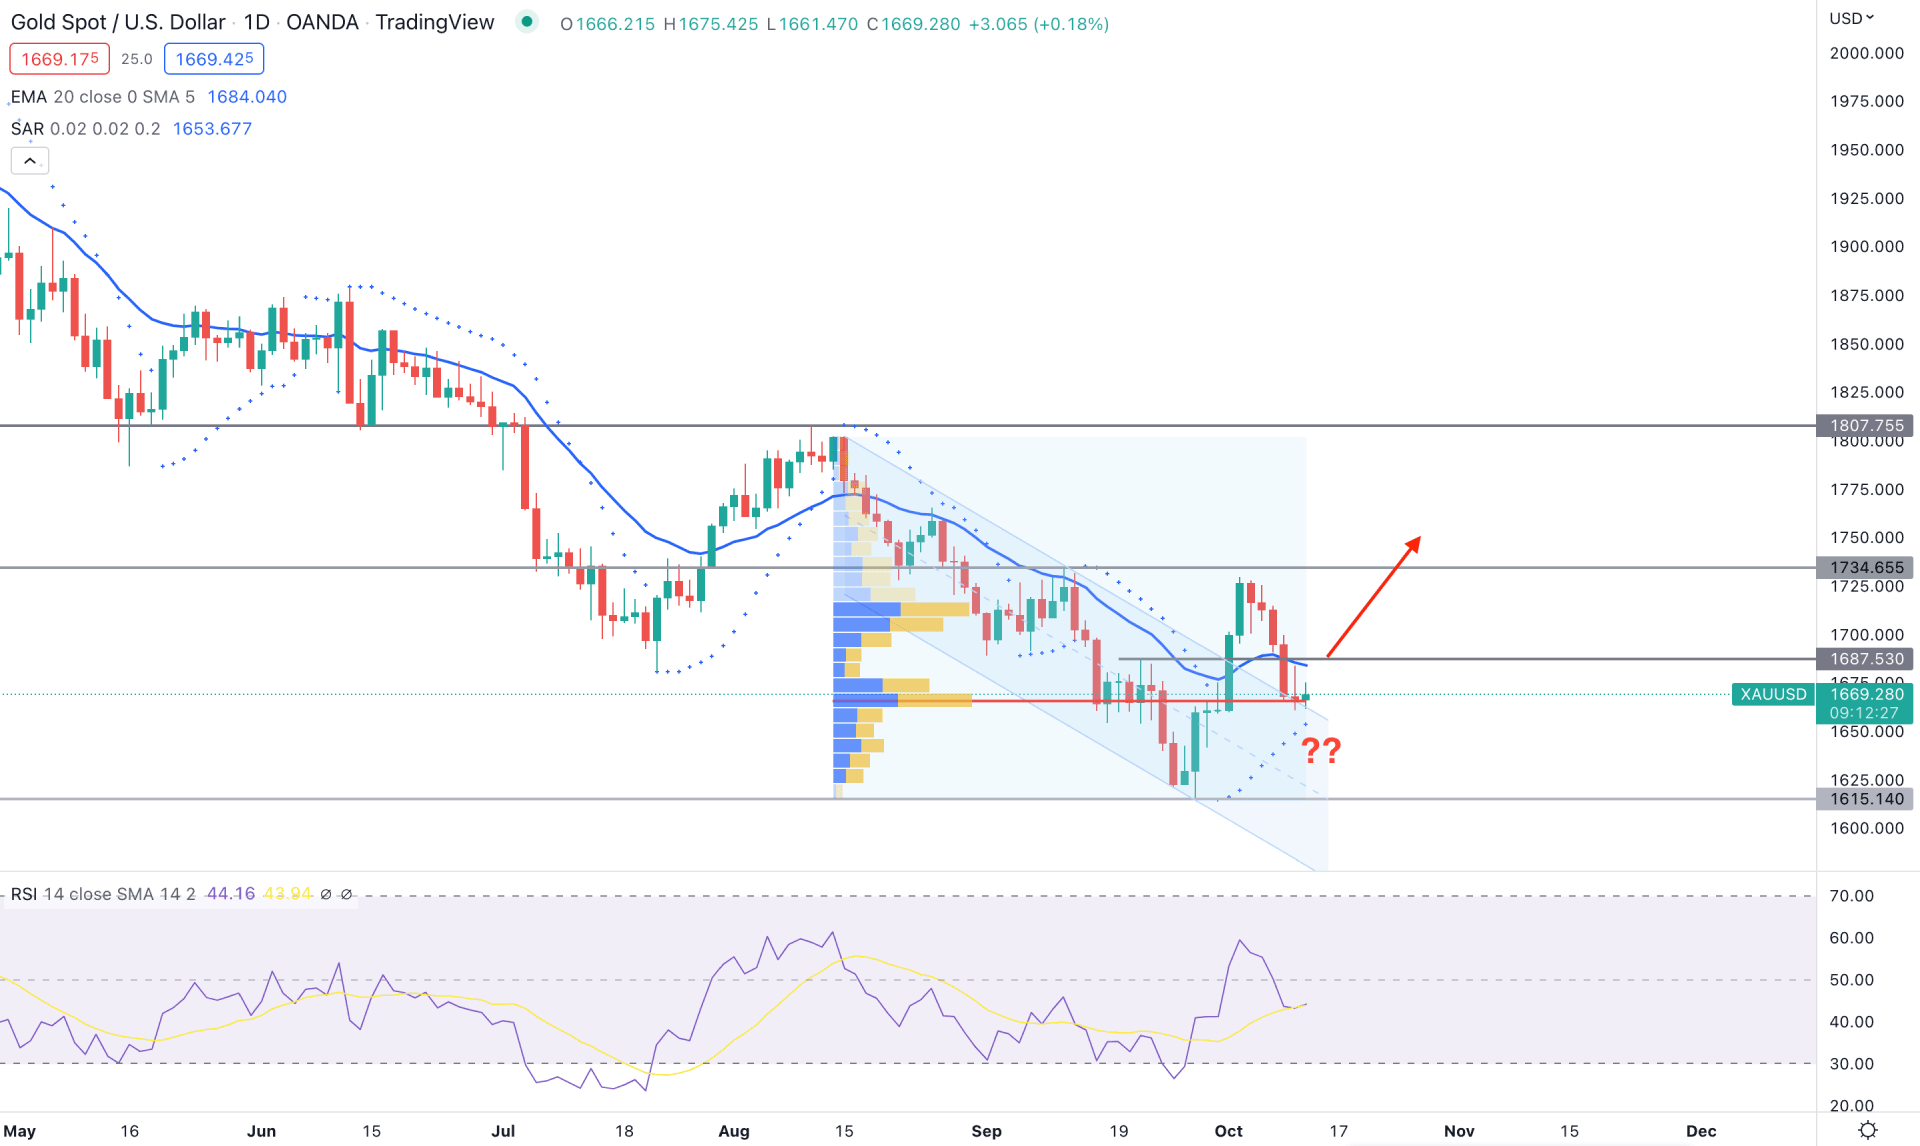
The daily chart of XAUUSD shows a buyers' presence in the market, although the broader market trend is still bearish. The price remained steady from the 1807.75 swing high, showing a deeper 10.68% discount to the 1615.14 swing low. However, the selling pressure remained in a correction, where a descending channel breakout created a long opportunity.
Based on the high activity level, the strongest volume level is at 1665.47, which is just below the current price. The highest activity level comes from the August 2022 high to September 2022 low, which indicates that the most recent buying pressure is still valid until it comes within the trendline support with a daily close.
The dynamic 20 DMA is above the price, which is the primary barrier for bulls. Moreover, the Relative Strength Index (RSI) shows buyers’ interest in the market by taking above the 50% area. Besides, Parabolic Dots are still below the price and offer a buying possibility.
Based on the daily price of XAUUSD, bulls should wait for the price to move beyond the 1689.00 near-term resistance level before aiming for the 1733.65 level. On the other hand, the price is already facing support from the high volume 1665.47 level. Therefore, a break below this level with a daily close could alter the current market momentum and extend the bearish pressure to the 1615.14 support level.
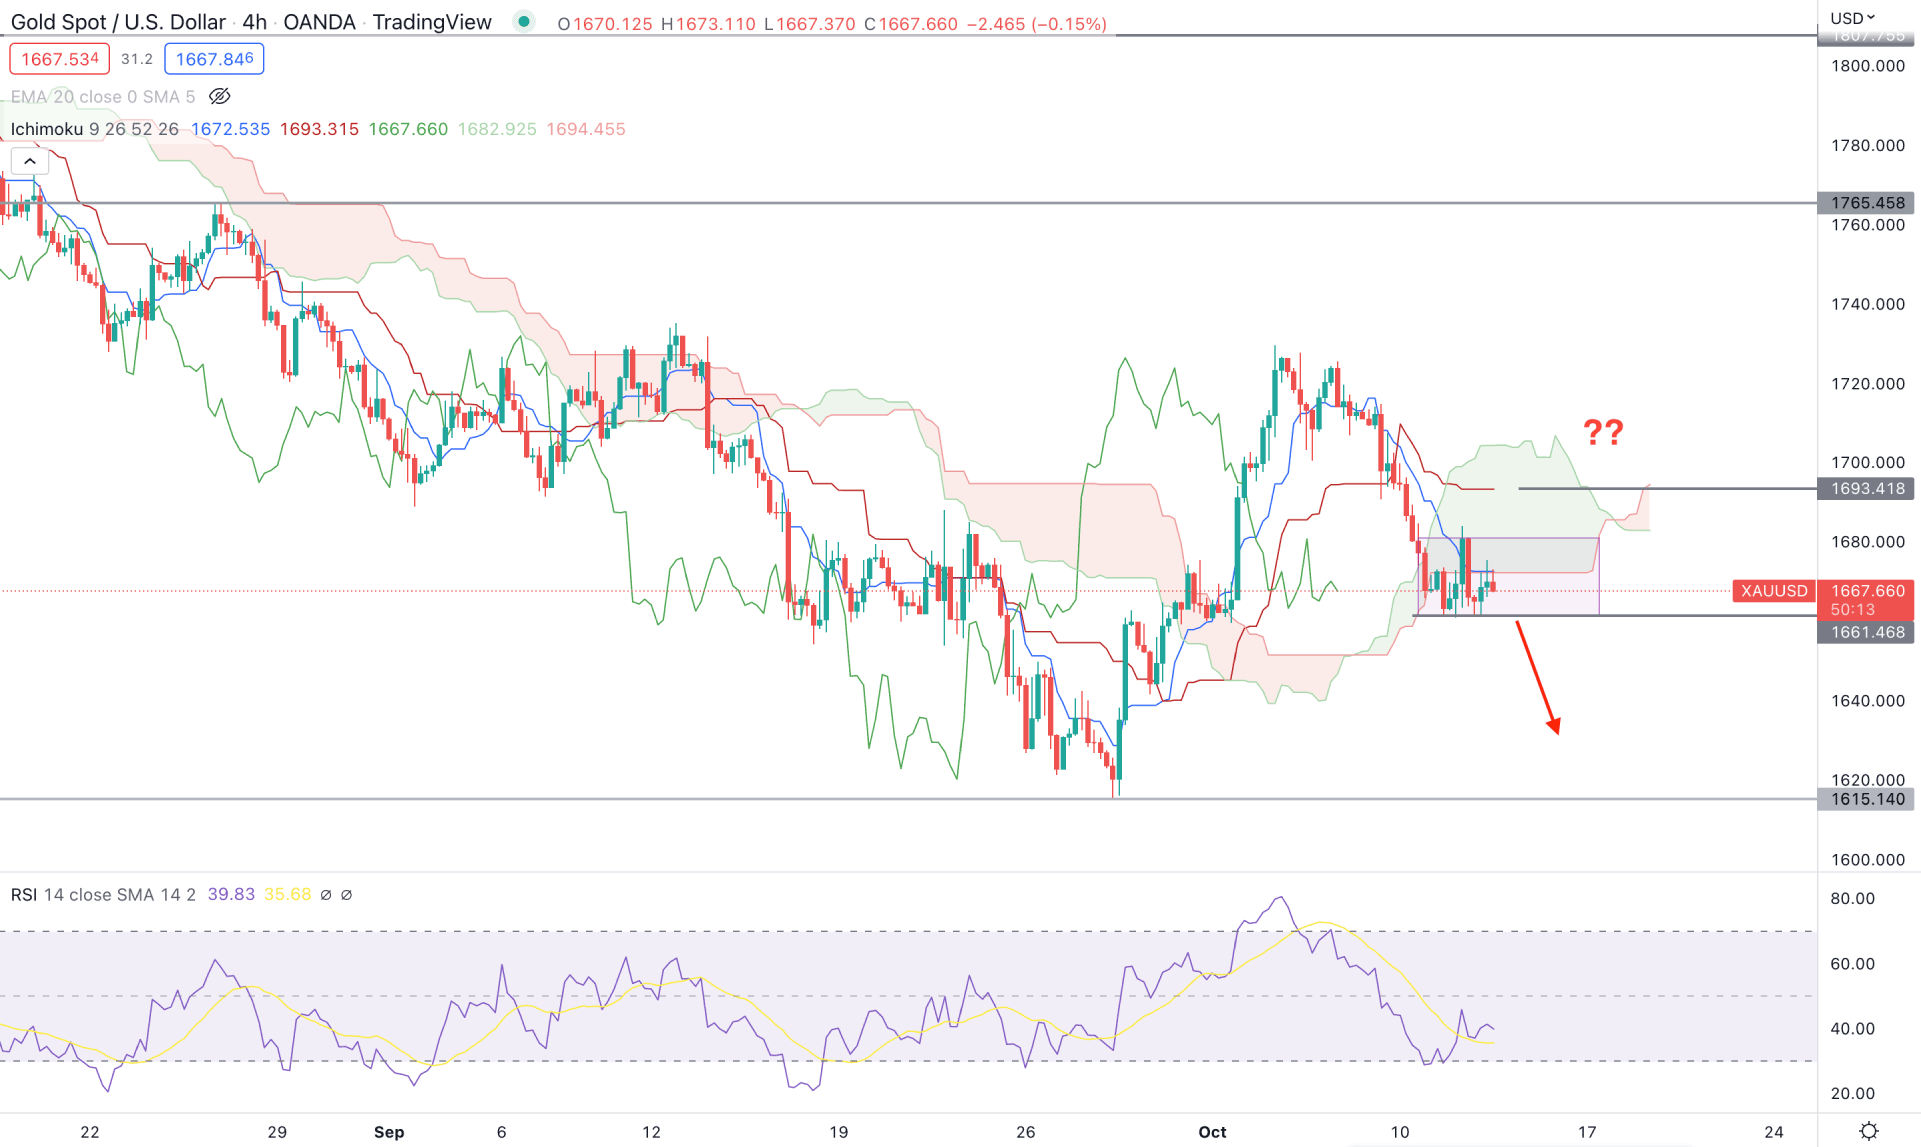
The selling pressure in the XAUUSD price is solid, as shown in the Ichimoku Cloud price structure. The future cloud is still favorable to bears as the Senkou Span A is below the B. Moreover, the bearish pressure is backed by a buyer's failure to hold the price above the cloud zone.
The selling pressure became corrective below the cloud resistance, which is a sign of less buying pressure in the market. In that case, a rectangle pattern breakout with an H4 close below the 1661.48 level could offer a decent short opportunity in this pair. Moreover, the dynamic Kijun Sen and Tenkan Sen are above the price and resist the selling pressure.
However, the scenario could alter if bulls regained momentum and formed an H4 candle above the dynamic Kijun Sen level. The buying pressure would be valid in that case, targeting the 1765.00 area.
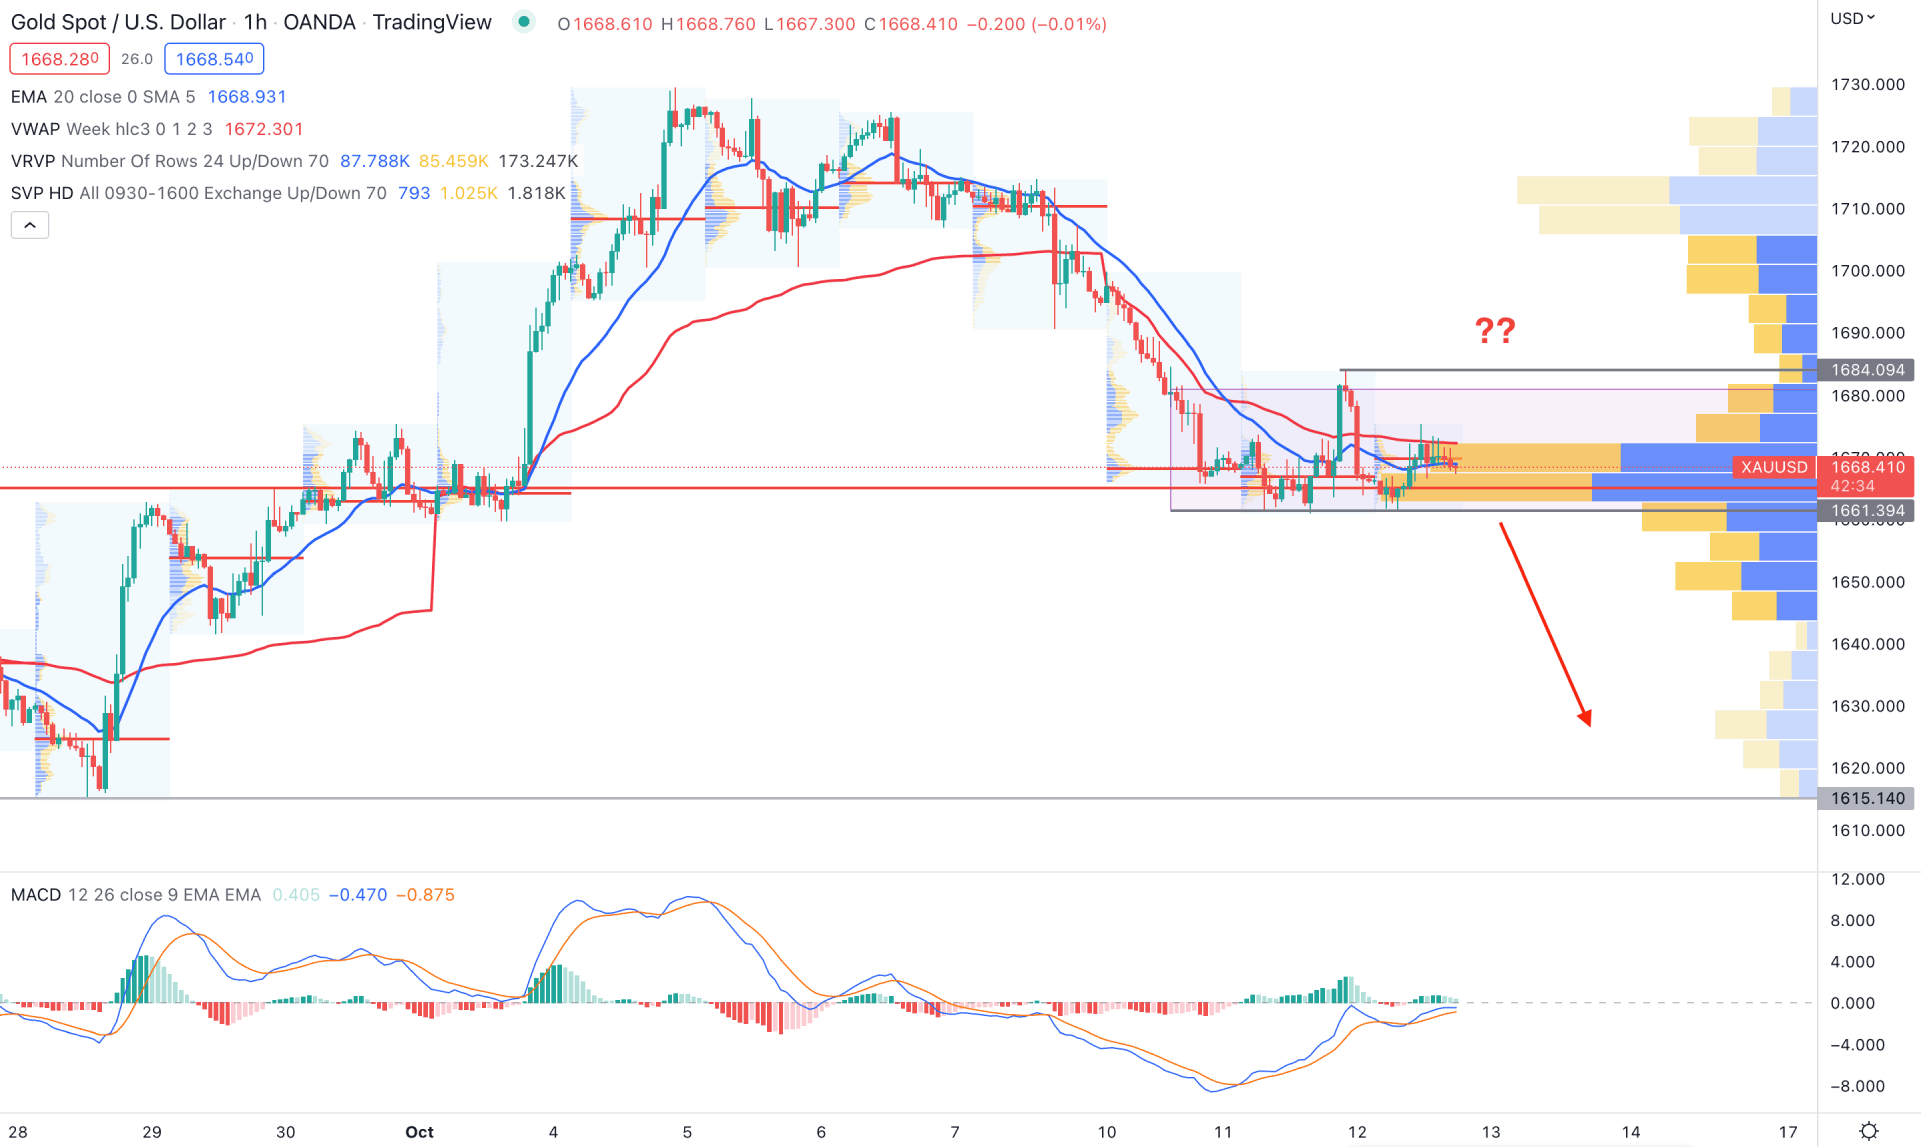
The selling pressure in the XAUUSD price is also potent in the H1 chart as the price is hovering above the visible range high volume level of 1665.63. In that case, a bearish pressure below the 1661.39 rectangle support would come with solid selling pressure, increasing the bearish possibility towards the 1615.14 support level.
The dynamic 20 EMA and weekly VWAP are above the price and working as immediate resistance levels. Moreover, the MACD Histogram is bullish, where MACD lines have more room to move higher, above the neutral level.
Based on the H1 price action, a bullish recovery with an hourly close above 1684.04 would open a bullish opportunity, targeting the 1730.00 area.
Based on the current analysis, the XAUUSD intraday price is still bearish, where breaking below the rectangle pattern could offer a short opportunity, targeting the 1615.00 level. However, investors should wait for a bullish breakout and a daily close above the near-term resistance before going long in this pair.


