
Published: March 17th, 2020
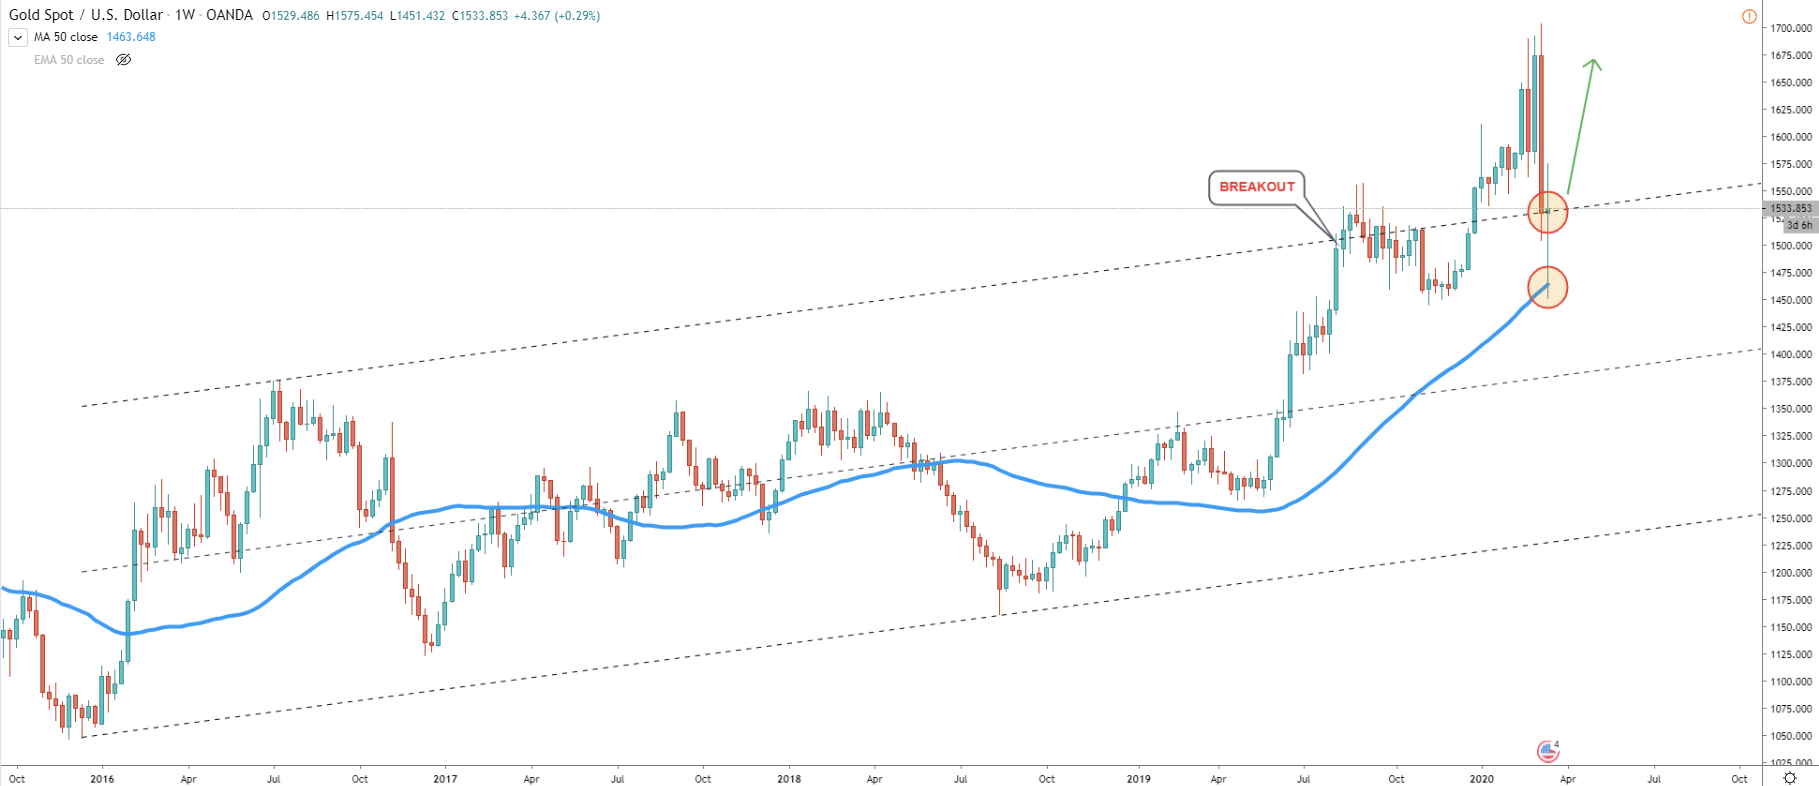
The weekly chart shows a strong and valid uptrend on XAU/USD. There are three factors worth bringing to your attention. Frist is a break above the descending channel. Second, is that on the recent correction down price failed to close below the upper trendline of the channel, which is obviously acting as the support. And third, is that price rejected the 50 Exponential Moving Average. All these facts are in favor of the uptrend continuation, at least in the short term.
At the very least price can go towards previously establish high, near $1700 area.
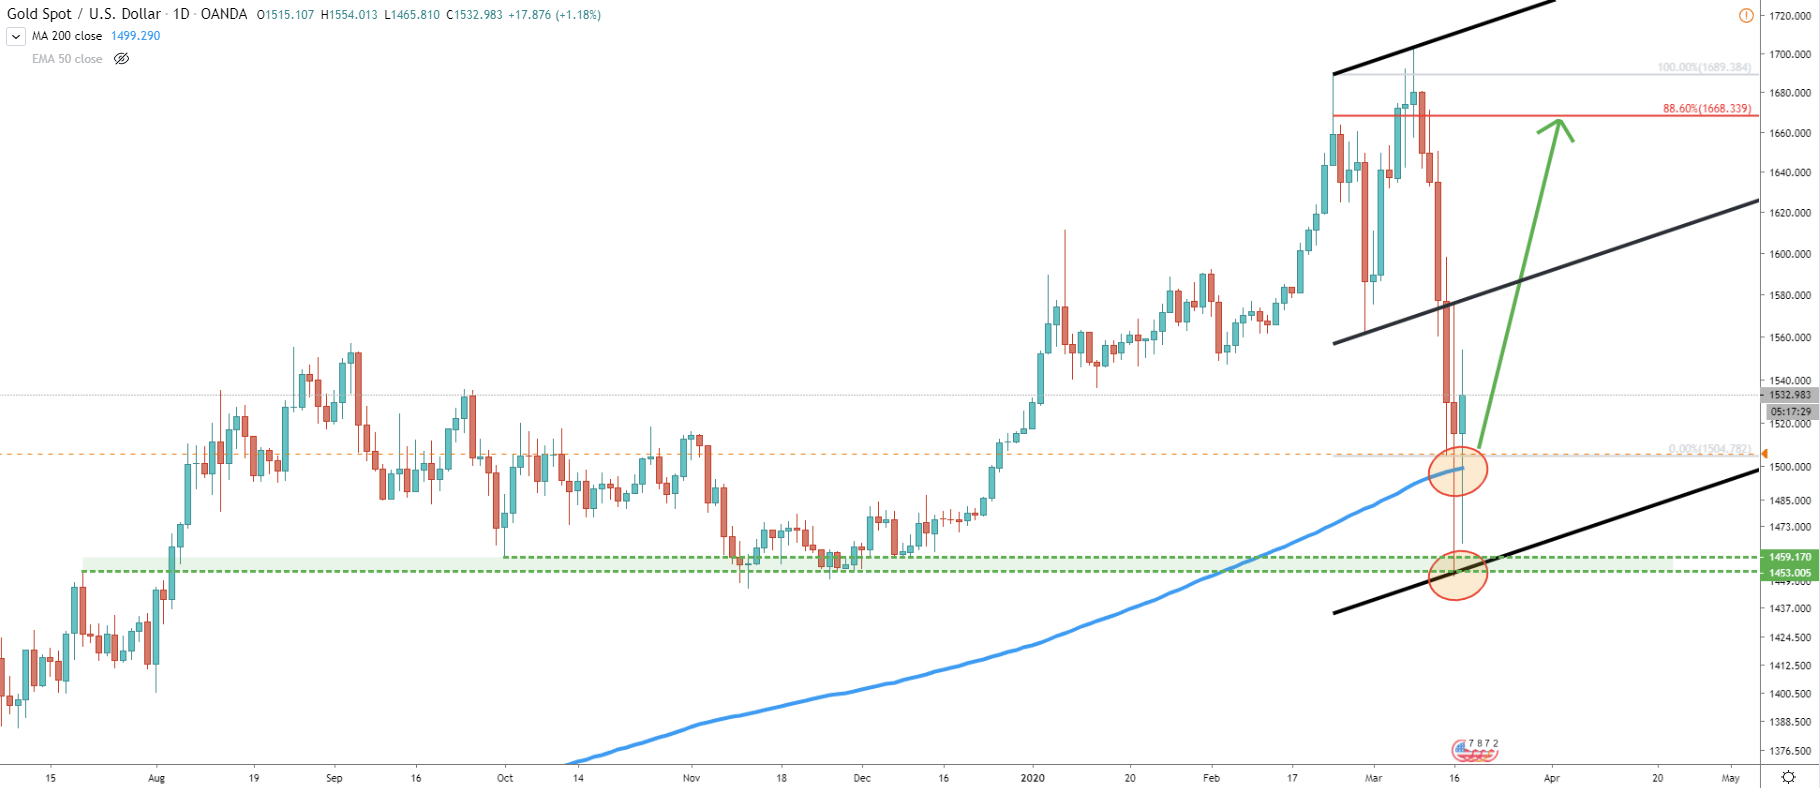
Now the daily chart is showing a similar tendency. Price has rejected previous levels of support, which is the area between $1450 and $1460. Looks like this might be the key support for the long term uptrend and from this point onwards we might witness more growth from Gold. Another thing is a failure to close below the 200 EMA and finally, the price has reached the lower trendline of the extended ascending channel. Yesterday, on March 17, this trendline has been rejected cleanly, showing great interest in gold and acting as a strong demand zone.
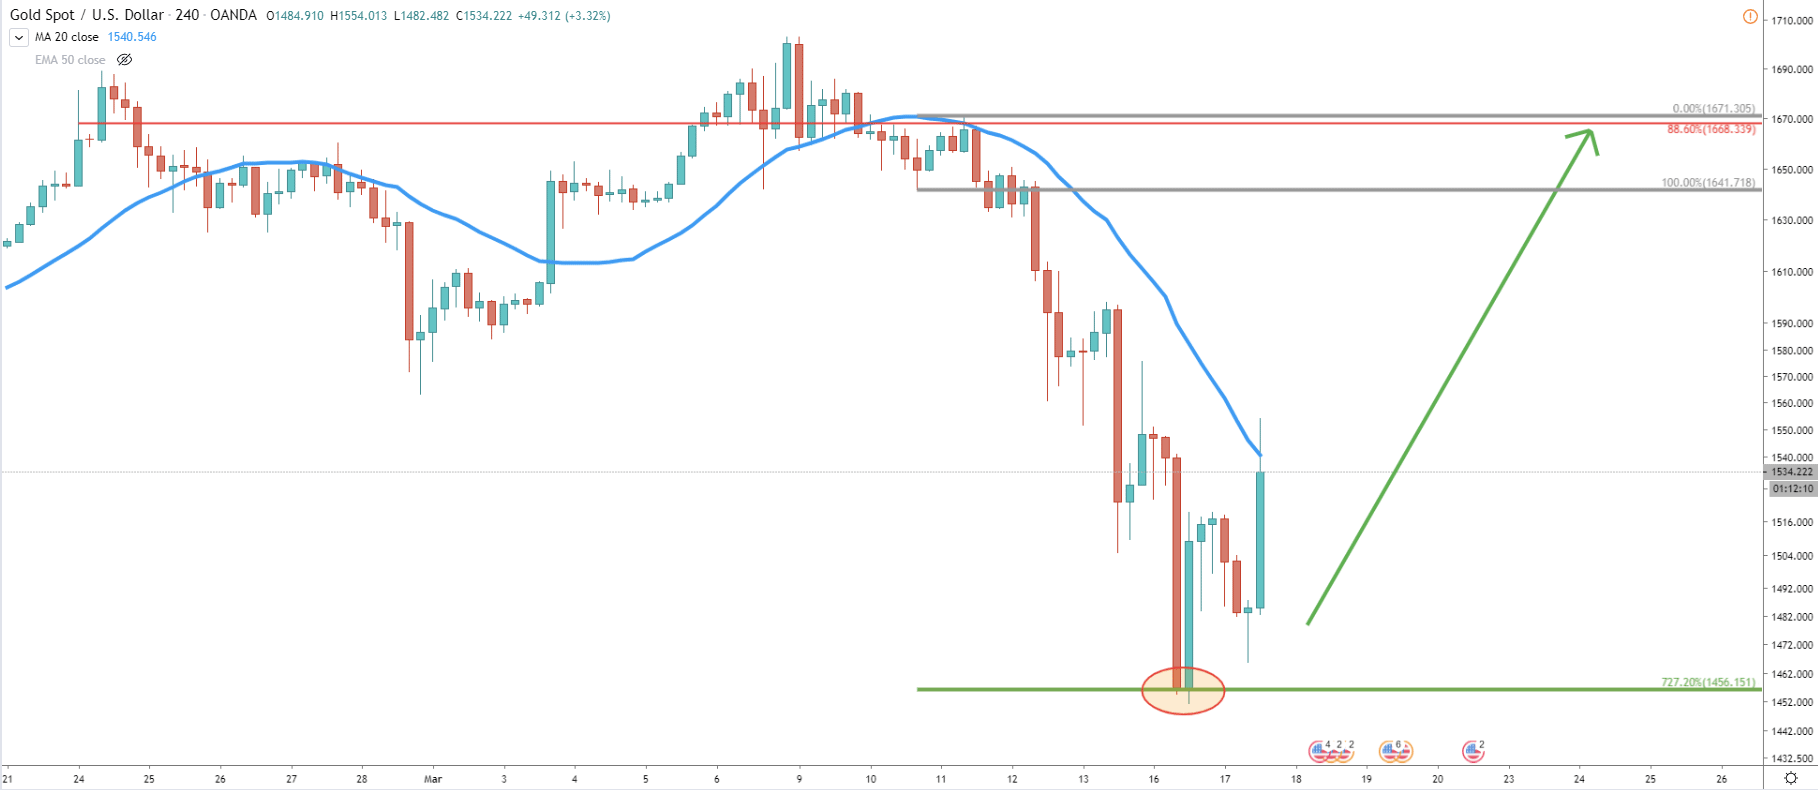
Moving on to the 4H chart. Where a price has reached and rejected 727.2% Fibonacci retracement level. Fibonacci was applied to the first corrective wave up, after breaking below the 20 EMA. While there was a small spike below this level, the important thing is that price closed right at the $1456 Fibonacci support. We already can see a strong growth after the rejection, although XAU/USD found the resistance at 20 EMA. This could mean that a short term consolidation can take place before/if price will go higher.
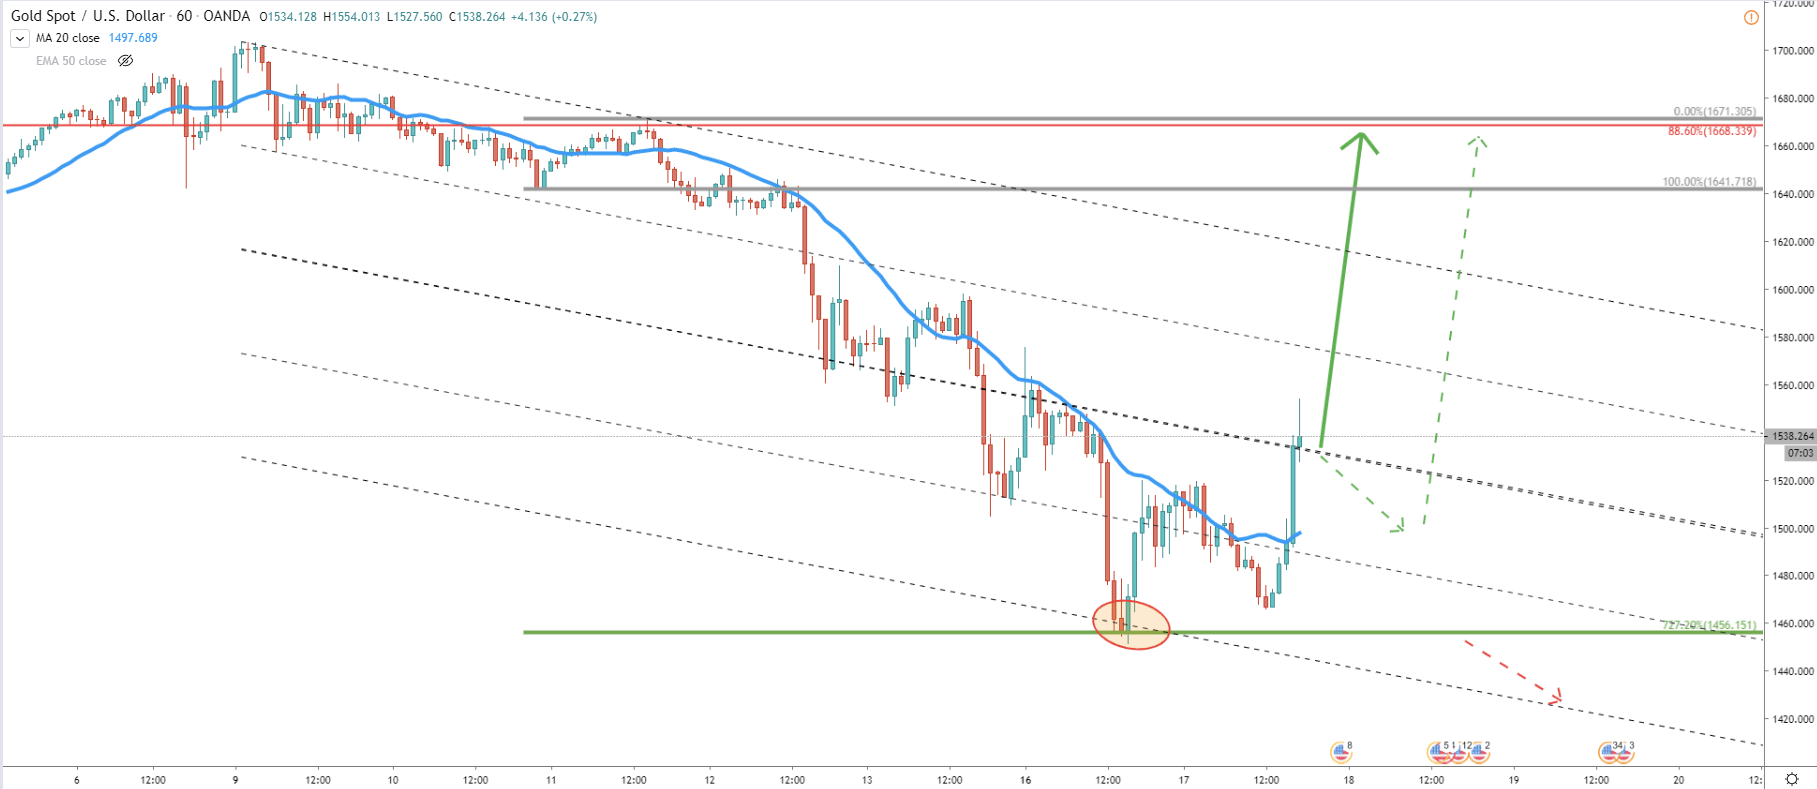
The hourly chart shows that the price also reached and rejected one of the trendlines of the extended descending channel. After that, it broke above the 20 EMA and went up sharply. As already mentioned, a small corrective move down would be quite healthy in this situation, where $1500 psychological level could be very attractive for buyers.
On the Weekly chart, there is a strong ongoing uptrend. It seems like any strong pullback can be considered as a buying opportunity. And this week there was such a pullback, which means, buyers can jump in once again.
While it is an uptrend, new higher highs can be expected. Nevertheless, it would be safer to have closer targets. In volatile markets, 88.6% Fibonacci retracement level is very useful and this level could be acting as a magnet for XAU/USD. This level is at $1668 and should be treated as a key resistance level and a potential upside target in the coming days.
At this point, the probability of a downtrend is very low, although, it should be considered. Daily break and close below the $1450 would certainly show selling pressure and could turn the uptrend into the downtrend.
Support: $1456
Resistance: $1668


