Published: March 4th, 2020
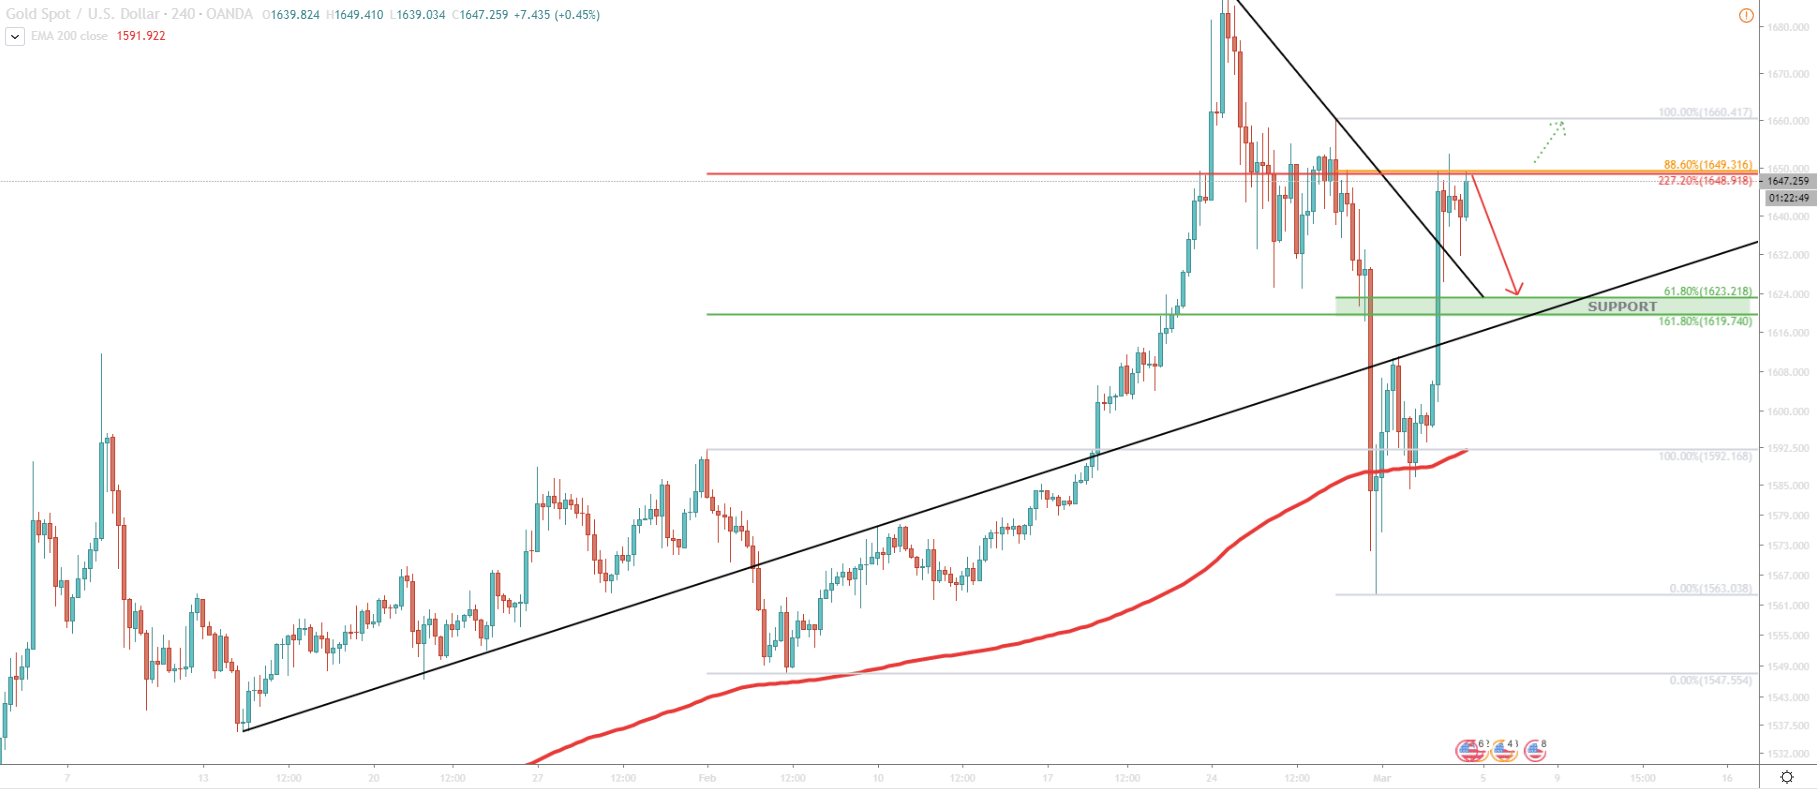
On February 5, gold downside correction has ended, while almost reaching the 200 EMA. After a short term consolidation, XAU/USD has started to grow exponentially.
In just 20 days period, from 4 to 24th of February, the price has grown by nearly 10%. Gold went from $1548 up to $1689 per troy ounce. This was a very rapid growth after which gold became $141 more expensive.
Nonetheless, the correction did come and it was as sharp as the growth. From the $1689 price fell down to $1563 in just 4 trading days. It was a 5.77% drop resulting in the break and close below the 200 EMA.
On the chart above, we have used two Fibonacci retracement indicators. First applied to the 4-24 February rally and second applied to the 24-28 February drop. First Fibs shows that there is a resistance at $1648, which is a 227.2% retracement level, and the second Fibs shows that there is also resistance 88.6%. Both of them correspond to the same price area, which is $1648-1649. It makes this price quite an important resistance, and while Gold remains below, there is a high probability that price will correct down. The support zone is seen between $1619 and $1623 as per 61.8% and 161.8% Fibonacci retracement levels.
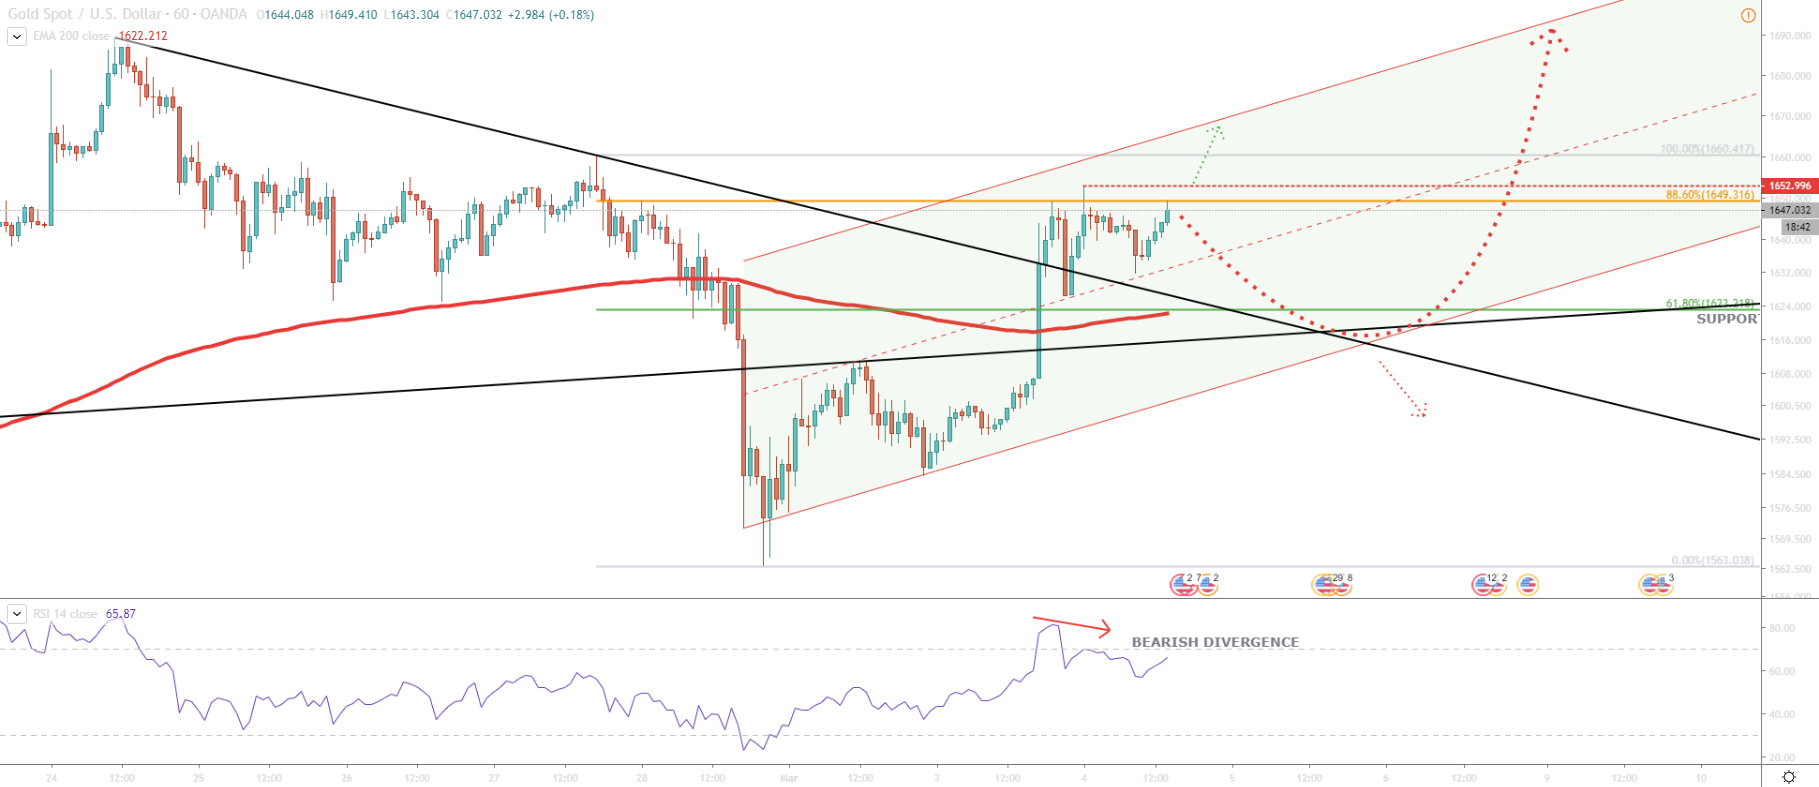
1H chart shows what we can expect from the price of Gold in the medium to short-term. At this stage, the trend seems to become bullish as there two facts pointing on it. First is break above the downtrend trendline, while second is a break above the 200 EMA.
But overall it is a mixed sentiment as the $1650 resistance area is being rejected currently. Another thing to keep in mind is the formation of bearish divergence on the RSI oscillator. Both of these facts are point out on a potential corrective move down. Once and if XAU/USD corrects down to $1623 support, it will be important to see the price action around this area. Daily break and close lower, can initiate a much stronger correction to the downside. On the other side, rejection of this support can result in a long term uptrend continuation, thus becoming a strong demand zone for long term investors.
The alternative scenario if Gold breaks and closed above the $1653, which is a recently printed high. This could certainly show some bull power and push the price back to the previous high near $1670.
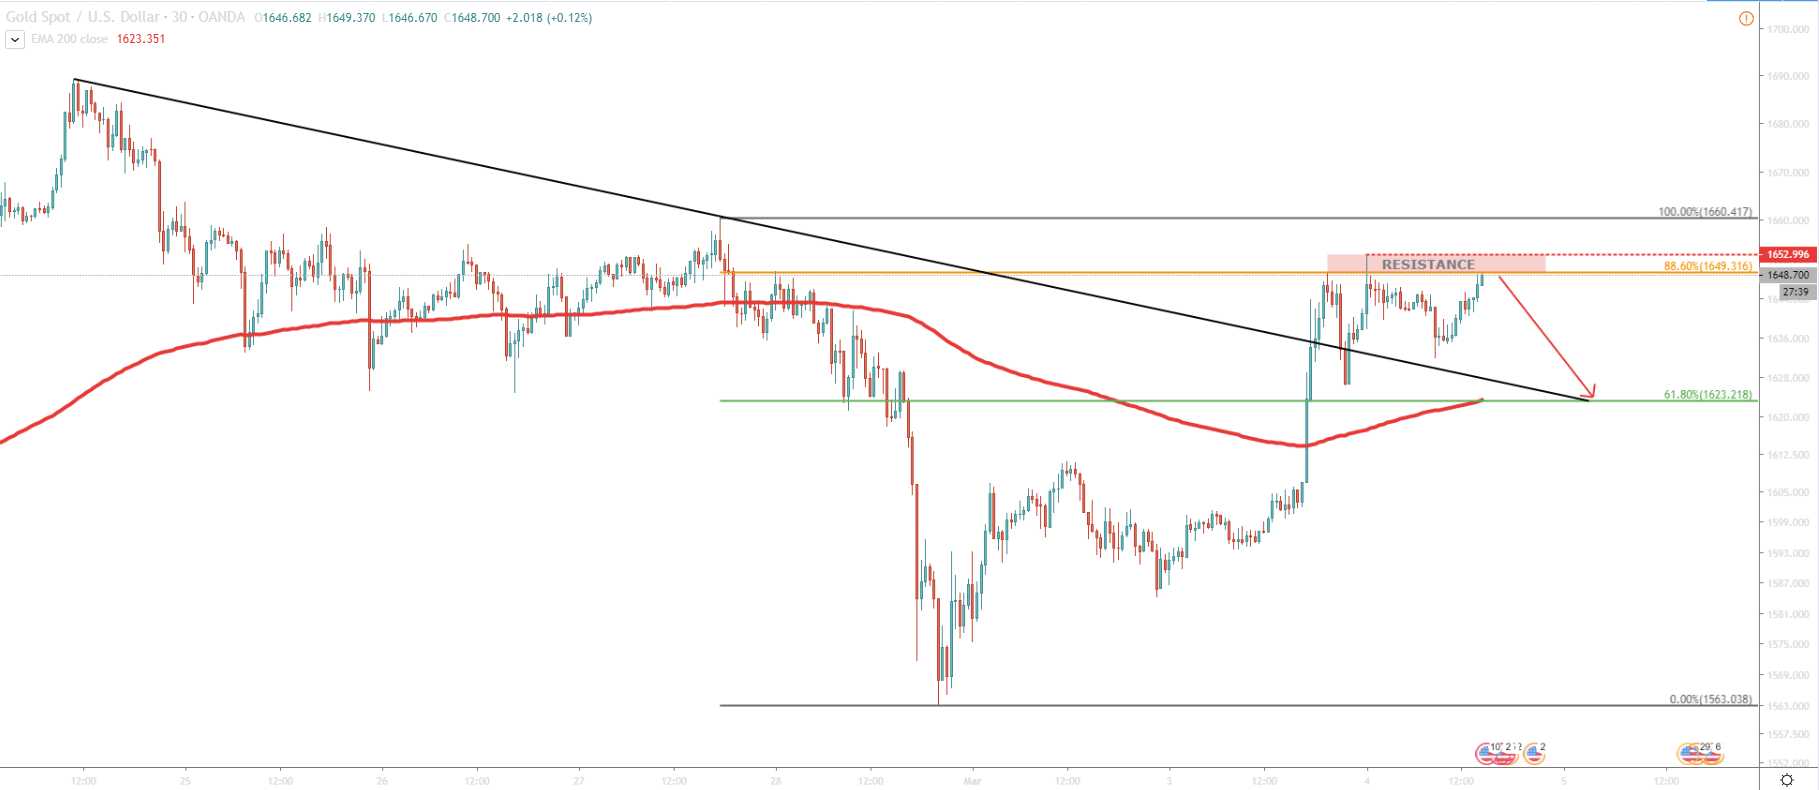
Gold doesn’t’ have a distinguished direction, but rather a mixed sentiment. While some facts pointing out on the uptrend, others are pointing on a correction, either small or large. All-in-all, Gold could consolidate between $1623 support and $1649 resistance for the time being. Break above or below this range should provide a better understanding of the medium and even long term price direction.
If correction takes place. The key support is seen at $1623, which corresponds to the 61.8% Fibonacci retracement level as well as 200 EMA on the 1H chart.
While the price is above the 200 EMA it remains very likely that growth will continue, especially considering the break above the downtrend trendline. Break and close above $1652 should confirm bullish domination and can result in yet another exponential price growth.
Support: $1623
Resistance: $1649, $1653


