

Published: October 15th, 2026
Gold and silver prices came under significant pressure during early U.S. trading on Wednesday. Stronger-than-anticipated inflation figures reinforced expectations that the Federal Reserve could maintain tighter monetary policy.
The latest inflation report prompted investors to reassess the outlook for U.S. monetary policy. September's Consumer Price Index (CPI) rose 0.6% from the previous month and 3.7% year over year. The yearly increase exceeded the market forecast of 3.6% and accelerated from August's 3.4% reading.
Core CPI, which excludes food and energy prices, advanced 0.3% month over month and 2.6% year over year. A 9.1% jump in gasoline prices, alongside a 5.2% increase in the overall energy index, underscored the growing impact of higher energy costs on headline inflation.
Meanwhile, tensions surrounding the Strait of Hormuz and the ongoing confrontation between the U.S. and Iran continue to threaten global oil supplies. These developments could weigh on precious metals by sustaining inflationary pressures, pushing bond yields higher and supporting the U.S. dollar.
Crude oil prices climbed following an attack on a Saudi Aramco facility in Dhahran. Iranian officials also reported adopting new methods to target maritime traffic, while the Iran-backed Houthi movement continued its missile and drone strikes against Saudi Arabia.
Let's review the Silver's price outlook from the XAGUSD technical analysis:
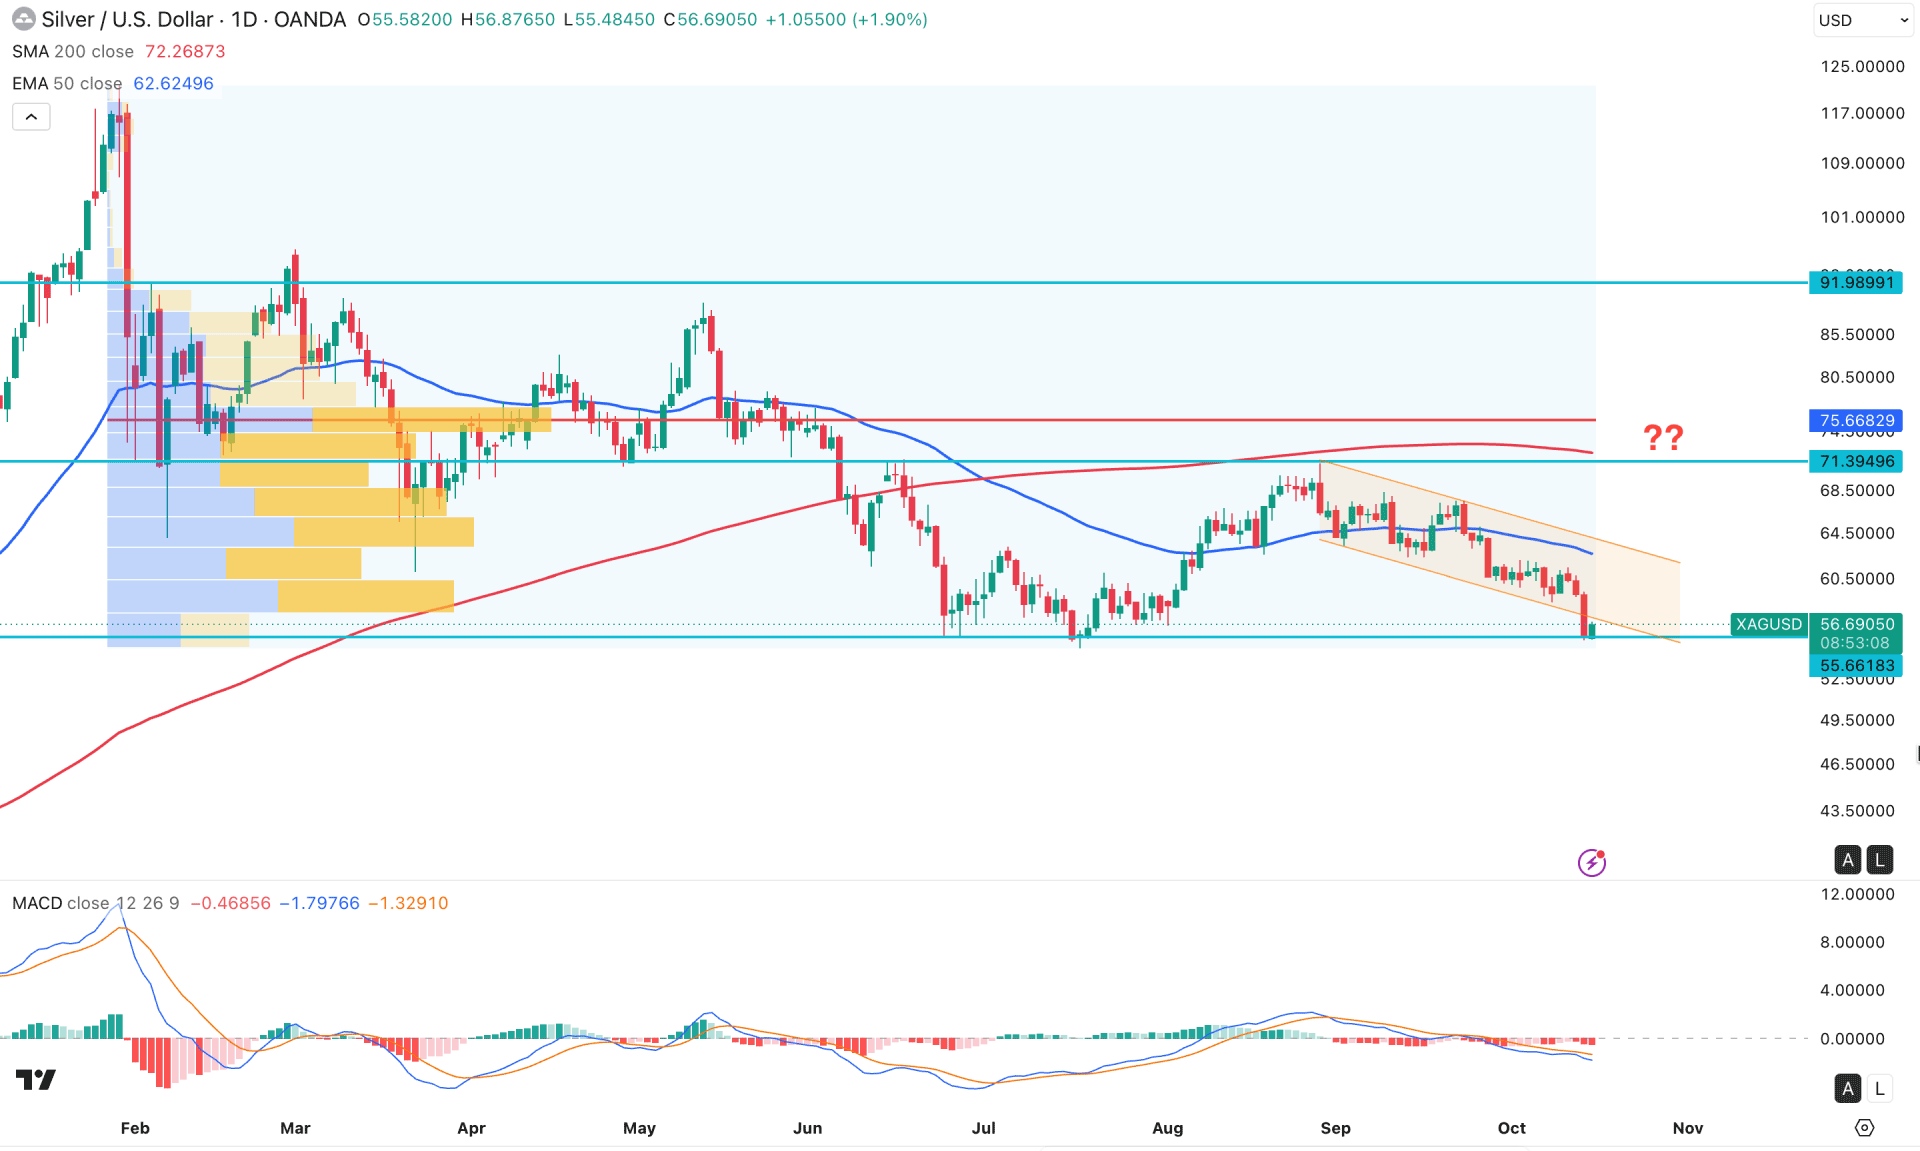
On the daily chart of XAGUSD, market momentum is bearish, following massive downside pressure at the start of 2026. As the current price tests the crucial bottom around 55.66, investors may need to wait to see how price reacts at this level before looking for a trading opportunity.
On the higher timeframe, the market is extremely bearish, as price exhausted itself after moving near the 120.00 psychological line. Monthly momentum remains bearish, following an immediate bearish rebound in September 2026. The weekly timeframe shows a similar structure, with no sign of bullish bias for the last eight weeks. As price approaches a crucial support level, bullish price action could limit selling pressure at any time.
In the main price chart, the 50-day EMA and 100-day SMA slope downward. Moreover, both lines sit above the current price and act as strong resistance. Meanwhile, price rebounded after testing the 55.66 area but failed to hold momentum above the 50-day EMA. This is a primary sign of a bearish break at this level as long as price remains below the 50-day EMA.
In the indicator window, the MACD signal line has approached the neutral area after forming multiple bearish vertical lines. However, the signal line remains below the neutral area, with no sign of a bullish rebound.
Based on this outlook, XAGUSD is facing crucial support, with a minor bullish recovery pending. Before opening a long opportunity, a descending channel breakout with price holding above the 50-day EMA is needed. In that case, the immediate resistance to watch is the 77.66 high line before approaching the 91.98 resistance level.
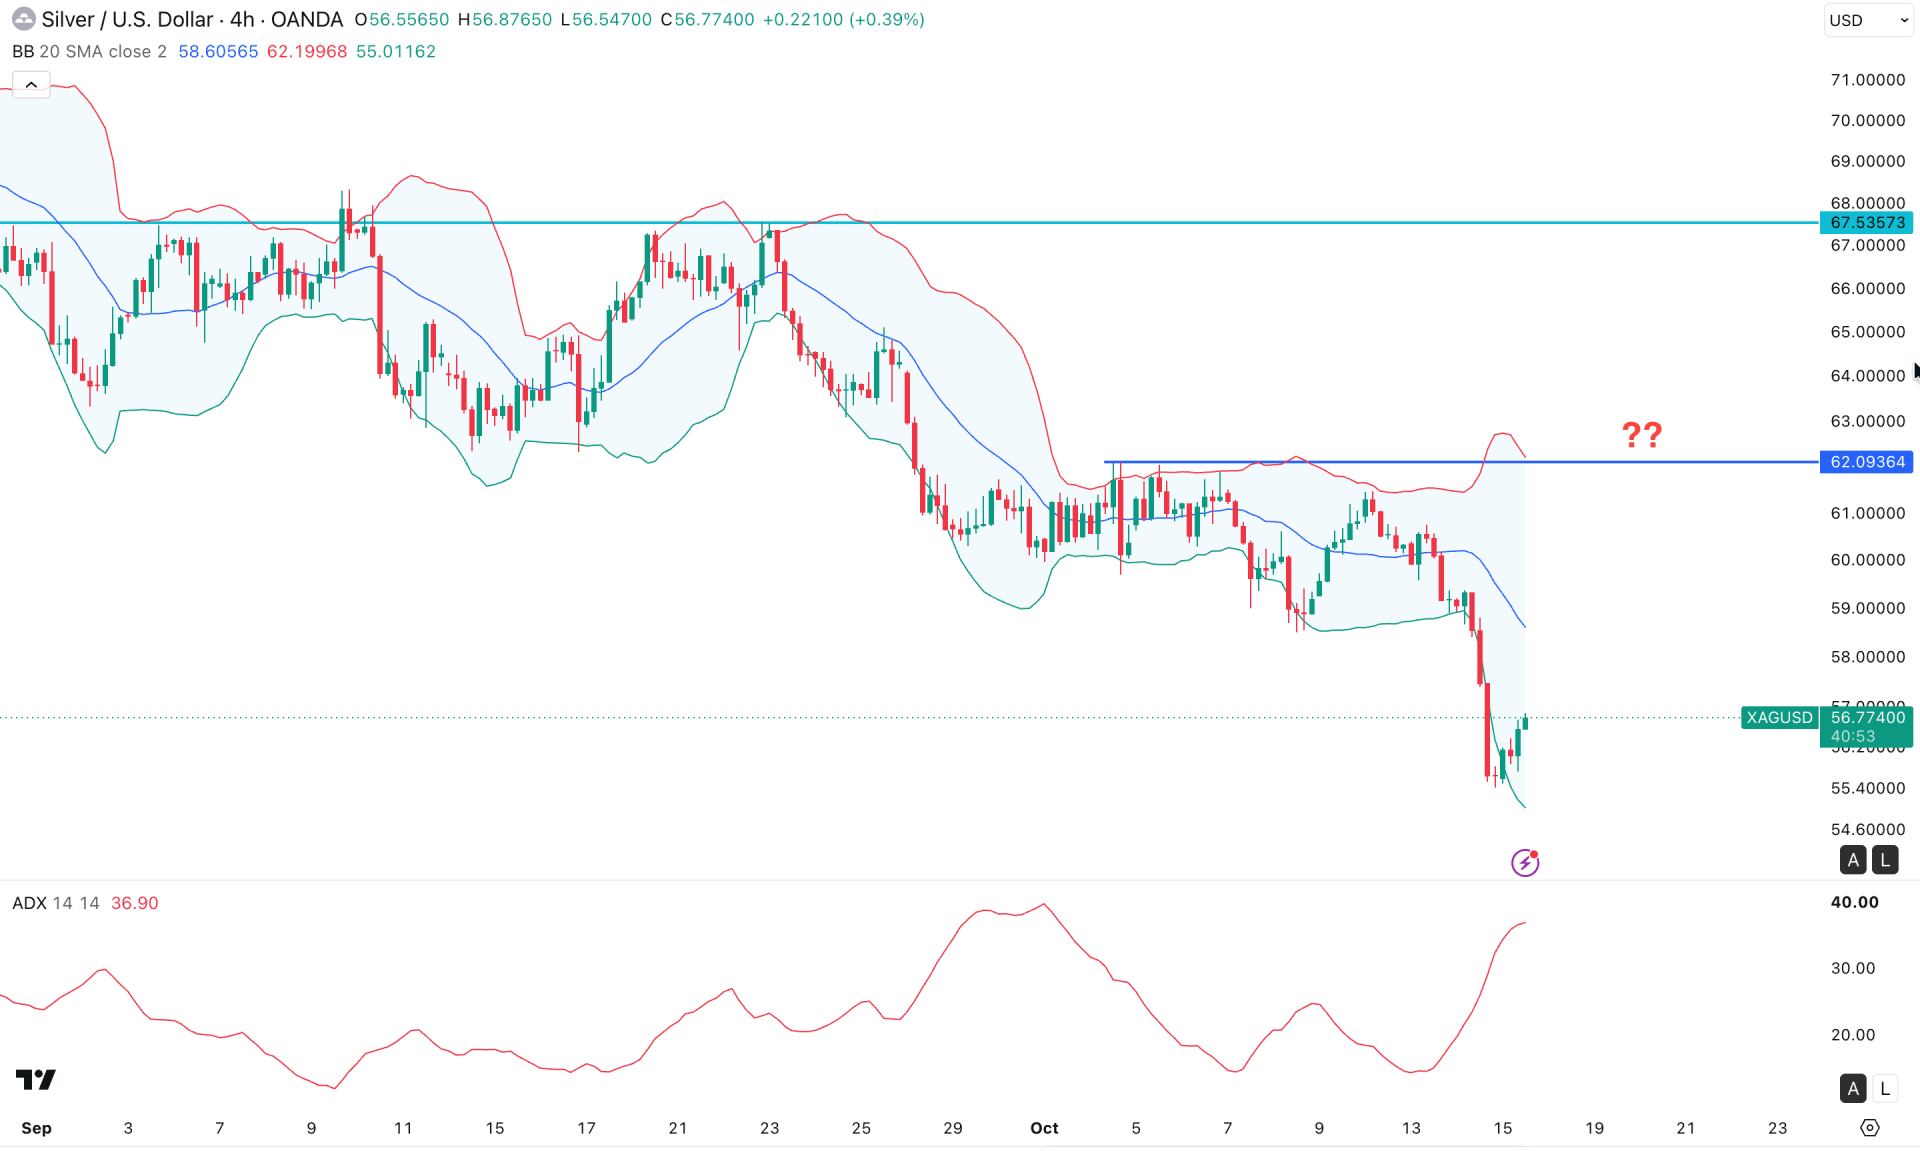
On the XAGUSD four-hour timeframe, a trend continuation is visible, with the most recent price trading within a bearish impulsive wave. Moreover, selling pressure has emerged in a sideways market, signaling a drop-base-drop formation.
In the main price chart, a bearish overextension is visible below the lower Bollinger band line, which limited downside pressure and led to a minor recovery. Yet, the price is still trading below the mid Bollinger band line, signaling pressure on buyers.
The Average Directional Index is above the 30.00 line and has started to flatten. However, we may consider the market trend as stable as long as the ADX remains above the 20.00 level.
Based on this market structure, a bullish correction is highly possible as the price has overextended from the equilibrium point. The immediate resistance to watch is the mid Bollinger band line, which could be tested around 58.60.
However, the ultimate resistance level in this bearish structure is 62.09, the top of the existing range-bound market. Breaking above this line could increase the chance of testing the 67.53 resistance level before a bullish breakout.
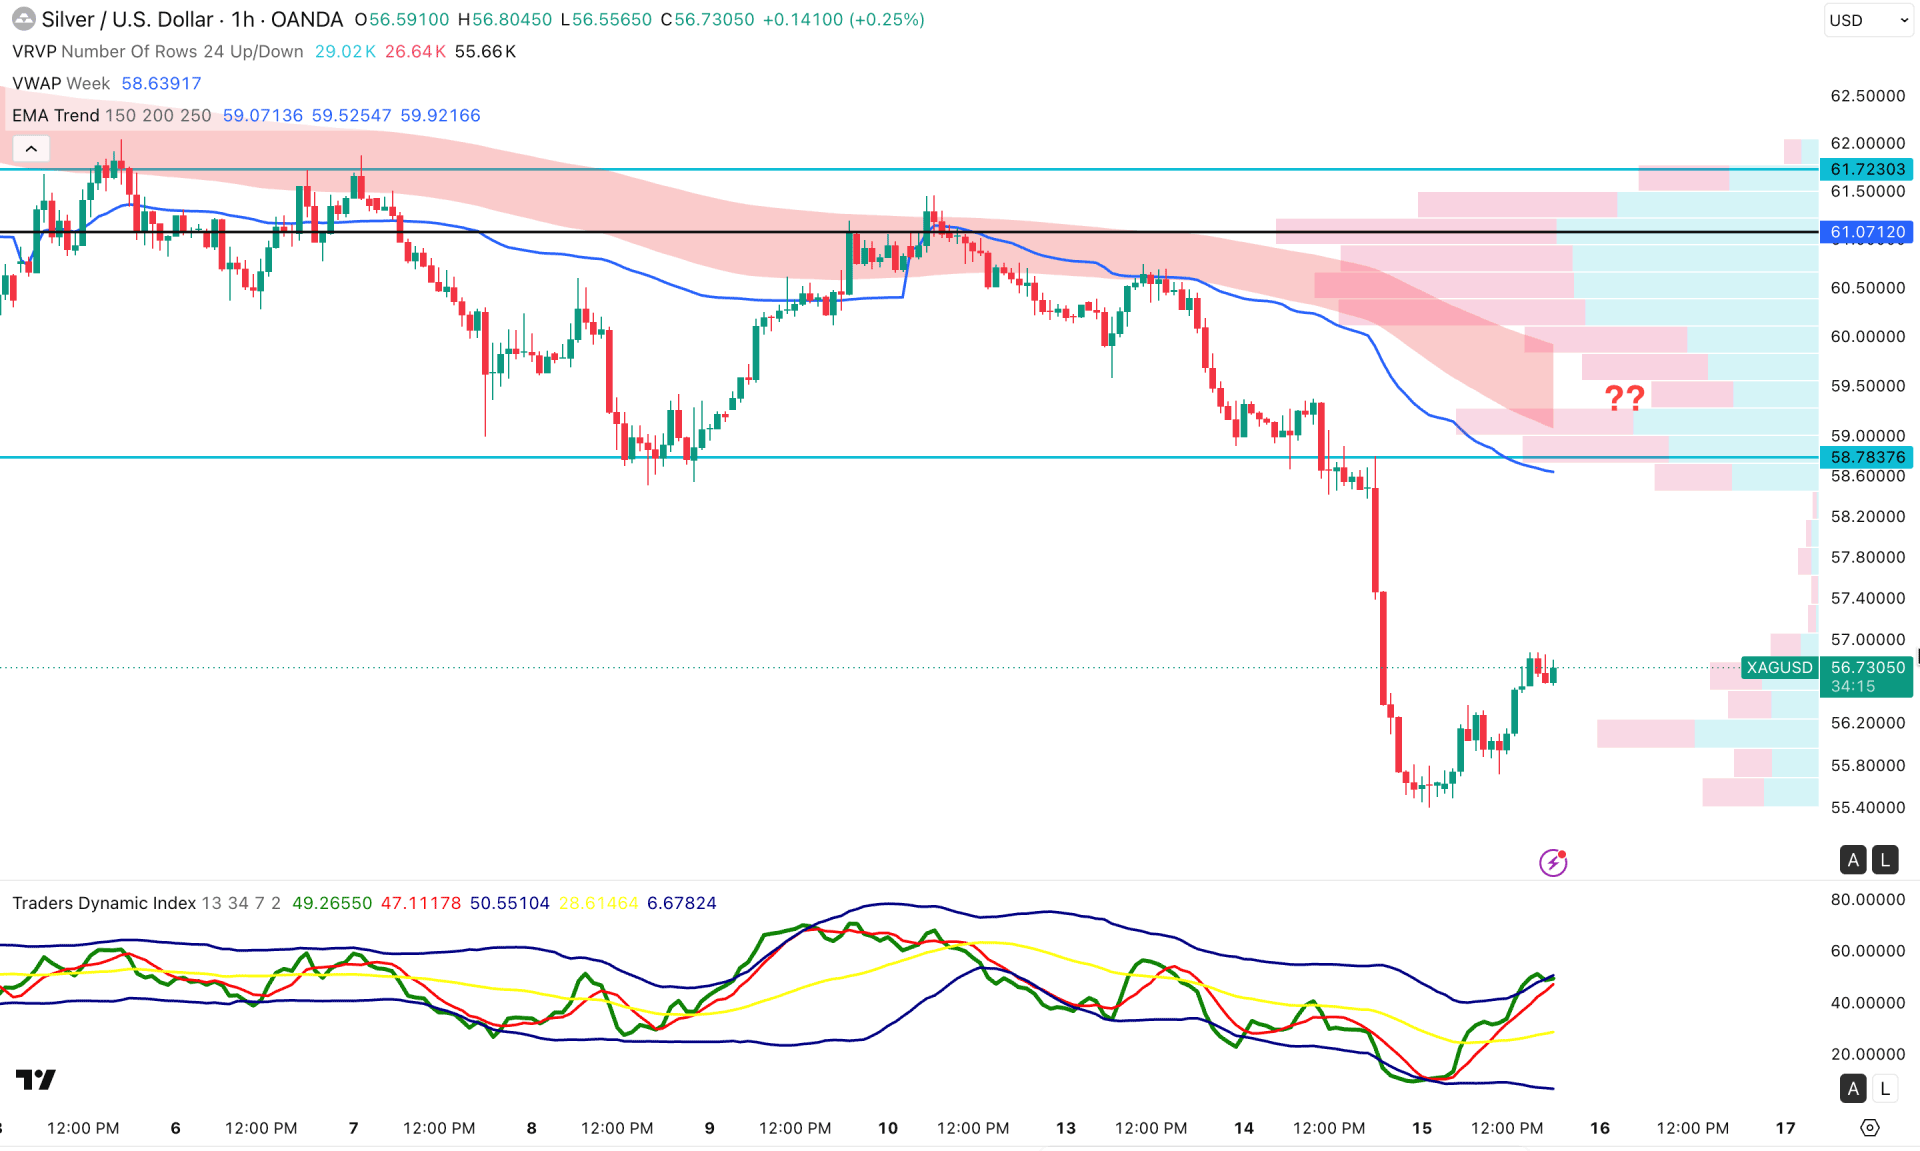
On the hourly chart, XAGUSD is trading in bearish continuation momentum. The gap between the current price and dynamic resistance levels has widened. The weekly VWAP level is above the current price and hovering near the pre-CPI area. Moreover, the EMA wave sits above the entire structure and is acting as major resistance.
The indicator window shows bullish price action as the Traders Dynamic Index has been above the 50.00 level for three trading days.
Based on this market structure, a minor bullish correction is pending, but downside pressure remains valid as long as price stays below the 58.78 resistance level.
Based on the overall market outlook, XAGUSD is trading within a bearish structure, with the most recent price overextended to the downside and reaching a crucial support area. As price still holds buying pressure at support, a bullish recovery with a bottom formation could be the first sign of a rebound. On the other hand, a bearish continuation with downside pressure below the key support level can resume the existing trend at any time.


