Published: January 20th, 2026
Due to robust demand for safe havens amid heightened caution in the broader market, precious metals markets have risen significantly, reaching fresh all-time highs.
Early this week, tensions between the United States and Europe escalated over President Trump's push to seize control of Greenland, which sent global financial markets plummeting and heightened investor and trader fear. After shaking the foundations of the EU and NATO alliance and promising additional tariffs tied to his Greenland goals, Trump's participation this week at the World Economic Forum in Davos is expected to be dramatic.
The European Union's response — the group is in negotiations to impose retaliatory tariffs on 93 billion euros' worth of U.S. goods — will have a significant impact on market outlook. However, Friedrich Merz, the head of Germany, stated on Monday that the country is less inclined to use the countermeasure due to its increased reliance on exports. The impending U.S. The Supreme Court decision on some of Trump's previous tariffs, which might be issued as soon as today, is also becoming increasingly significant amid tensions.
As a significant sell-off in Japanese bonds spilled over into international debt markets, U.S. Treasury yields rose to the highest level in over 4 months, further bolstering the appeal of gold and silver as safe havens. With the U.S. 30-year yield jumping 9 basis points to 4.93% and the 10-year yield rising 7 basis points to 4.287%, reaching their highest levels since September 3, longer maturities led to losses.
The decline in Japanese bond yields and the escalating hostilities between Europe and the United States are causing traders and investors to respond. Rates on Japan's 40-year debt surged above 4%, the highest level ever, amid concerns about the country's budgetary outlook.
Let's see the full outlook of Silver from the XAGUSD price analysis:
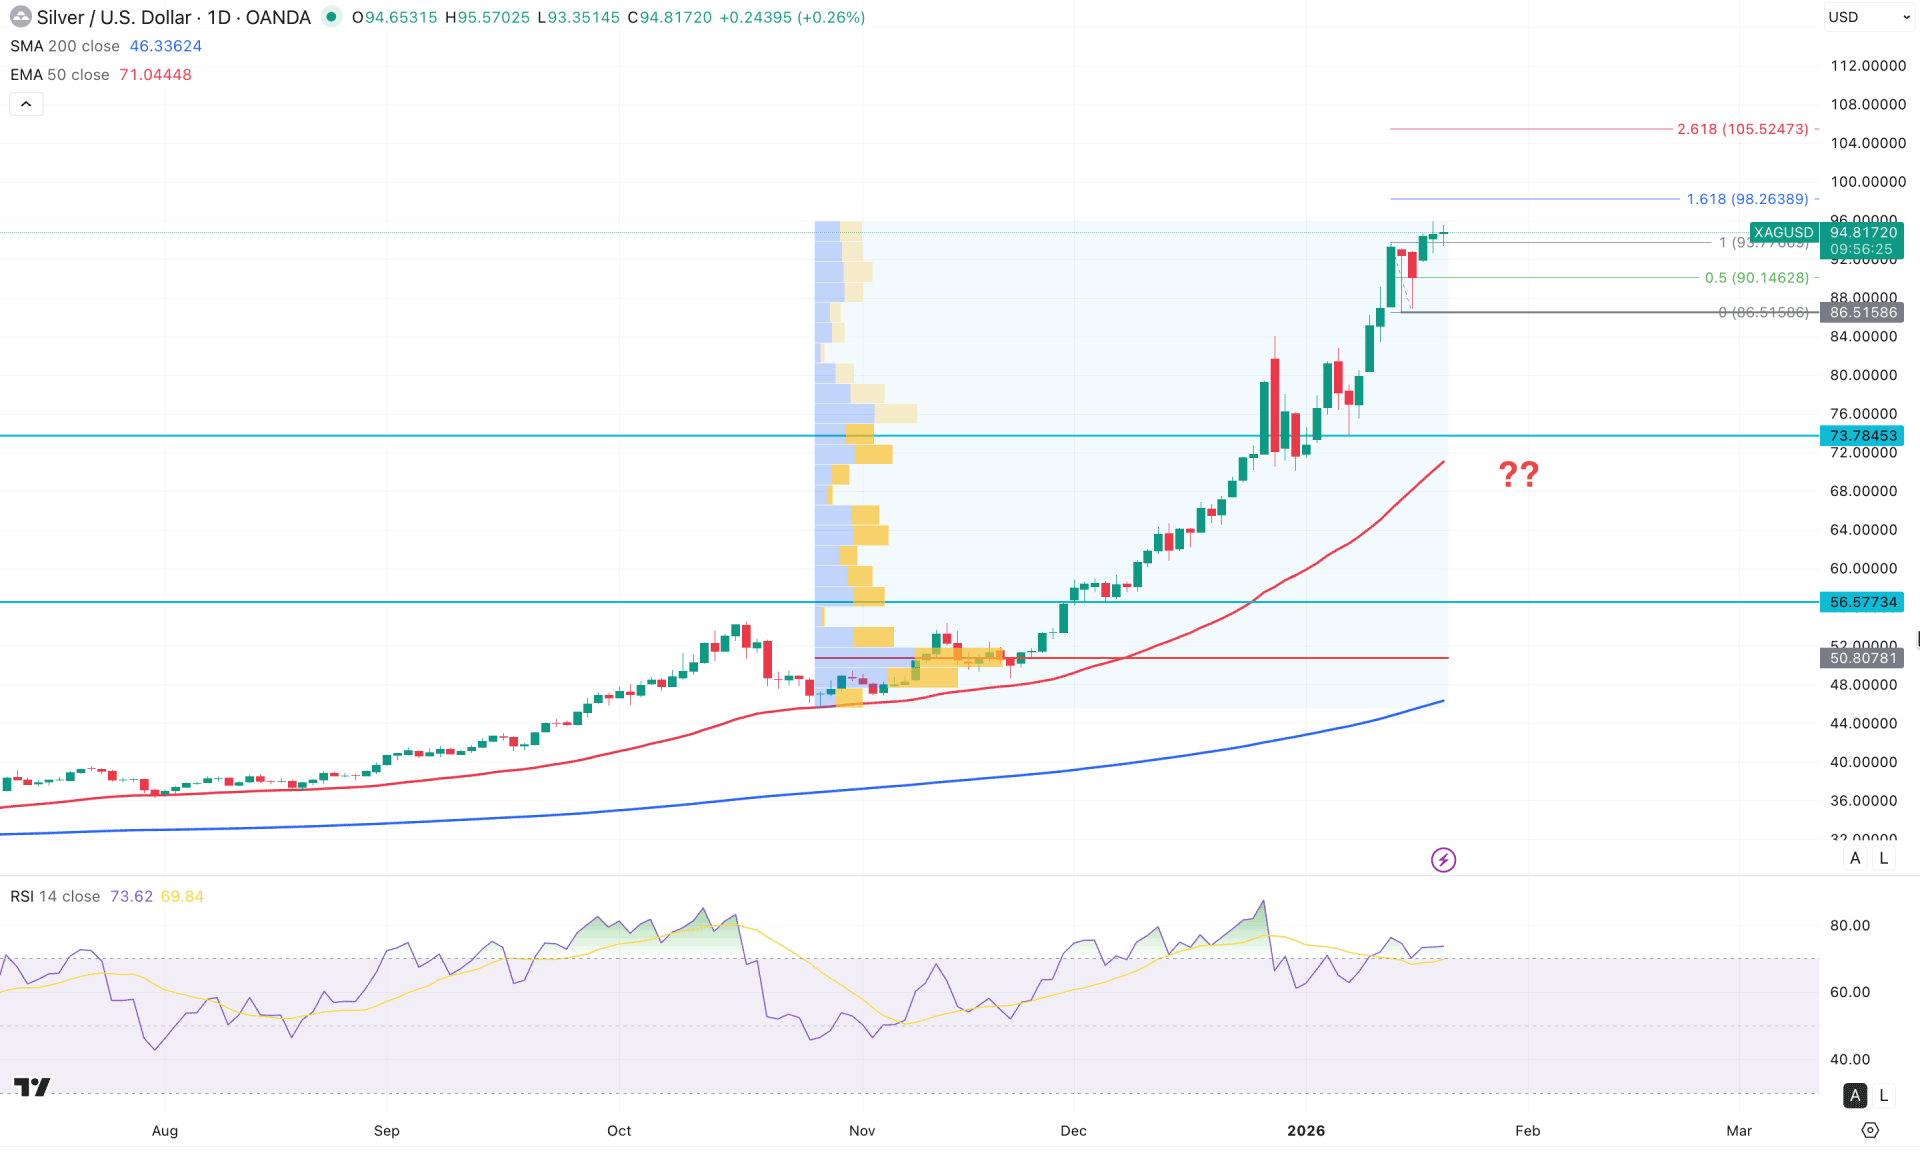
On the daily chart of XAGUSD, strong impulsive bullish momentum is visible, with prices continuing to rise following a strong fundamental catalyst. However, the extended price action near the upper peak area could offer a potential bearish correction opportunity at any time.
Looking at the higher timeframes, nine consecutive bullish candles on the monthly chart signal strong underlying bullish momentum. The weekly chart supports this view, as a recent bullish inside-bar breakout with a weekly close above 84.15 suggests further upside pressure.
From a volume perspective, the recent rally following the November 2025 breakout occurred without any significant volume expansion. This suggests a pending downside correction driven by profit-taking. Although investors experienced extended volatility at the beginning of 2026, the price has left little room for sellers, holding firmly above the 73.78 support level.
On the main chart, the 200-day Simple Moving Average is below the 50.80 high-volume level, signaling a dominant bullish trend. However, the widening gap between the current price and the 200-day SMA suggests a potential mean-reversion-driven correction. The widening gap between prices and dynamic support levels points to a healthy corrective opportunity.
Additionally, the 50-day Exponential Moving Average maintains a bullish slope just below the 73.78 support level. As the price has become significantly overextended above the 50-day EMA, a downside correction remains possible.
In the secondary indicator window, the Relative Strength Index (RSI) has remained above the 70.00 overbought level for two consecutive months. This reflects extreme bullish conditions, with a potential divergence forming near the top.
Overall, Silver is trading within a bullish trend, making it challenging for investors to initiate additional long positions without a meaningful correction. However, further upside remains possible as long as prices hold above the 88.51 level. In that scenario, the immediate upside target is 98.26, followed by a psychological move toward the 100.00 level.
On the other hand, a bullish attempt toward the 98.26 level, followed by a sharp rejection below the 90.14 level, could signal a short-term reversal, targeting the 80.00 area.
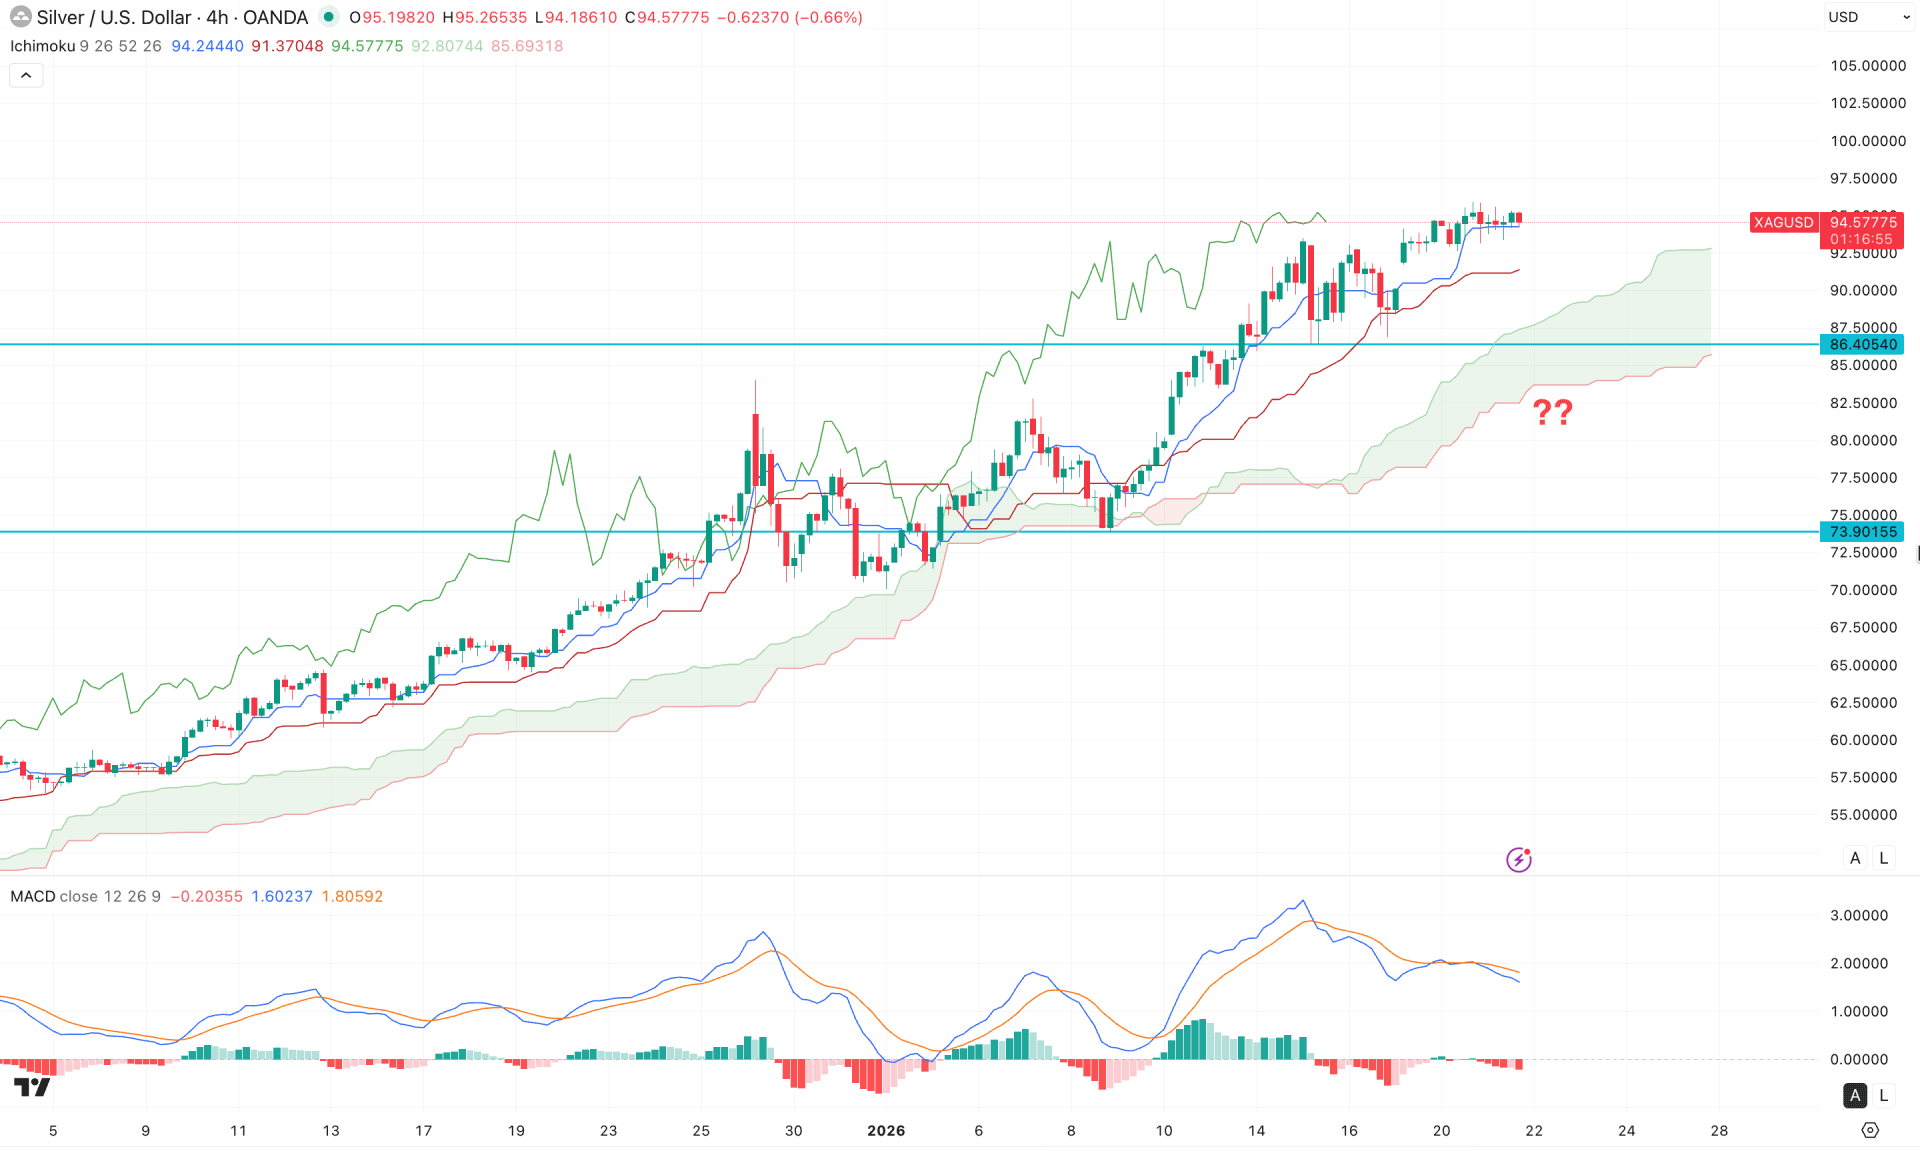
On the four-hour timeframe, the recent price action shows stable momentum above the Ichimoku Cloud, indicating further upside potential. Additionally, the future cloud appears favorable for buyers, as both leading spans are trending higher with a strong separation.
In the indicator window, the MACD signal line previously peaked near the 3.00 level before moving sideways. Meanwhile, the histogram has flipped to the bearish side, creating a short-term challenge for buyers.
Based on the four-hour market structure, price action has entered a consolidation phase near the top, where a range breakout remains possible. The immediate support level to monitor is the Kijun Sen line. A minor pullback followed by a bullish recovery from the 91.84–90.77 zone could present a potential long opportunity. In that scenario, price action may increase the probability of testing the 100.00 psychological level.
On the other hand, strong corrective pressure near the top, accompanied by an immediate four-hour close below the 86.40 level, could pose a significant challenge for buyers. In such a case, price could initiate a deeper correction toward the 73.90 key support level.
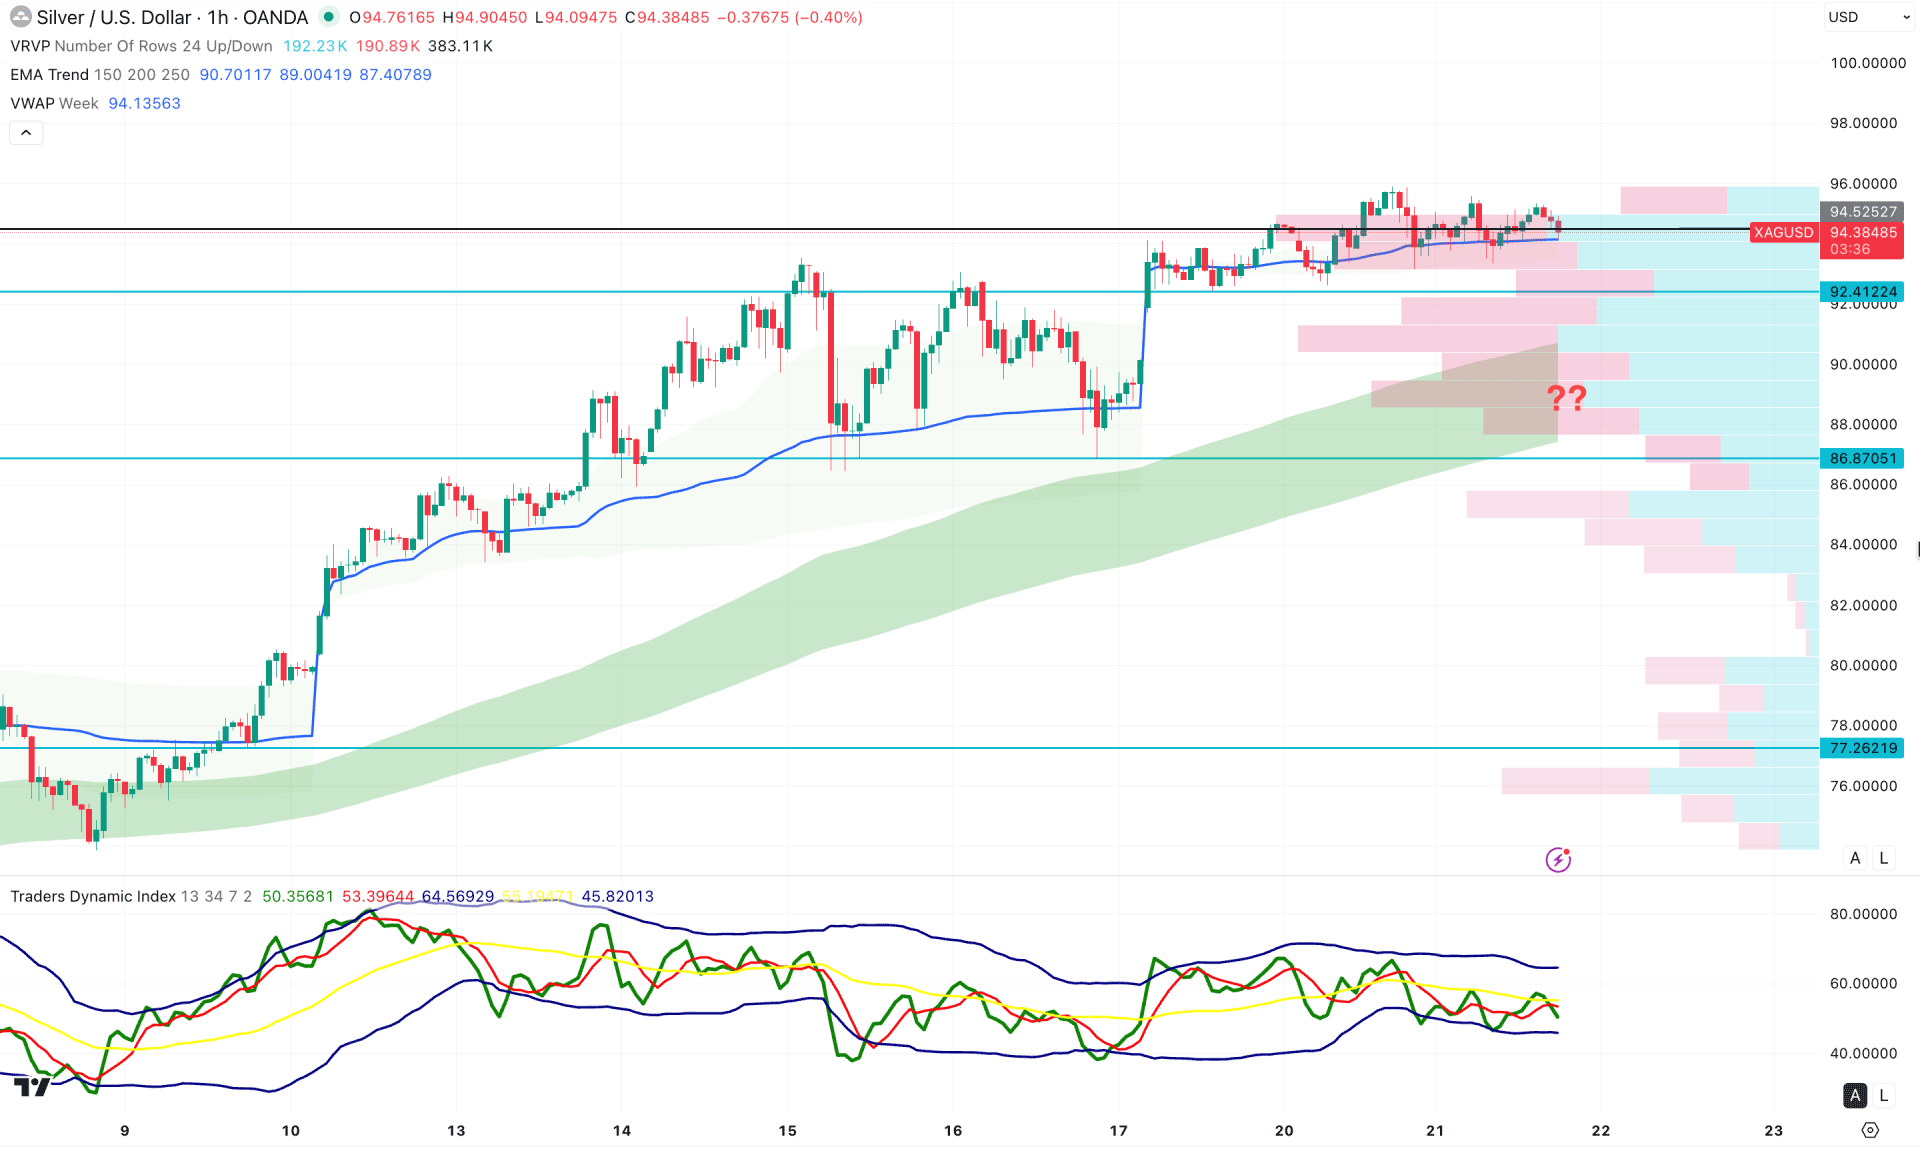
On the hourly timeframe, the current price is trading within a volatile market structure, with a high-volume node positioned near the top. The weekly VWAP level serves as the immediate support, followed by a bullish exponential moving average wave.
In the indicator window, the Traders Dynamic Index (TDI) shows increasing selling pressure below the 50.00 neutral line, increasing the probability of a move toward the lower peak level.
Based on the hourly market structure, the recent rebound near the top, combined with sideways momentum, signals a potential downside correction in the coming hours.
Investors should closely monitor how the price reacts around the 92.40 support level, as a break below this area could drive the price toward the 86.87 support zone.
On the other hand, a bullish reversal candlestick forming at the weekly VWAP line could resume the prevailing trend and push the price above the 98.00 level.
Overall, silver is trading in an extremely bullish condition on the higher timeframes, from which a corrective move remains possible. Investors should closely monitor price action to identify potential short opportunities from reliable resistance zones. However, the ongoing impulsive buying pressure may require confirmation from the daily chart before signaling a broader trend reversal.


