
Published: July 17th, 2025
Despite the bullish technical outlook, XAGUSD is currently trading about 3.43% lower than its highs achieved earlier this week.
According to the CPI/PPI announcements released throughout this week, inflation in the US remains significantly higher than the current 2% target. Silver prices are very well supported, particularly in light of the lingering uncertainties about a possible tariff-side inflation.
Markets typically anticipate two interest rate reductions by the Fed before the end of the year, despite opinions remaining fairly divided. This helps support higher silver prices.
The idea of reduced US interest rates favours non-yielding investments, such as precious metals, as evidenced by the recent increase in the prices of gold and silver, even though this may not compete with other major central banks in 2025. The same applies to gold and silver, both of which are valued in US dollars.
To better predict the Fed's next probable move, markets will continue to monitor financial data announcements and Fed rhetoric closely. According to CME FedWatch, there is currently a 54.3% chance that the first American rate cut will occur at the September session.
Trump has been a strong advocate for lower rates throughout his political career. Therefore, it is not surprising that his current demand to cut rates by more than 100 basis points has not been fulfilled. There are still rumours that Trump may fire Powell.
However, as concerns persist over the Federal Reserve's independence from its own governing body, reducing hostilities between the two has helped stabilise the market, causing a decline in the XAGUSD.
Let's see the further outlook for this instrument from the XAGUSD technical analysis:
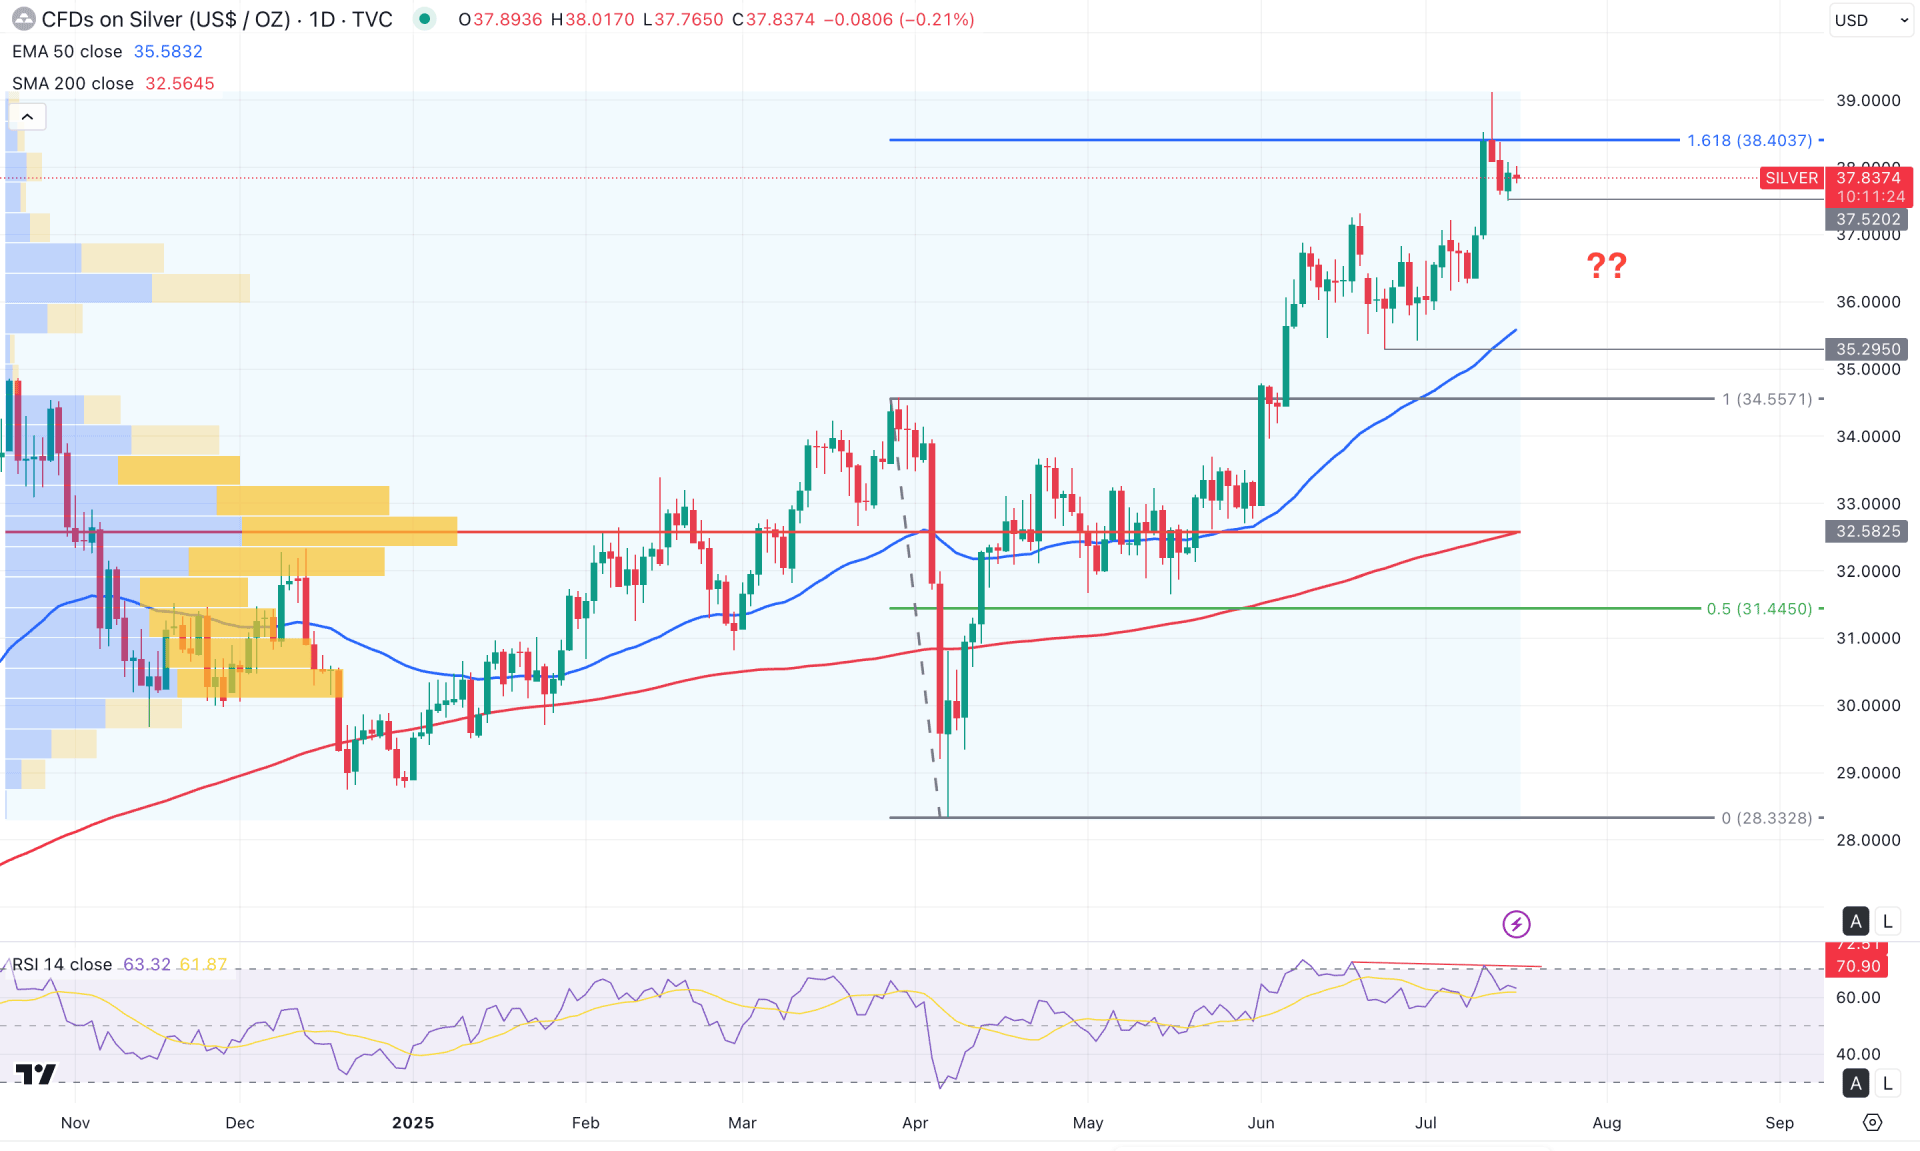
In the daily chart of Silver (XAGUSD), the recent price shows extended bullish pressure, reaching a peak at the major high. Moreover, the most recent range breakout indicates bullish exhaustion near the 161.6% Fibonacci extension level, from where buying pressure has become overstretched. Although the broader market momentum remains bullish, a significant corrective pullback may be due.
In the higher timeframe, bullish momentum remains present, as evidenced by the rally following the inside bar breakout at the 34.55 level. However, the weekly price is consolidating within the existing bullish channel. Investors should monitor how the price behaves around the 36.90 flip level. A break below this key support could invalidate the current bullish momentum and trigger a broader correction.
In terms of volume, while the significant market bias remains bullish, a correction is pending. The high-volume level, as indicated by the volume profile, highlights the most active area since October 2024 at the 32.58 level – approximately 13% below the current price. This suggests that, although the overall trend remains bullish, a potential correction could occur as a mean reversion.
On the main price chart, the 200-day SMA and the 50-day EMA are both positioned below the current price, indicating a strong bullish trend. However, the widening gap between the current price and these dynamic support levels may signal a potential top formation. Still, before confirming a bearish reversal, investors should wait for confirmation from key oscillators.
Looking at the indicator window, the Relative Strength Index (RSI) recently peaked at the 70.00 level and formed a bearish divergence. Following the bearish Shooting Star candlestick at the 39.11 high, the RSI has retreated below the 70.00 line, signalling fading bullish momentum.
Based on the broader market outlook and the divergence in the RSI, a bearish correction is possible. A confirmed daily candle close below the 37.52 level could increase downside pressure, targeting the 35.29–35.50 zone. However, a significant market reversal would require a stable move below the 50-day EMA, followed by a period of consolidation.
On the other hand, a bullish rebound is possible from the 36.00–34.55 demand zone. A strong bullish reversal from this area, with a stable price above the 50-day EMA, could offer a trend continuation opportunity toward the 39.00 resistance level.
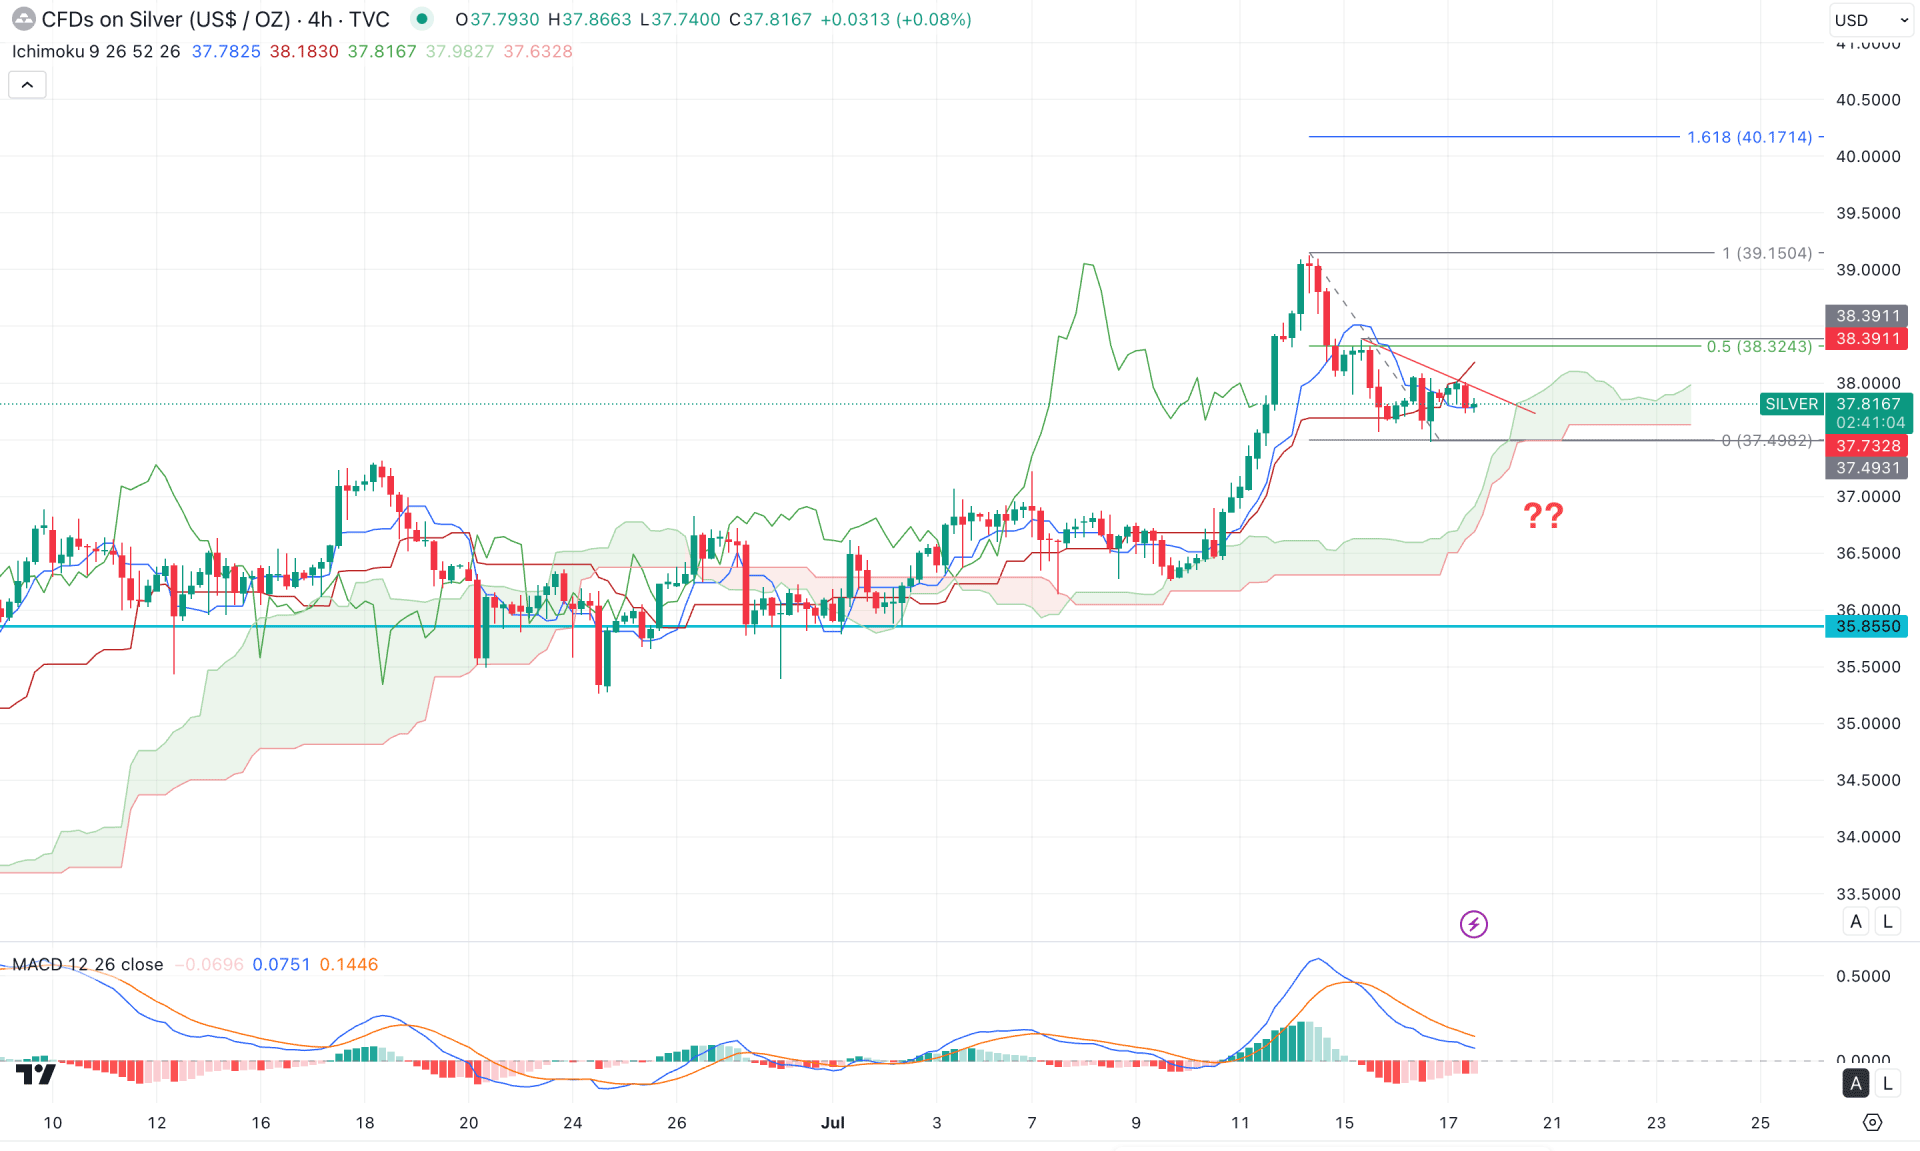
In the 4-hour timeframe, the current price action is moving sideways after finding a peak at the 39.15 level. Although the broader market momentum remains above the Kumo cloud, mixed market sentiment is visible from dynamic price behaviour.
In the future cloud, the Senkou Span B remains flat, indicating sideways momentum from a medium-term perspective. However, the Senkou Span A remains above Span B, indicating a bullish slope and ongoing buying pressure. Additionally, the price is currently trading within a descending triangle pattern, signalling potential liquidity buildup.
In the secondary indicator window, the MACD signal line has made a crossover near the peak area. The histogram has remained below the neutral line for an extended period, although no clear swing low has formed yet. This suggests that downside momentum may continue unless a bullish reversal appears.
Based on the broader market outlook, a bullish rebound confirmed by a 4-hour candle close above the 38.39 level could offer a bullish trading opportunity, especially after a valid trendline breakout. In that scenario, the initial target would be the 39.00 psychological level, followed by the 40.17 Fibonacci extension level.
On the bearish side, failure to hold the price above the 37.49 support level could pose a challenge for bulls, as it would confirm a breakdown below the descending trendline. In that case, the price is likely to return to the broader consolidation zone and test the 35.85 support level before initiating another bullish attempt.
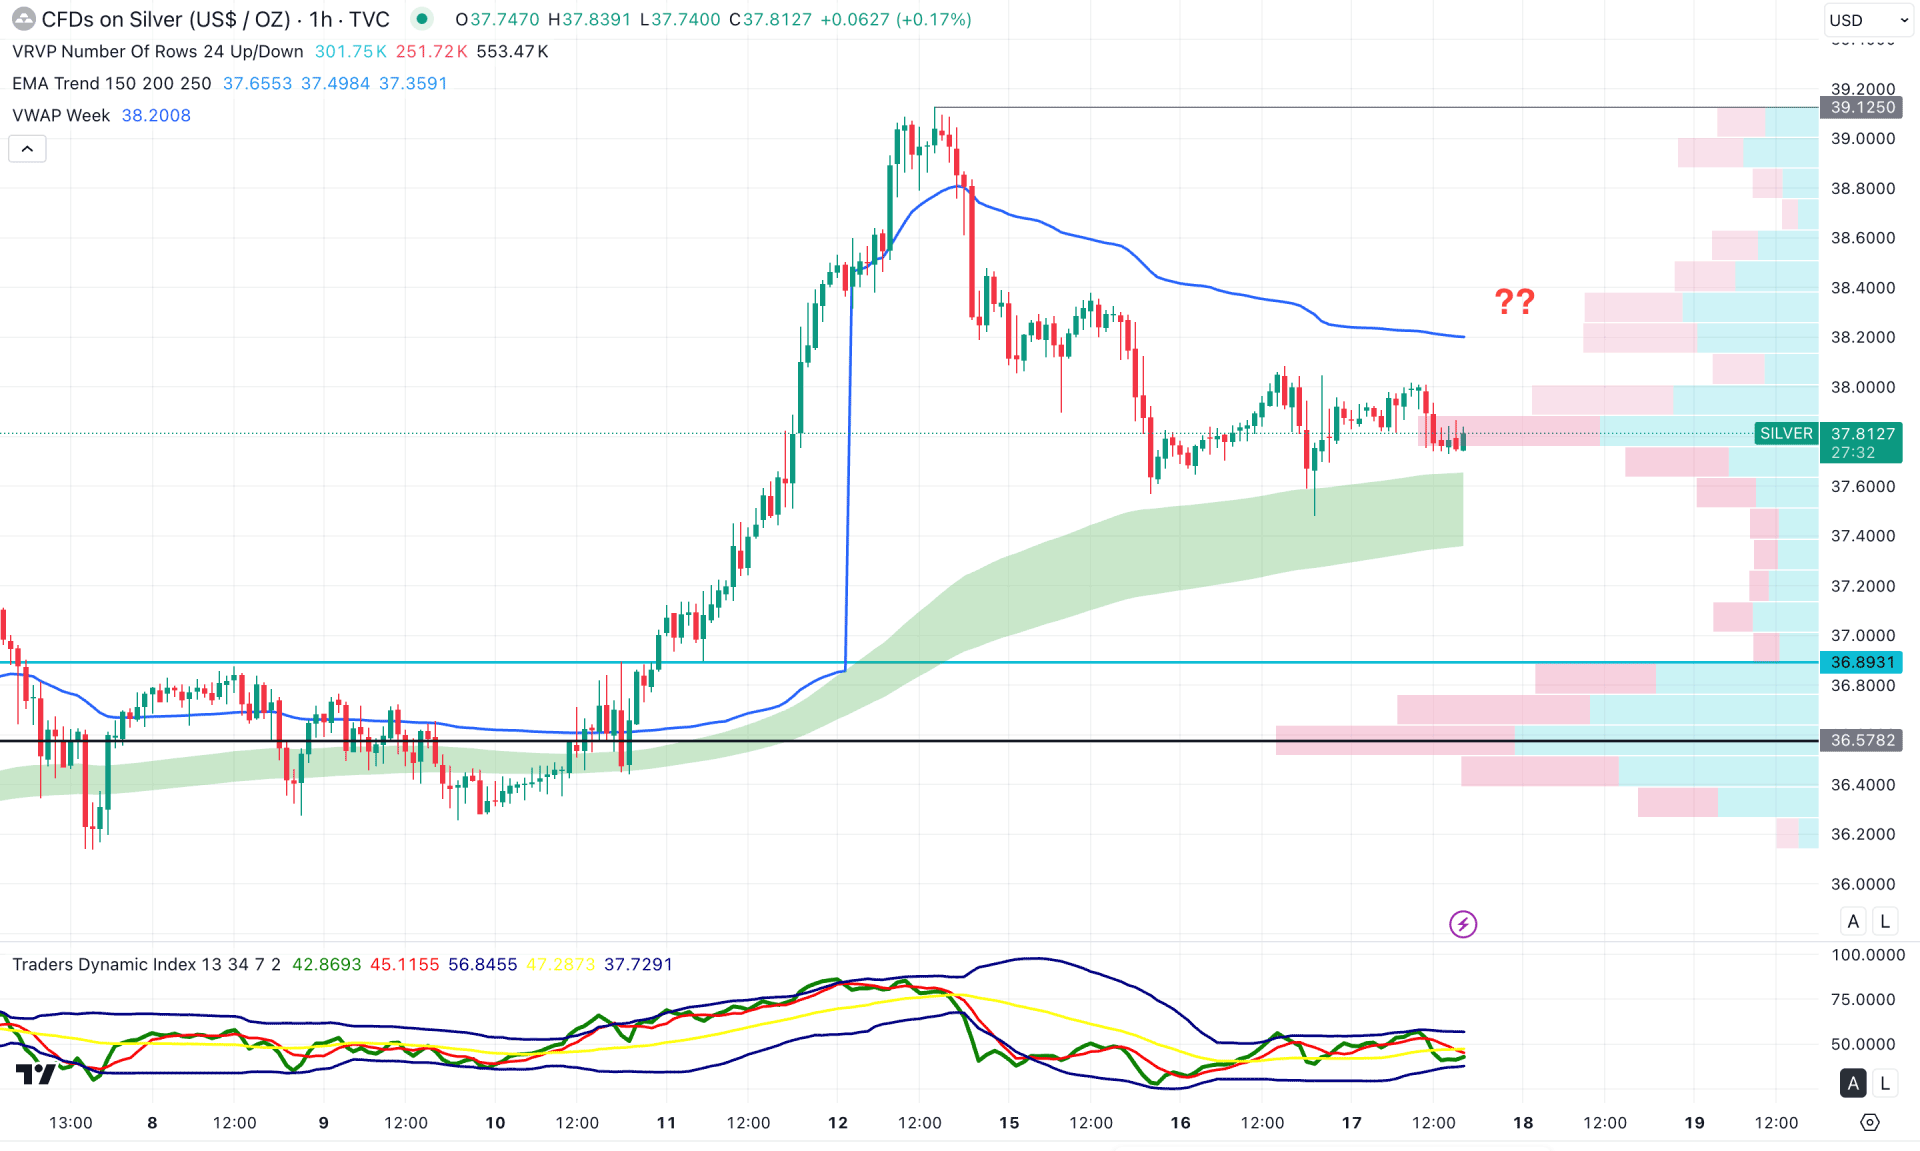
In the early timeframe, the price is trading under bearish pressure, as multiple lower lows have formed below the weekly VWAP level. However, the high volume line and the moving average wave still remain below the current price, acting as a barrier to sellers.
In the secondary indicator window, the Traders Dynamic Index has formed a bearish breakout and is moving sideways below the 50.00 midline. This signals active selling pressure in the market, which may lead to an extended bearish trend.
Based on the broader market outlook, investors might expect the downside pressure to continue as long as the VWAP level holds and the price remains within the consolidation below the moving average zone. This could indicate order buildup before a potential drop toward the 36.89 support level.
On the other hand, a bullish rebound with a stable price above the value area (VA) level could offer a long opportunity, targeting the 39.00 resistance area.
Based on the current multi-timeframe analysis, XAGUSD has reached a peak from which a considerable downside correction is pending. Investors should closely monitor how the price trades at the daily range; a bearish break could be a bearish opportunity.


