Published: May 23rd, 2024
Silver and gold prices recently fell substantially due to corrective pullbacks and profit-taking following recent gains. Furthermore, several gold and silver futures investors were compelled to liquidate their holdings.
A Wall Street Journal article predominantly attributed the gold rally of recent months to purchases by central banks, particularly China. According to the report, global central banks are diversifying away from assets denominated in U.S. dollars, which are more susceptible to sanctions. The economic sanctions imposed by the United States on Russia in retaliation for its invasion of Ukraine have functioned as a deterrent for nations such as China, which may encounter similar sanctions from the United States.
The performance of U.S. stock indexes, the VIX index, which measures market volatility and is presently extremely low on the CBOE, suggests that investors have little cause for concern. Low VIX levels have frequently preceded market corrections, pushing the silver price down.
Silver continued pushing down as investors reevaluated their anticipations of interest rate cuts in response to hawkish Federal Reserve signals. According to the minutes of the most recent Federal Reserve meeting, policymakers are still determining when they can be certain that inflation is approaching the 2% target for an extended period of time.
This is consistent with recent remarks made by Federal Reserve officials who advised exercising prudence in light of data indicating a decline in inflation in the United States. An increase in interest rates diminishes the allure of gold and silver, whereas escalating price pressures augment its merits as a safeguard against inflation.
Let's see the further aspect of this instrument from the XAGUSD technical analysis:
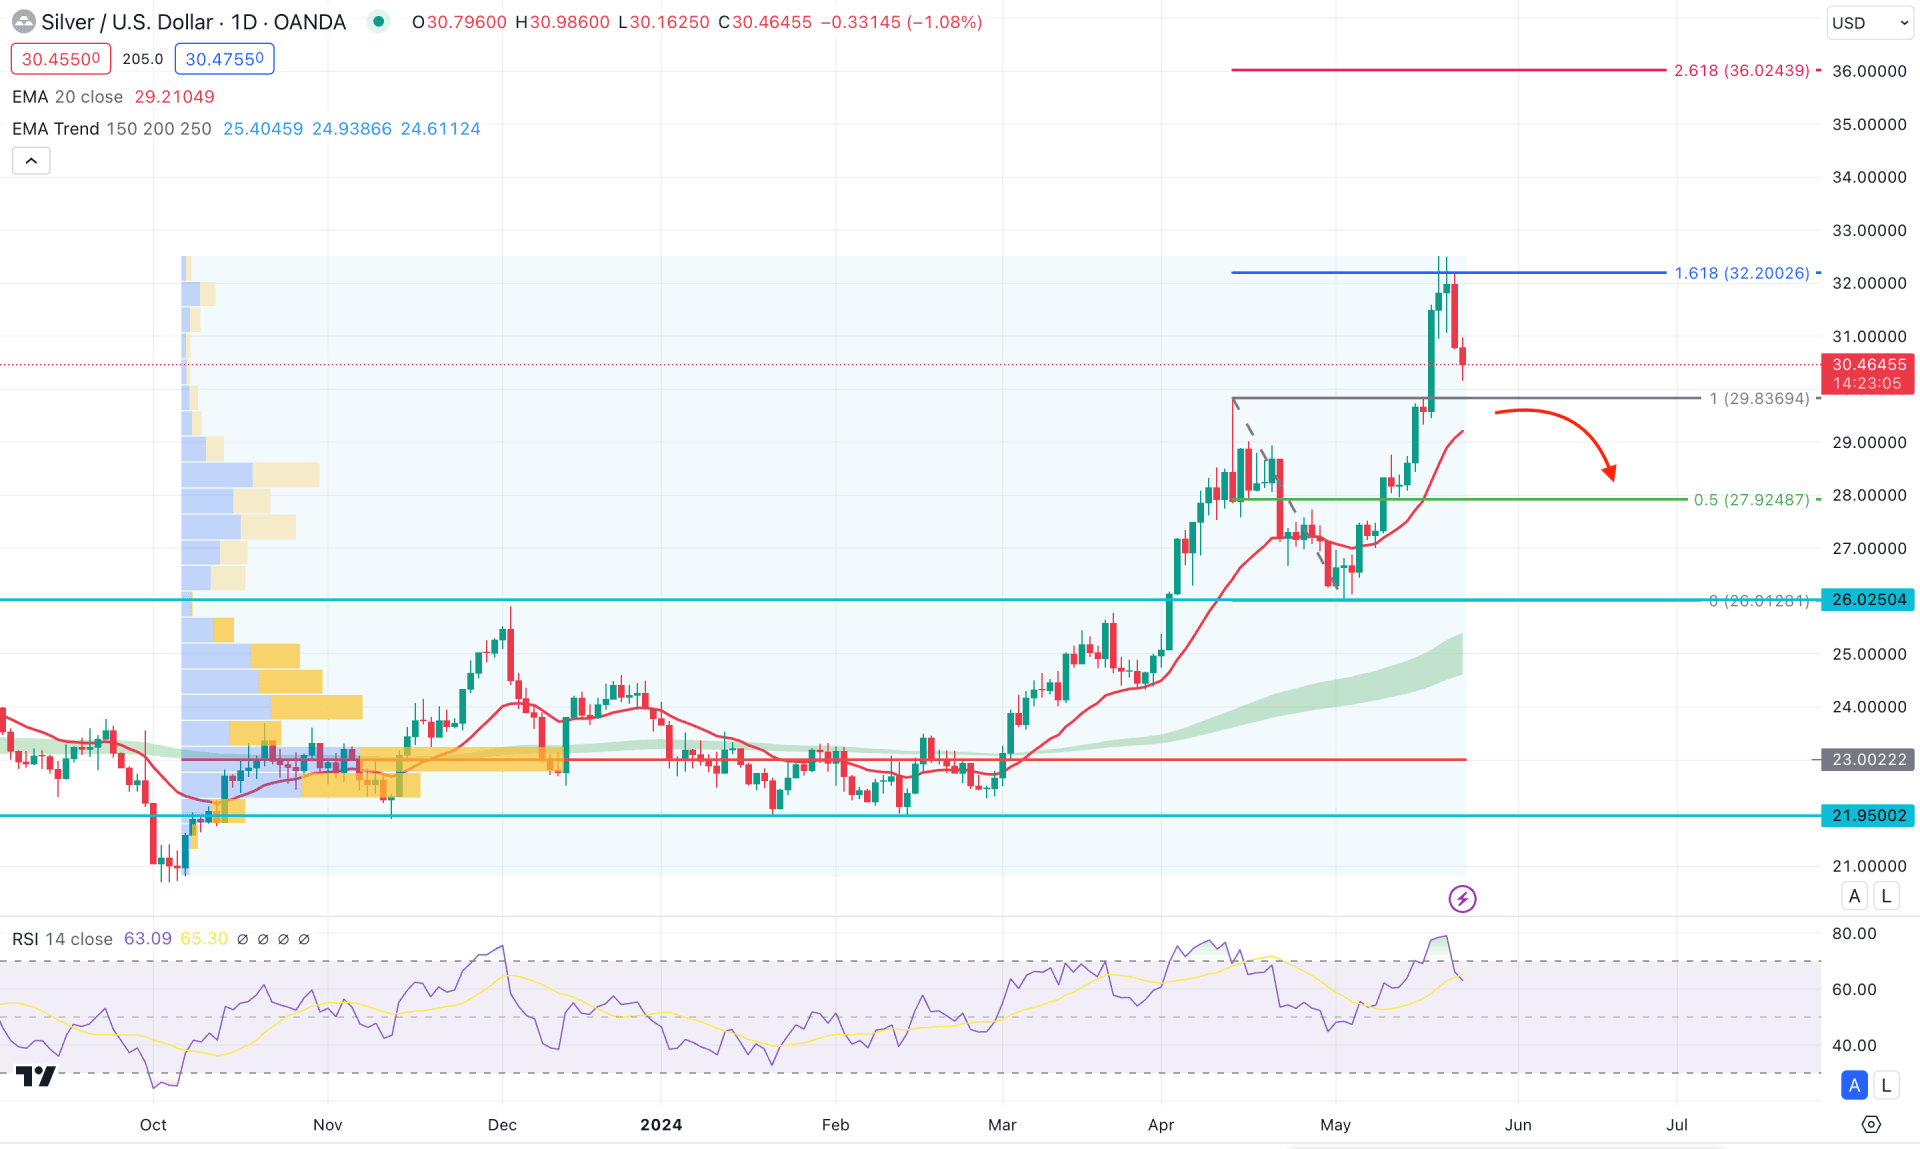
In the daily chart of XAGUSD, the broader market direction is bullish, with the most recent price trades at a multi-year high. Therefore, the bullish trend is valid, where a sufficient downside correction is pending as a mean reversion.
In the volume structure, the bullish trend is solid as the current price hovers above the 23.00 high volume level. However, the recent price has expanded from the high volume line, suggesting a possible downside correction as a mean reversion.
The current monthly candle suggests an ongoing buying pressure from a range breakout, where the recent weekly candle trades bearish after finding a peak. In that case, a minor swing low formation and a rebound is needed before anticipating the trend continuation.
Looking at the daily chart, the EMA cloud consists of 150, 200, and 250 MA lines below the current price and working as a major support. Moreover, the dynamic 20-day Exponential Moving Average is below the current price and is working as a major support. Moreover, the recent swing high came with a valid swing low formation at the 26.02 level. As per the Fibonacci Extension indicator, the ongoing buying pressure found a peak at the 161.8% level, signaling a decent profit-taking possibility.
In the secondary indicator window, the 14 day RSI rebounded below the 70.00 level after finding a peak. In that case, we may expect the downside correction to extend, until the RSI reaches the 50.00 neutral level.
Based on the daily market outlook of XAGUSD, investors should closely monitor how the price trades at the 29.83 static support level. Any failure to break below this line with a bullish reversal candlestick could resume the existing trend above the 34.00 level.
On the other hand, the profit taking is on and a successful break below the 20 day EMA could lower the price towards the 26.02 key support level.
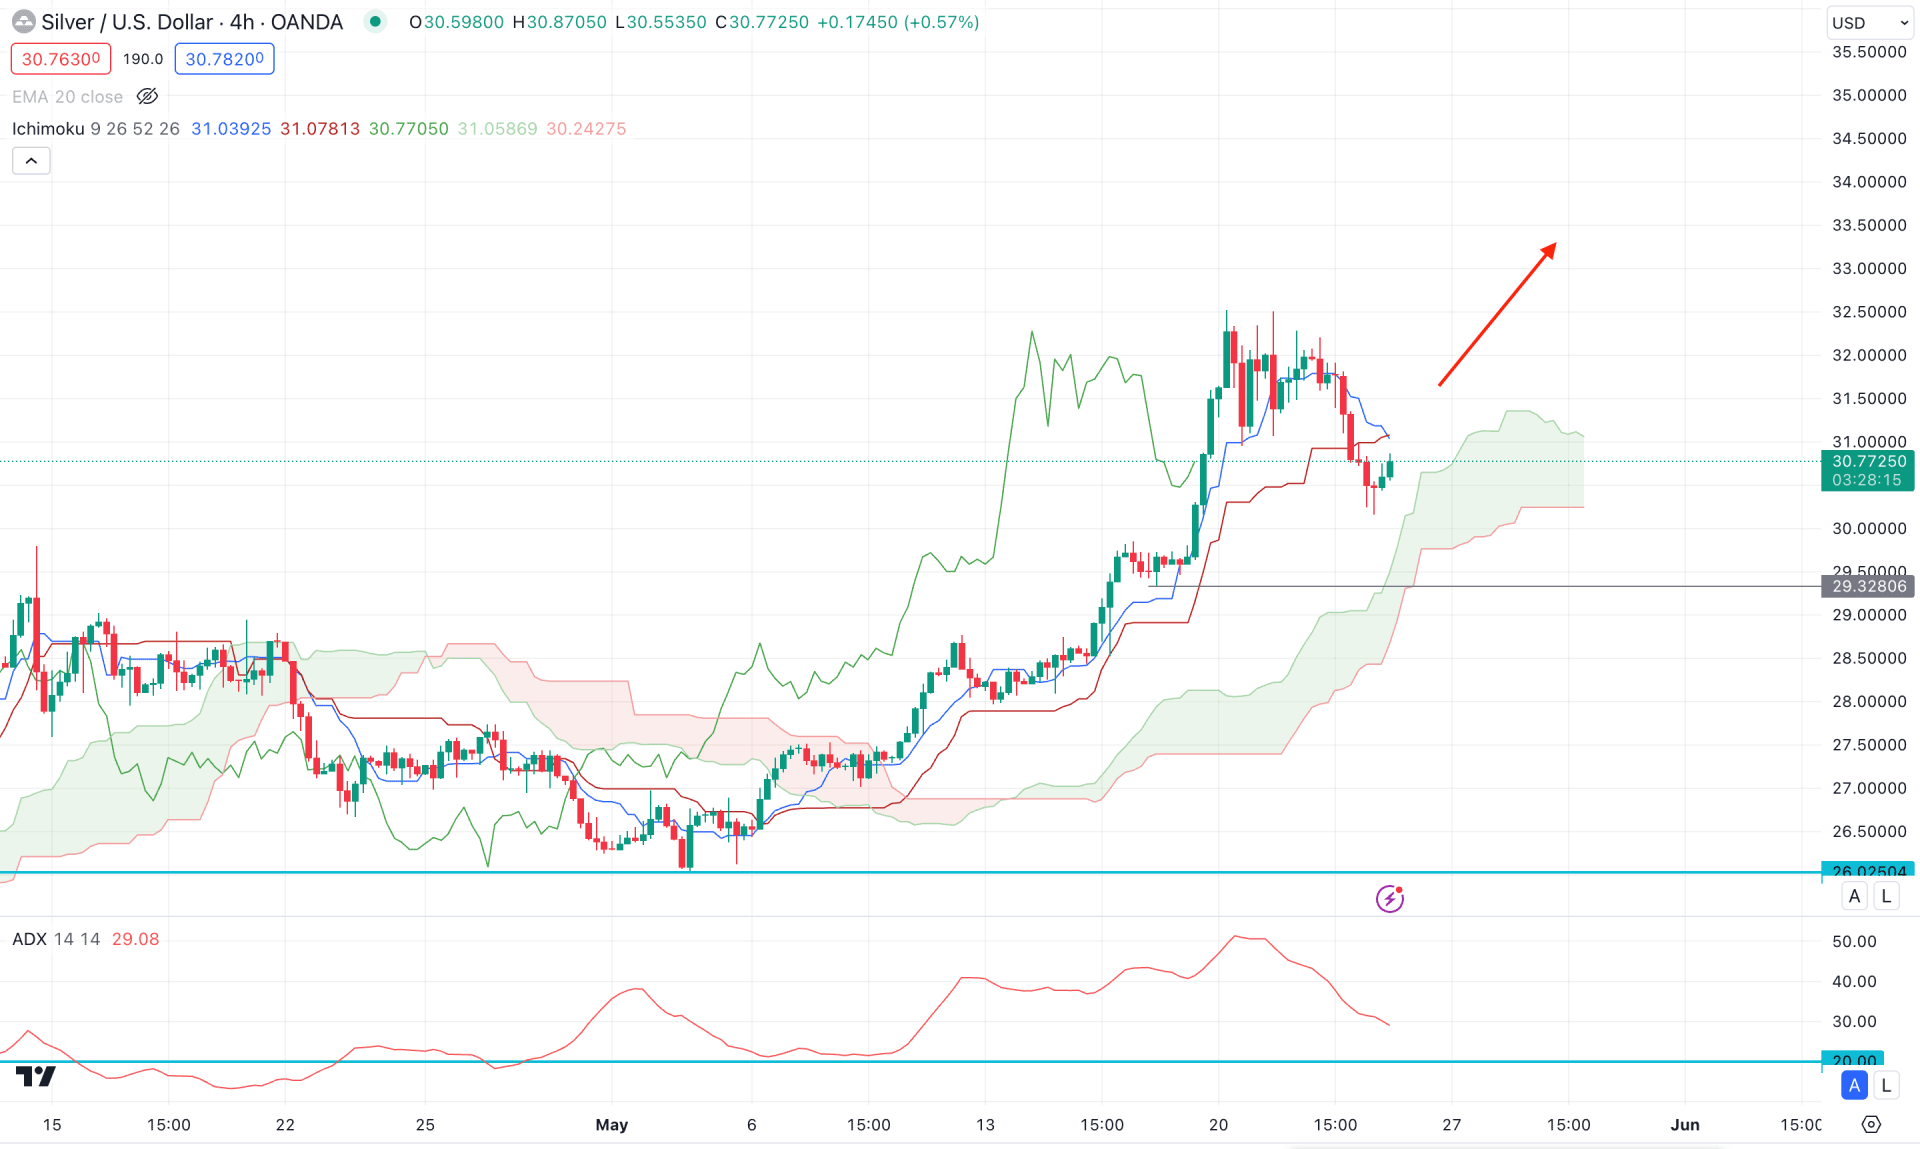
In the H4 timeframe, the recent price trades bearish above the dynamic Ichimoku Cloud zone, which suggests a pending action from bulls will resume the trend. Moreover, the Senkou Span A and Senkou Span B are flat, signaling an active bullish trend.
In the secondary window, the Average Directional Index (ADX) reached the 50.00 peak and aimed lower. However, the most recent reading is still above the 20.00 neutral point, from where a bullish rebound is possible.
Based on the H4 outlook, a bullish rebound with an H4 close above the dynamic Kijun Sen line could be a trend continuation opportunity, targeting the 34.50 level.
On the other hand, a prolonged selling pressure with a bearish break below the 29.32 level could signal a cloud breakout. In that case, the downside pressure might extend towards the 27.00 psychological line.
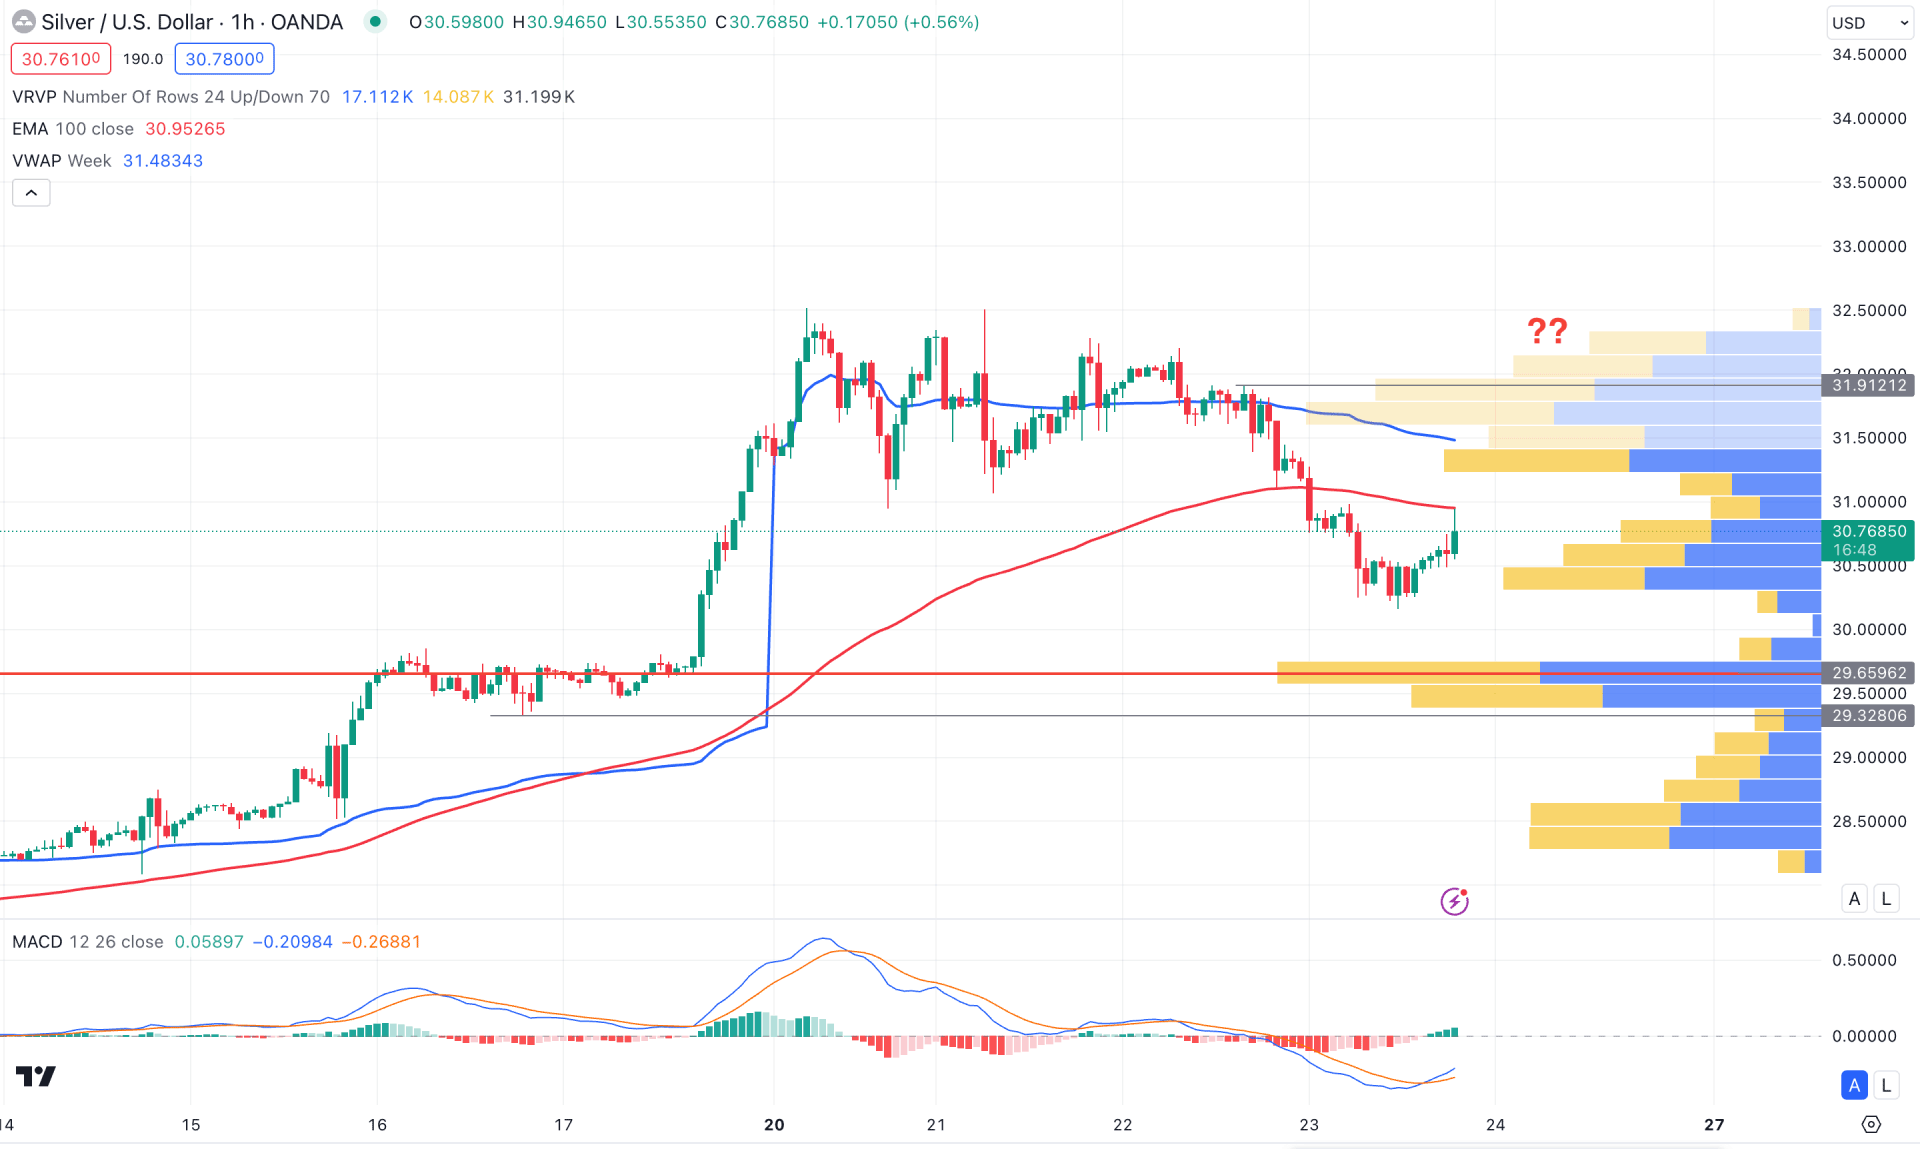
In the hourly time frame, the recent price trades below the 100 Exponential Moving line, suggesting an intraday selling pressure in the market. Moreover, the weekly VWAP is the immediate resistance from where the current price trades sideways.
In the broader structure, the visible range high volume level is at the 29.65 level, which is below the current price. Moreover, the MACD Histogram turned bullish, supported by the bullish crossover in the Signal line.
Based on this outlook, a bullish breakout with an hourly close above the 31.91 level could validate the bullish trend continuation, targeting the 34.50 level. However, as the current price trades below the dynamic VWAP resistance, any bearish rejection from this line could lower the price toward the 29.32 static support level.
Based on the current market outlook, an ongoing profit taking is visible in the XAGUSD price, where the intraday market needs a valid bullish breakout to resume the existing trend. However, no sufficient action from bulls can resume the existing downside pressure towards the 29.65 support line.


