Published: December 24th, 2024
XAGUSD (Silver) saw a strong recovery from a higher than three-month minimum of $28.75 following the announcement of the US Personal Consumption Expenditure Price Index (PCE) statistics for November, which revealed that price forces grew more slowly than anticipated.
Although it increased more slowly than forecasts of 2.9%, basic PCE inflation, the Fed's chosen inflation indicator, increased steadily by 2.8%. Uncertainty surrounds whether the Fed will pursue an insufficient rate-cut direction in 2025, as predicted by the Fed's dot plan from the December policy conference, as the main indicator and core PCE inflation rates increased by a meager 0.1% month over month.
According to the latest Fed dot plot, officials believe that by the close of 2025, Federal Funds rates will have risen to 3.9%.
Silver prices rose Monday as Fed policymakers advocate for smaller reductions in interest rates in the coming year. The yield on the 10-year US Treasury increased to almost 4.54%. Increased yields on interest-bearing securities typically have a negative impact on non-yielding resources, like silver, because they increase their opportunity expenses. The United States Dollar Index (DXY), which measures the value of the US dollar relative to six other major currencies, increased marginally to around 108.00.
In the face of a decrease in the disinflation pattern, better-than-expected job prospects, and uncertainty surrounding President-elect Donald Trump's arriving policies, a number of Fed officials supported an ineffective policy-easing view on Friday.
Let's see the upcoming price direction of Silver from the XAGUSD technical analysis:

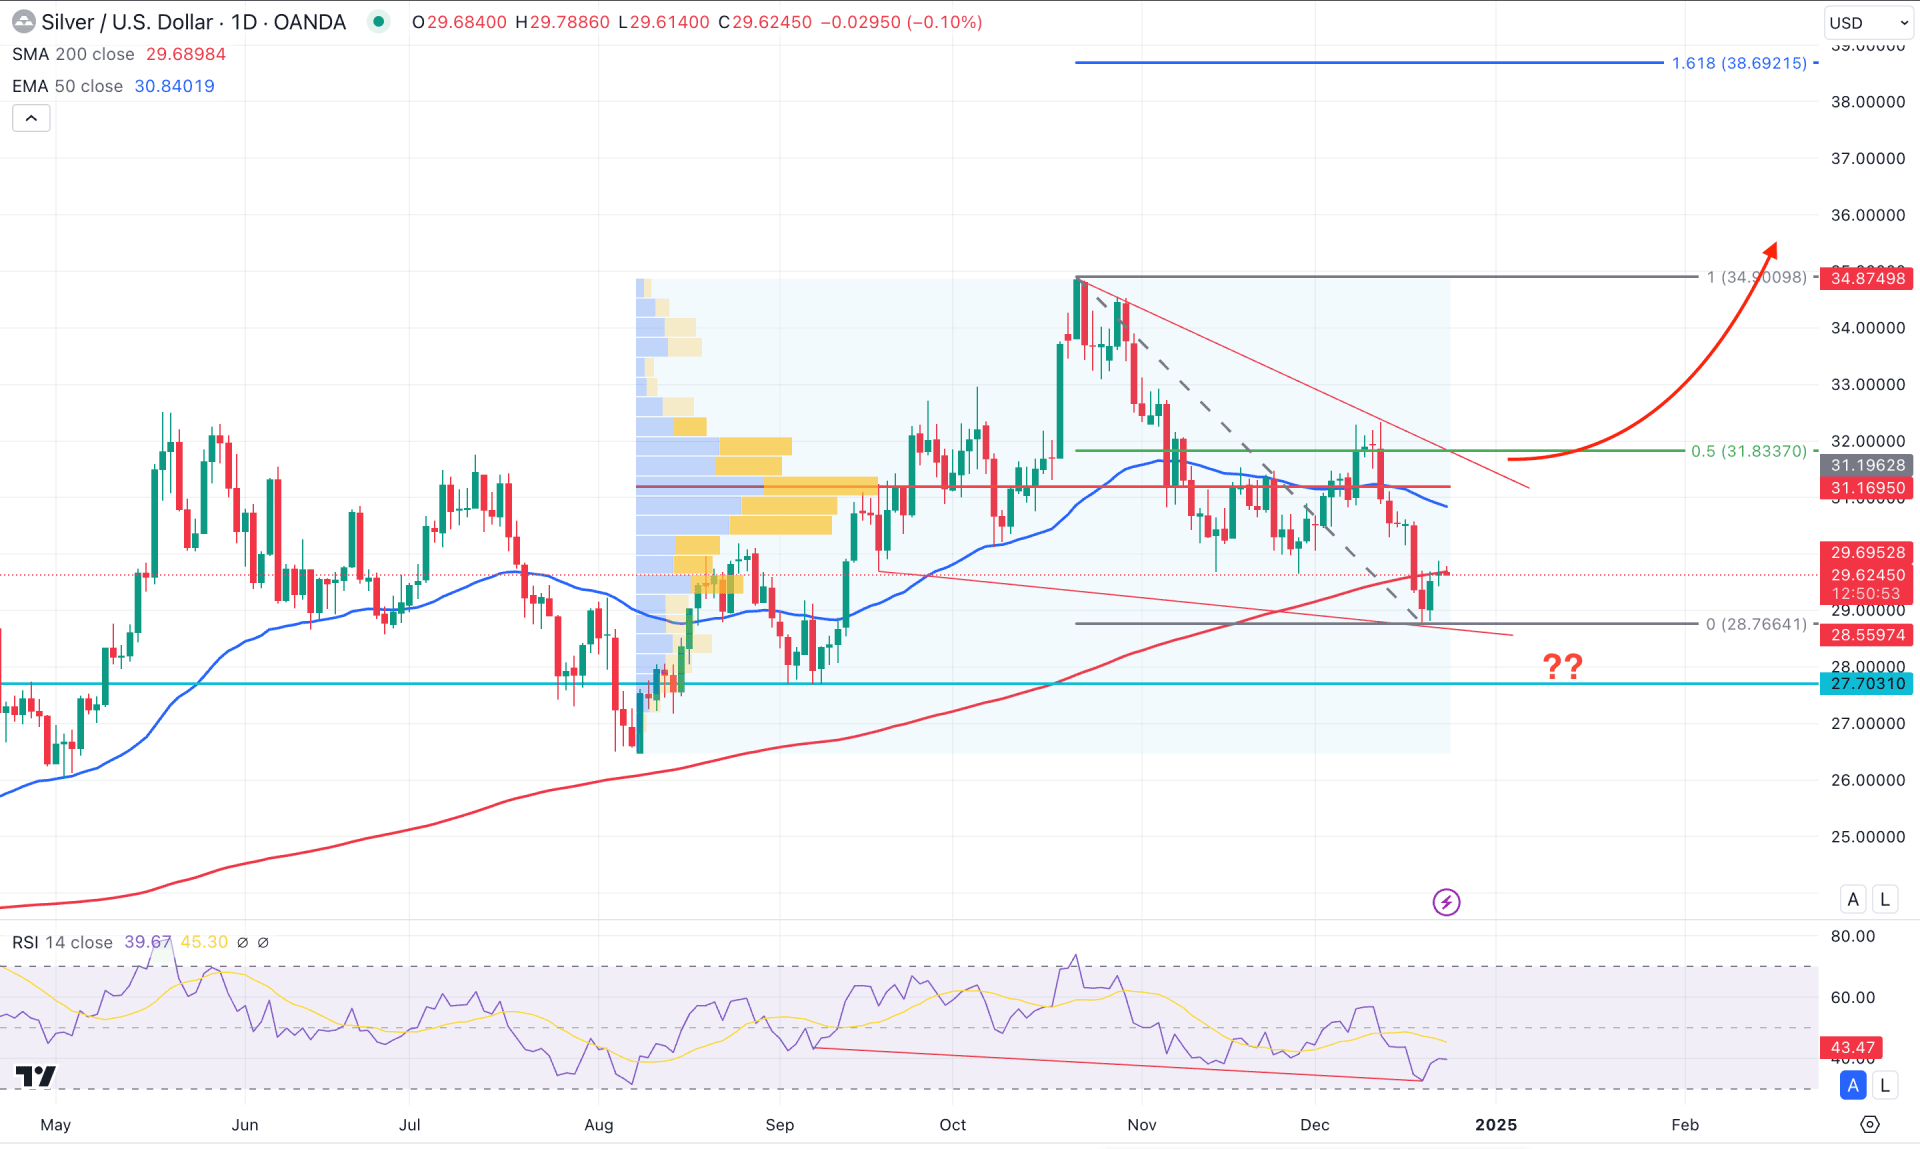
In the daily chart of Silver (XAGUSD), a corrective downside pressure has been visible since the October peak, suggesting potential profit-taking from the existing bull run. Primarily, the main aim for this pair is to look for long trades once a solid bottom is confirmed.
In the higher timeframe, the bullish possibility from the most recent bearish engulfing pattern in November is questionable. The current price is hovering below the November 2024 low, signaling a bearish continuation from the multi-year high price.
In the volume structure, the largest activity level since August 2024 is above the current price, working as a crucial resistance. As long as the current price hovers below this line, we may expect the bearish pressure to extend before pushing the upside.
In the main price chart, the ongoing corrective momentum is hovering within a falling wedge pattern from there, the latest daily candle is facing bullish pressure from the wedge support. However, a selling pressure is visible below the 200-day Simple Moving, which is also supported by the falling 50-day EMA line above the current price.
In the indicator window, the Relative Strength Index (RSI) has formed divergence as it overextended towards the 30.00 oversold zone, ignoring the main price swing.
Based on the daily outlook of XAGUSD, the wedge support is a crucial zone to look at. There is a possibility of having sufficient sell-side liquidity, which needs to liquidate before forming a price reversal. In that case, any bullish reversal from the 28.08 to 27.70 area with a recovery above the 50-day EMA could offer a decent long opportunity. In that case, the price is more likely to extend and find resistance from the 36.00 psychological line.
On the bearish side, ongoing selling pressure is present as the current price hovers below the dynamic 50-day EMA line. Extended selling pressure below the 27.70 low could be an alarming sign to bulls, as it might extend the loss toward the 25.00 psychological level.

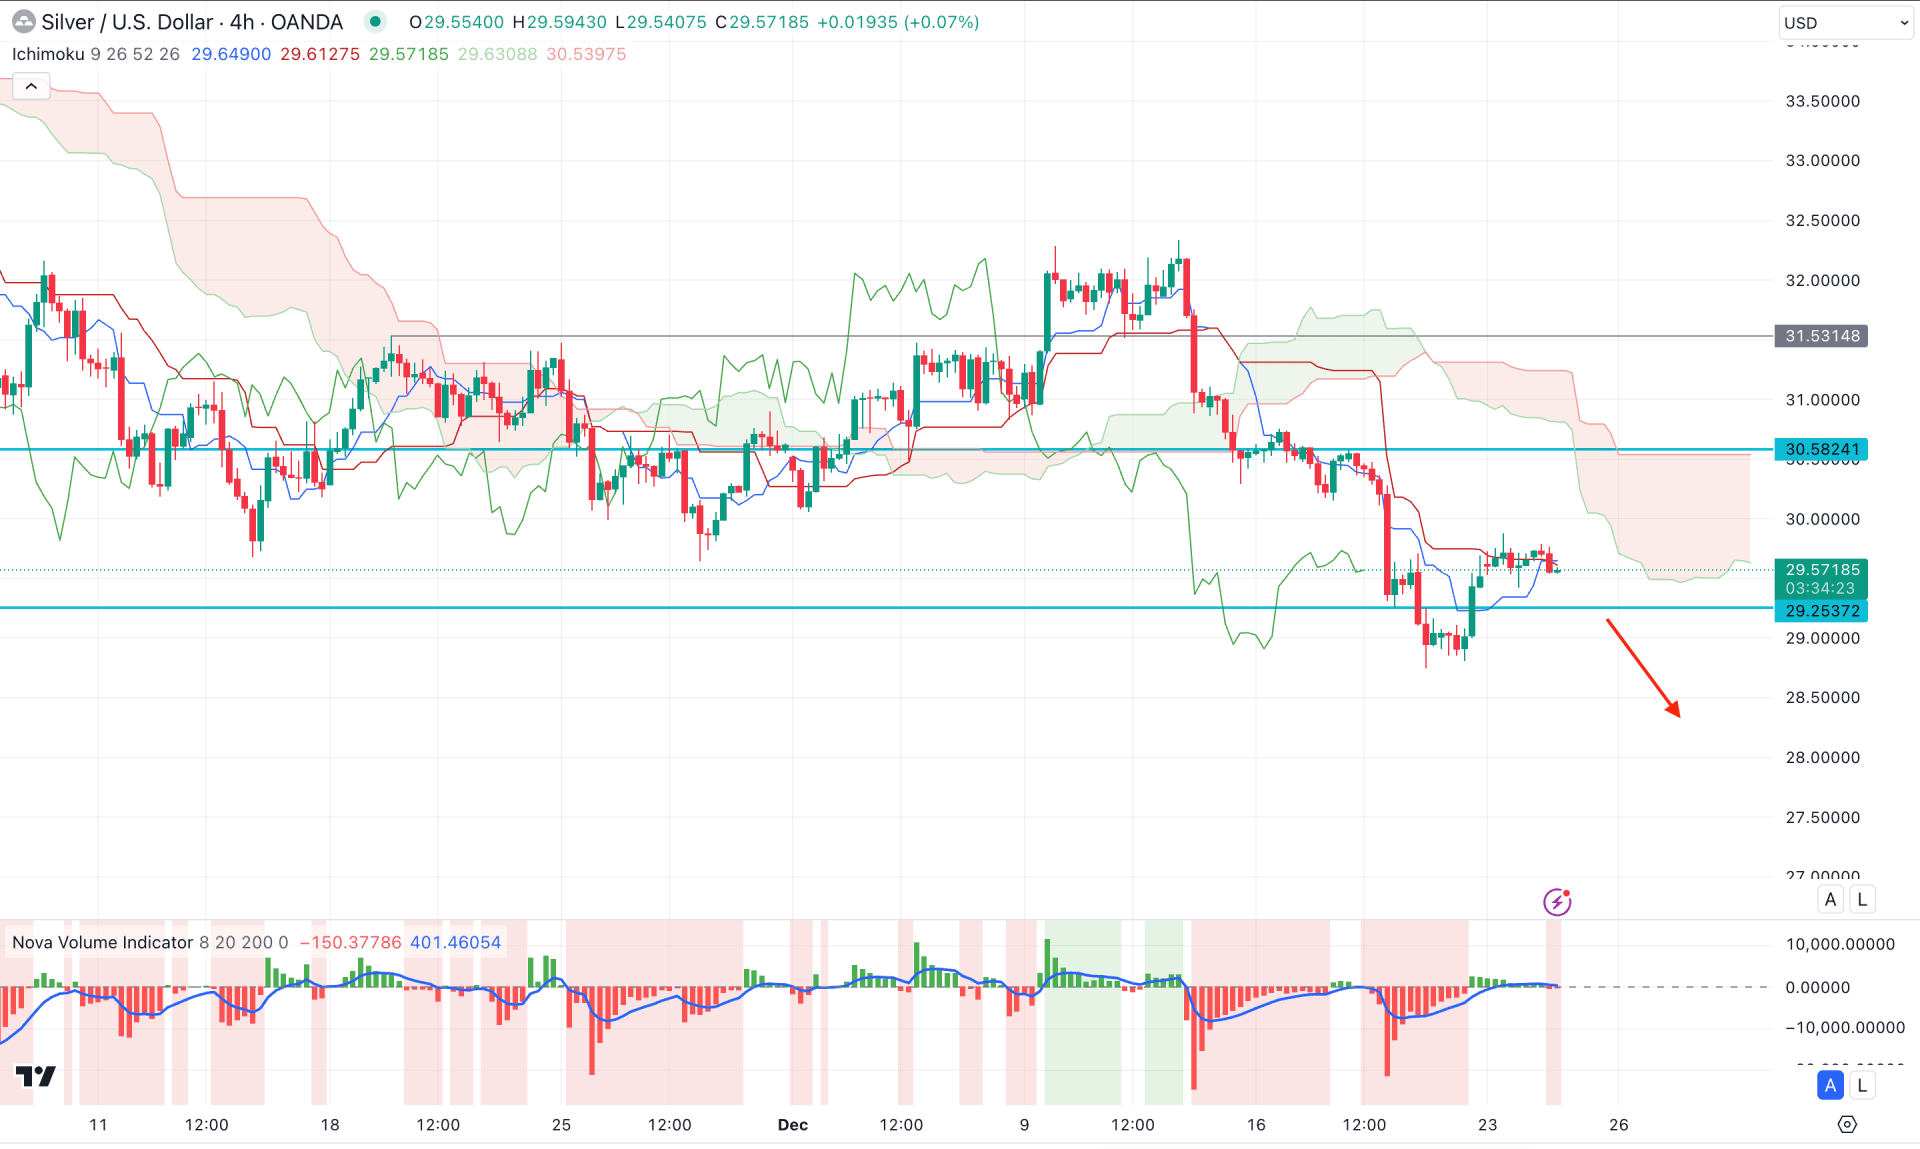
In the H4 timeframe, the recent price shows selling pressure below the dynamic Ichimoku Cloud zone, signaling an ongoing bearish trend. Moreover, the Future Cloud looks positive to bears as the Senkou Span A keeps moving down below the Senkou Span B.
In the indicator window, the volume Histogram shows a corrective pressure after reaching a peak to the bullish side. It is a sign that bulls are still struggling and a bearish flip could signal a sellers dominance in the market.
Based on the H4 outlook, the current price is hovering in line with the dynamic Kijun sen level from where an H4 candle below the 29.25 support level could signal a selling opportunity, aiming for the 27.60 level.
On the other hand, the ongoing selling pressure has a potential trendline resistance, where a bullish break above the Cloud zone could increase the possibility of grabbing the trendline liquidity soon.

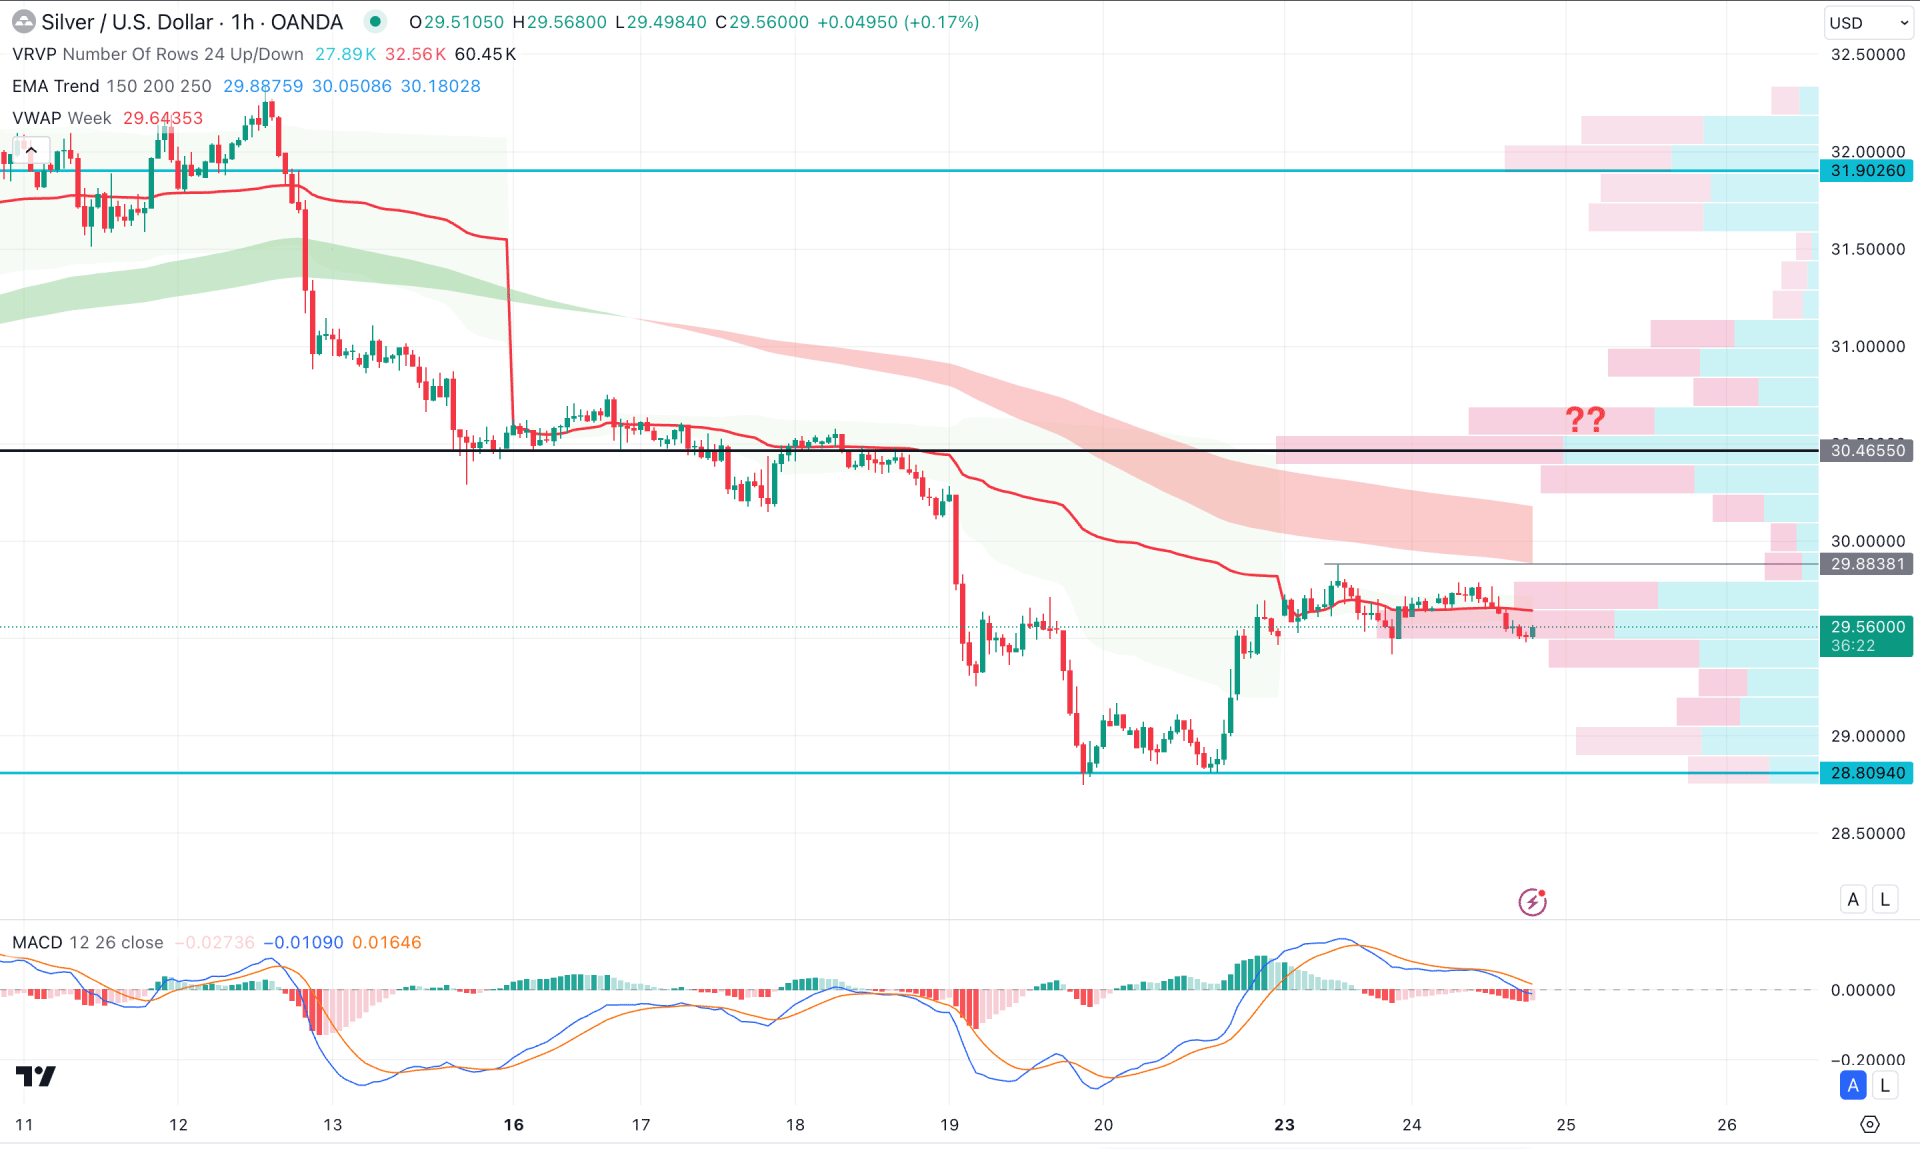
In the hourly time frame, the XAGUSD price is trading within a corrective pressure, where the visible range high volume line is working as a crucial resistance.
The ongoing selling pressure is supported by the Moving Average cloud, which is sloping down above the dynamic weekly VWAP line. As long as these dynamic levels are above the current price, we may expect a selling pressure to extend in the coming session.
Based on this outlook, the price is more likely to aim lower and form a new low below the 29.40 level. However, an immediate bullish reversal is possible from where a bullish continuation might come after overcoming the EMA wave.
Based on the current market outlook, XAGUSD is more likely to extend the corrective bearish pressure in the coming days. However, the long-term bullish trend remains intact from where a valid wedge breakout could be a high probable long opportunity.