
Published: April 2nd, 2026
Due to a risk-averse response to US President Donald Trump's televised speech on Wednesday, Silver (XAGUSD) has dropped more than $10. After closing at $81.13 upon Wednesday, the valuable metal is currently testing values below $71.00 as risk-averse markets favour the dollar.
As everyone had anticipated, Trump did not provide a precise timetable for the conclusion of the Iran War. Instead, the US president reaffirmed his appeals for allies to "build up the courage" to protect the Strait of Hormuz and his serious threats towards the Islamic Republic. In response, Tehran vowed to launch deadly strikes against the US and Israel, undermining any chance of a de-escalation.
Concerns about the rise in global energy costs brought on by the war in Iran, causing inflation, have led global government bond prices to sell off (rising yields) over the past few weeks. This has prompted central banks to hold interest rates steady or perhaps tighten their monetary policies.
Bond traders' opinions have changed recently, though, as prices have increased this week (lower yields). As a result of revised beliefs that a protracted war in Iran, along with a greater amount of energy costs that would accompany it, would be a major burden on global economies and force central banks to cut interest rates.
Let's see how Silver could perform from the XAGUSD technical analysis:
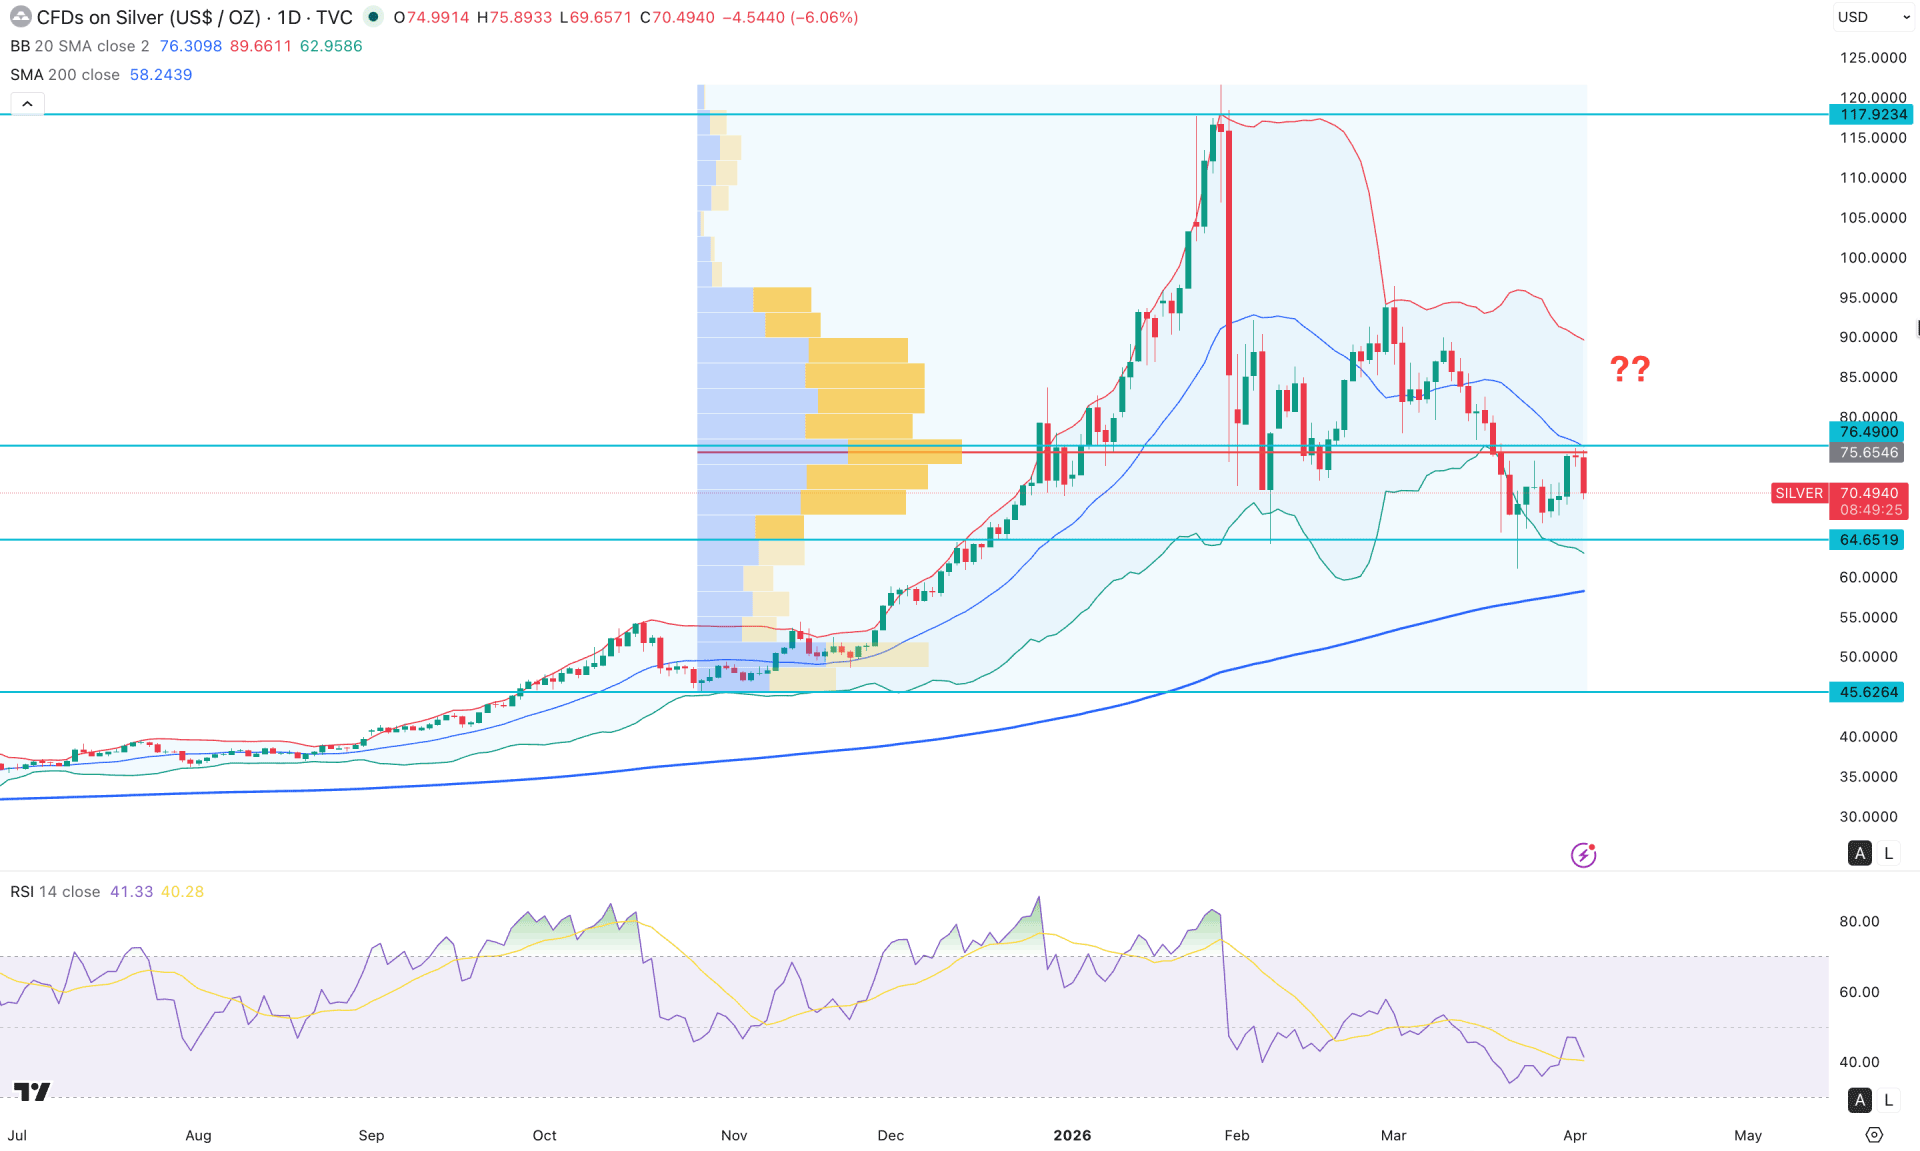
In the daily chart of XAGUSD, a strong pump-and-dump is visible, driven by the uncertainty from the Middle East crisis. The price extended its bullish momentum beyond the 120.00 level for the first time in history, but declined sharply below the 70.00 area. Following that, a minor bullish correction is visible, but the overall momentum remains within a bearish leg.
Looking at the higher timeframe, the monthly candle suggests a strong reversal possibility, as the latest candle has closed as a bearish engulfing bar, followed by clear exhaustion at the top. The weekly timeframe reflects a similar scenario, with recent candles moving sideways after three consecutive bearish weeks.
In terms of volume, the selling pressure appears valid, as the highest activity level since October 2025 is positioned above the current price. Notably, the 75.65 high-volume level could act as strong resistance. As long as the price remains below this level, the primary outlook favours short opportunities.
On the daily chart, the price is currently facing strong resistance at the high-volume level, accompanied by an indecision candle. Moreover, the Bollinger Bands indicate a minor selling opportunity, as the price is struggling to break above the middle band.
In the indicator window, the Relative Strength Index (RSI) remains bearish, as the current RSI line is having a downward slope from the 45.00 level. Moreover, the strength of the trend is solid, as the Average Directional Index (ADX) remains above 20.00.
On the chart, the price is facing strong resistance at $75.65. The Bollinger Bands also suggest that the price might go down. The Relative Strength Index (RSI) is bearish. The Average Directional Index (ADX) shows that the trend is strong.
Based on this, the price might keep going down and test the $64.65 support level. If it breaks below this level, it could go down to $45.62.
Investors should watch how the price reacts at the $64.65 support level. If it doesn't break below this level, it could start going up. However, before confirming a reversal, investors should look for the price to stay above the $75.65 resistance level.
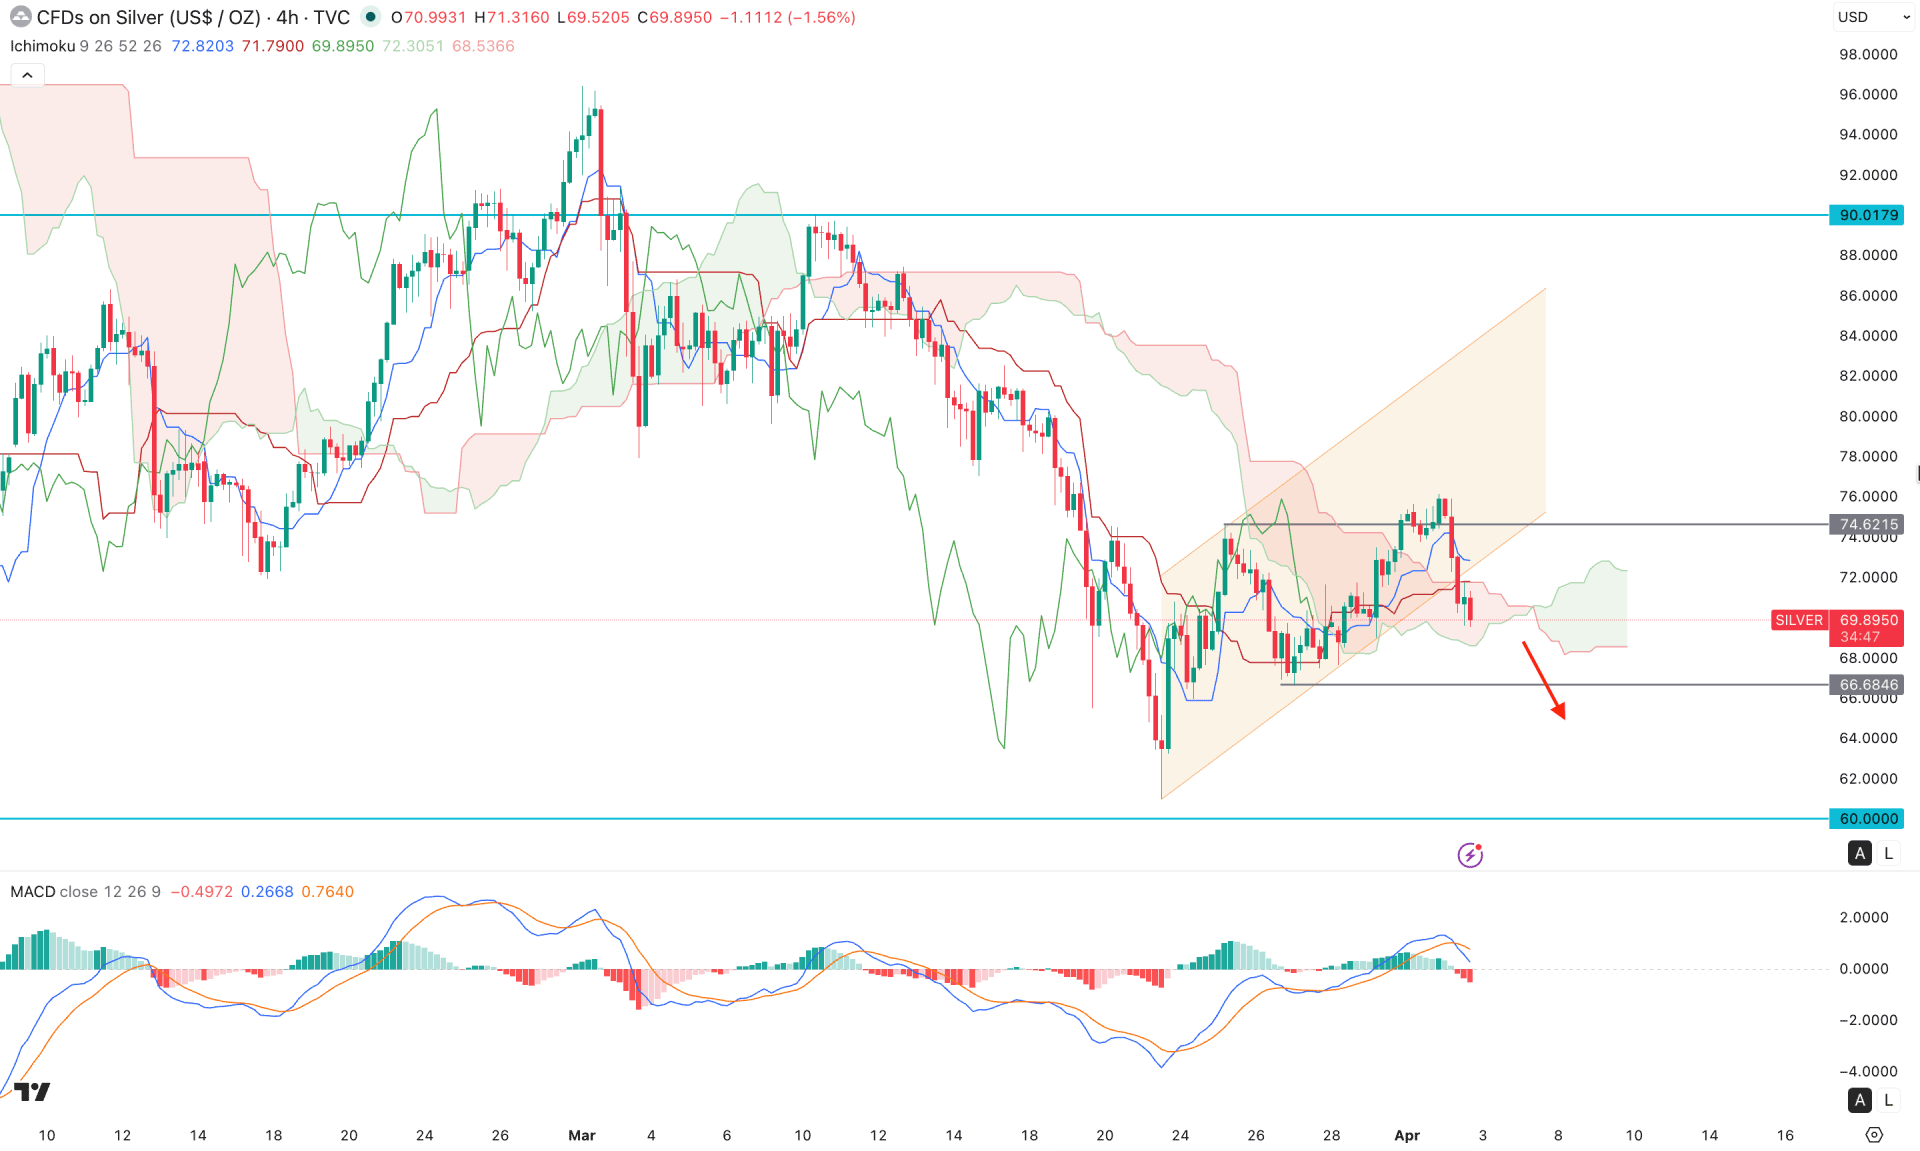
On the four-hour timeframe, the recent price action shows weakness, as the price failed to maintain momentum above the cloud support. As a result, the price formed an immediate recovery and is currently hovering within the cloud area. The future cloud remains mixed, with both leading spans flat, suggesting a corrective market structure.
On the other hand, the indicator window indicates downside possibility, as the MACD signal line is below the neutral level. Additionally, the MACD signal line has formed a bearish crossover near the top, signalling an additional bearish signal.
Based on this outlook, the price is more likely to extend downside pressure and test the 66.68 support level. Moreover, a stable price below the cloud area could extend the bearish scenario, with the ultimate target near the 60.00 psychological level.
Conversely, the price is currently trading below an ascending channel, and any immediate recovery followed by a four-hour close above the channel resistance could limit the selling presure. In that case, the price may move higher and test the 82.00 area before forming another short-term bearish structure.
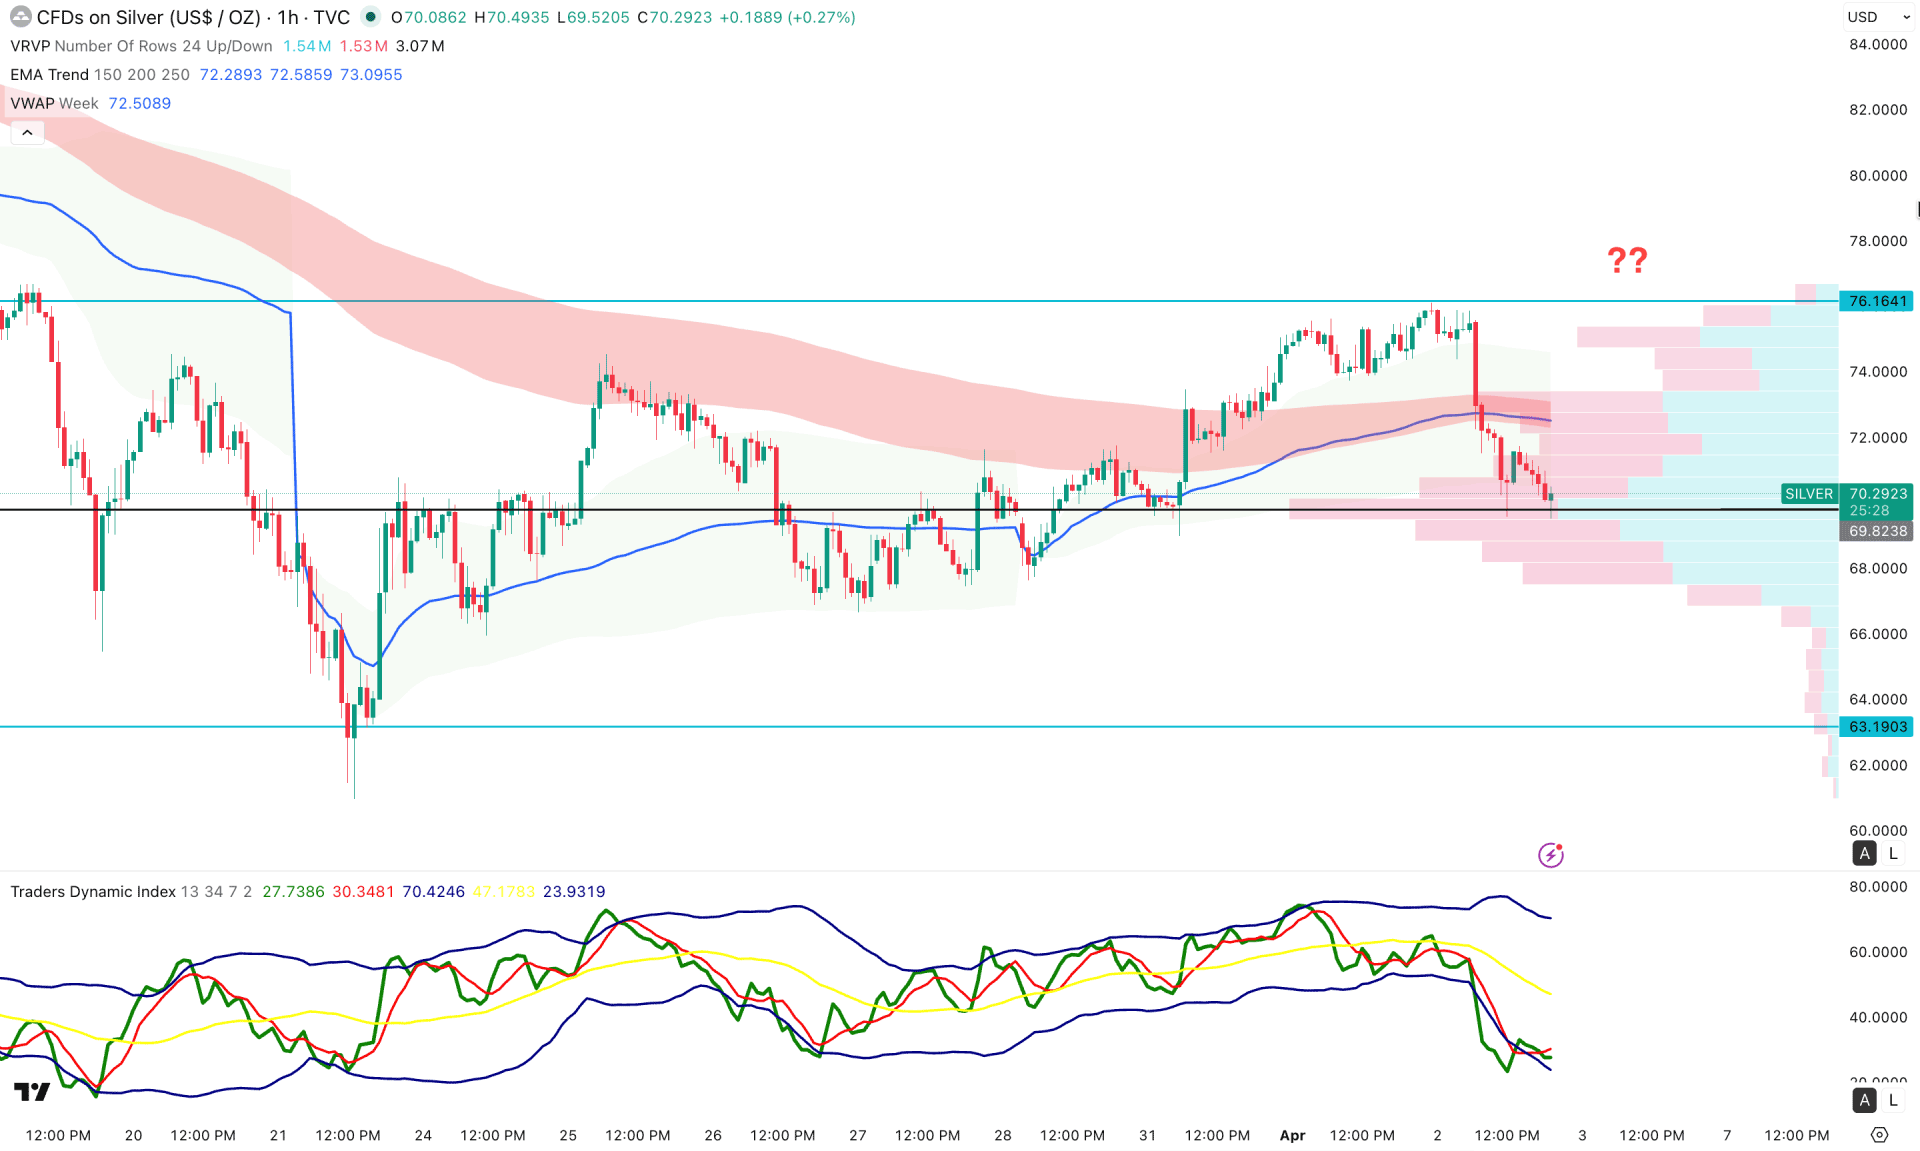
On the hourly timeframe of silver, strong impulsive bearish pressure is visible from the 76.16 level. Following this decline, investors may expect further downside continuation until a clear barrier emerges near the short-term support level.
On the main price chart, the EMA wave and weekly VWAP are above the current price, indicating sustained bearish pressure. However, a high-volume support zone is located near the current price, acting as a strong barrier for sellers.
Based on this outlook, the extreme bearish condition reflected in the Traders Dynamic Index (TDI), combined with the nearby high-volume support area, could present a challenging environment for sellers. Any immediate recovery, supported by an hourly close above the weekly VWAP line, may invalidate the bearish setup.
On the other hand, a break below the high-volume support level could intensify the downside pressure and push the price toward the 64.00 support level.
From a broader market structure perspective, XAGUSD is currently trading within a classic pump-and-dump formation. The recent price action shows an impulsive bearish wave, suggesting that a corrective pullback may occur before the next impulsive move.
Investors should closely monitor any upward retracement, as it may provide a favourable opportunity to establish short positions from a reliable resistance zone.


