
Published: February 27th, 2025
Following the contradictory remarks on tariffs, Silver recovered some of its large losses last week. The decline had taken place after U.S. President Donald Trump created confusion during a cabinet meeting on Wednesday.
"Tariffs will go on, not all, but a lot of them," said President Trump, adding that import duties on goods from Canada and Mexico would begin on April 2. On the same day, he added, reciprocal tariffs ought to be put into effect. Furthermore, Trump stated that a 25% duty would be imposed on European vehicles and other commodities, but he did not elaborate.
Investors should closely monitor the upcoming US PCE Index report for January. As expected, the data excluding food and energy were lower in December, with an increase in the monthly CPI.
Moreover, the meeting of the European leaders with the Uk price minister could be an event to look at, which could provide a signal about the trade war.
Let's see the further outlook of this pair from the XAGUSD technical analysis:
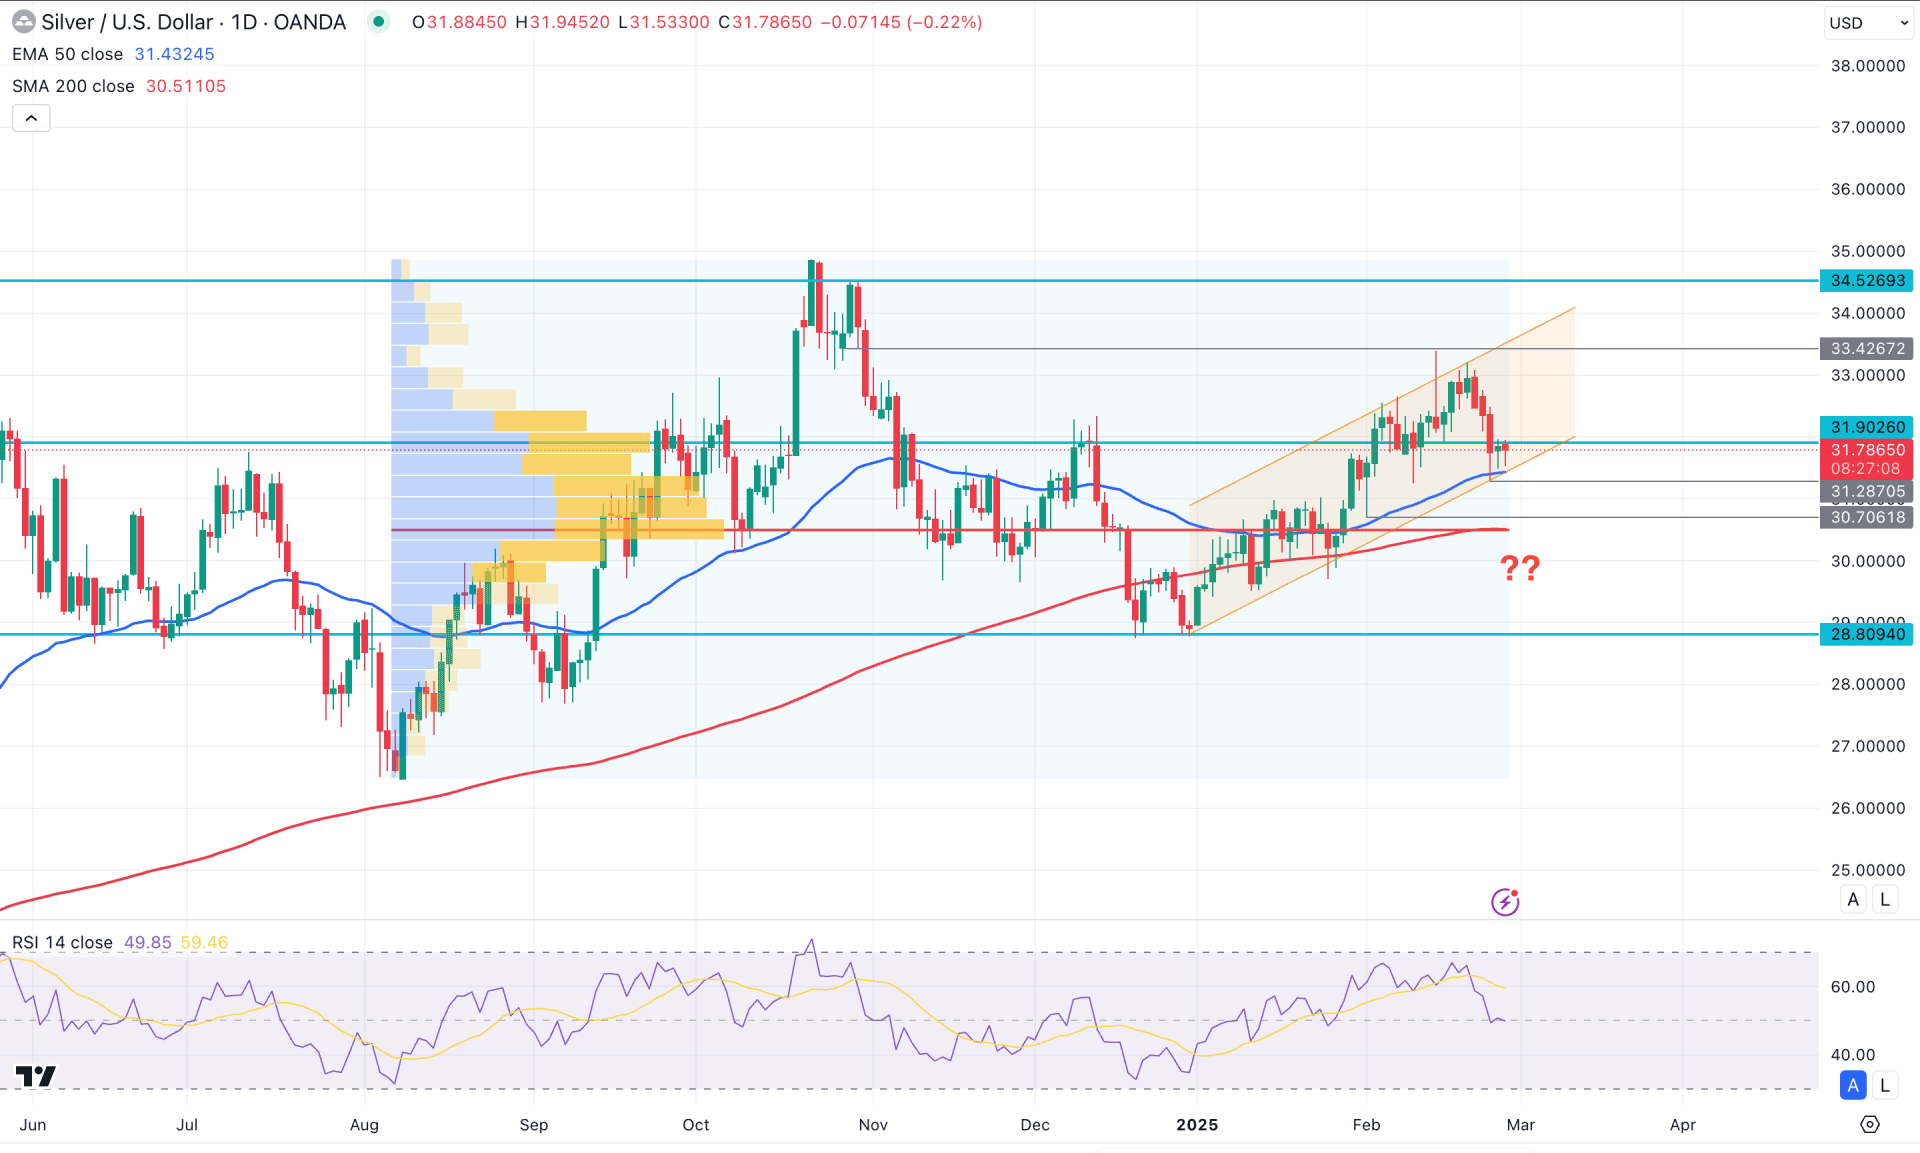
In the daily chart of silver (XAGUSD), the extended selling pressure from the all-time high created a bottom before rebounding above the 50% Fibonacci retracement line. Primarily, a bullish continuation is supported by a trendline, which might act as a potential trend continuation opportunity.
Looking at the higher timeframe, a bullish engulfing candle appears on the monthly chart, eliminating all losses incurred in December 2024. This suggests that the current price is heading upwards, supported by trend continuation momentum, which might extend in the coming days.
On the other hand, the weekly chart tells a different story, showing bearish momentum after five consecutive bullish candles. In this case, a valid weekly candle is yet to form before anticipating the upcoming trend.
In the main chart, the daily outlook remains bullish, supported by a major bullish rebound from the 200-day Simple Moving Average (SMA). Additionally, the 50-day Exponential Moving Average (EMA) is above the 200-day SMA, acting as immediate support. Despite the dynamic support, no sufficient bullish reversal is visible yet.
The Relative Strength Index (RSI) is currently at the 50.00 line after failing to reach above the 70.00 overbought area.
Based on the daily market outlook, the bullish possibility is likely to materialize after a valid bullish candlestick at the support area. However, a liquidity sweep from the dynamic area with a rebound from 31.28 to 30.70 could offer another long opportunity. In both cases, the primary goal would be to test the trendline resistance area at the 33.42 level.
On the other hand, the bearish approach is to find a downside pressure below the 200-day SMA line, which could push the price below the 27.00 level.
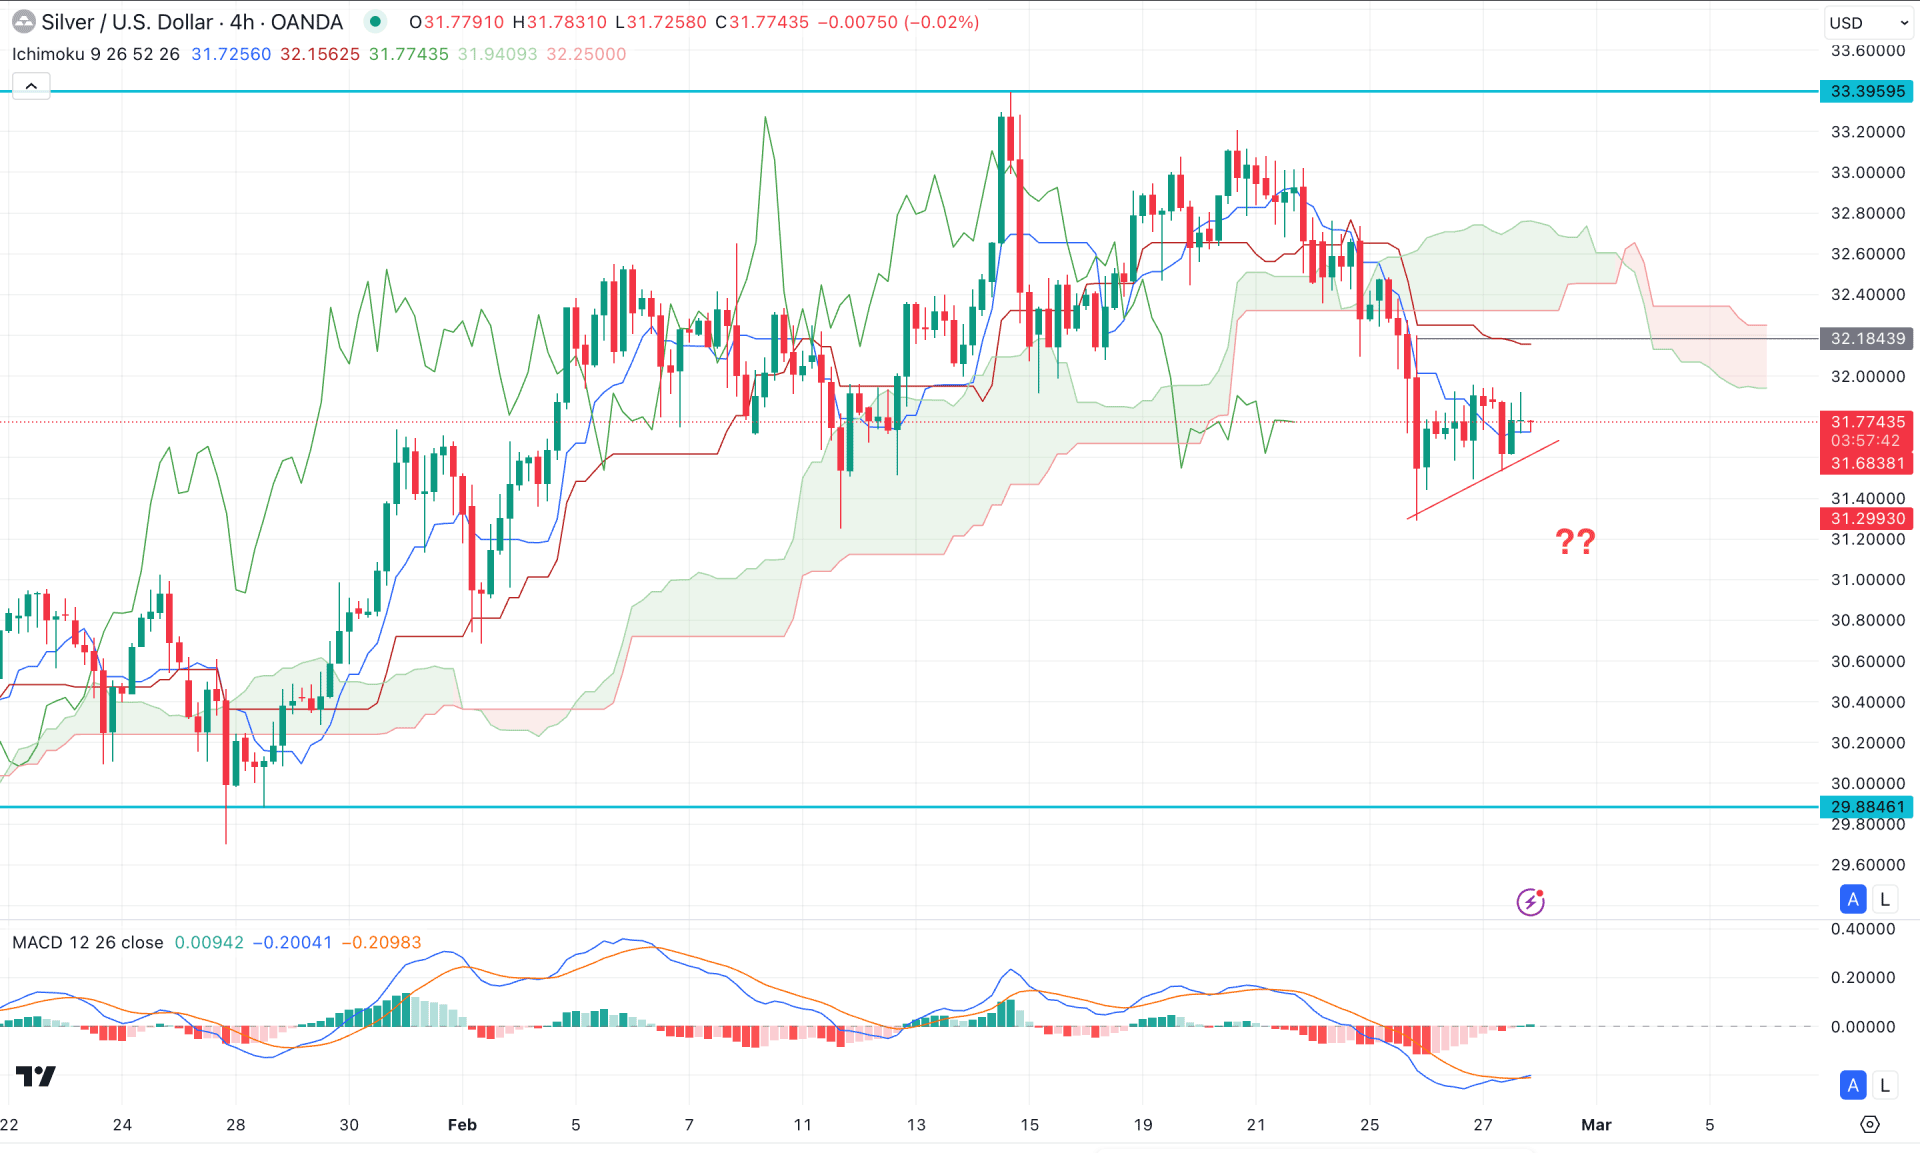
In the H4 timeframe, the recent price action showed a strong immediate downside recovery, but it failed to hold the price above the Ichimoku Cloud area. As a result, the price extended lower, forming a potential trend reversal.
In the future cloud, both lines are heading downward, signaling medium-term selling pressure in the market. However, the near-term dynamic line is within the price, signaling a potential correction before extending the loss.
In the indicator window, the MACD signal line has reached the bottom and formed a bullish crossover with a positive histogram.
Based on the H4 structure, downside continuation is likely as long as the key resistance zone remains above the current price. However, a short-term correction towards the 32.00-32.20 area could occur before extending the downside pressure toward the 30.00 level.
Alternatively, an immediate reversal above the 32.50 level could open the way for movement beyond the 33.39 level.
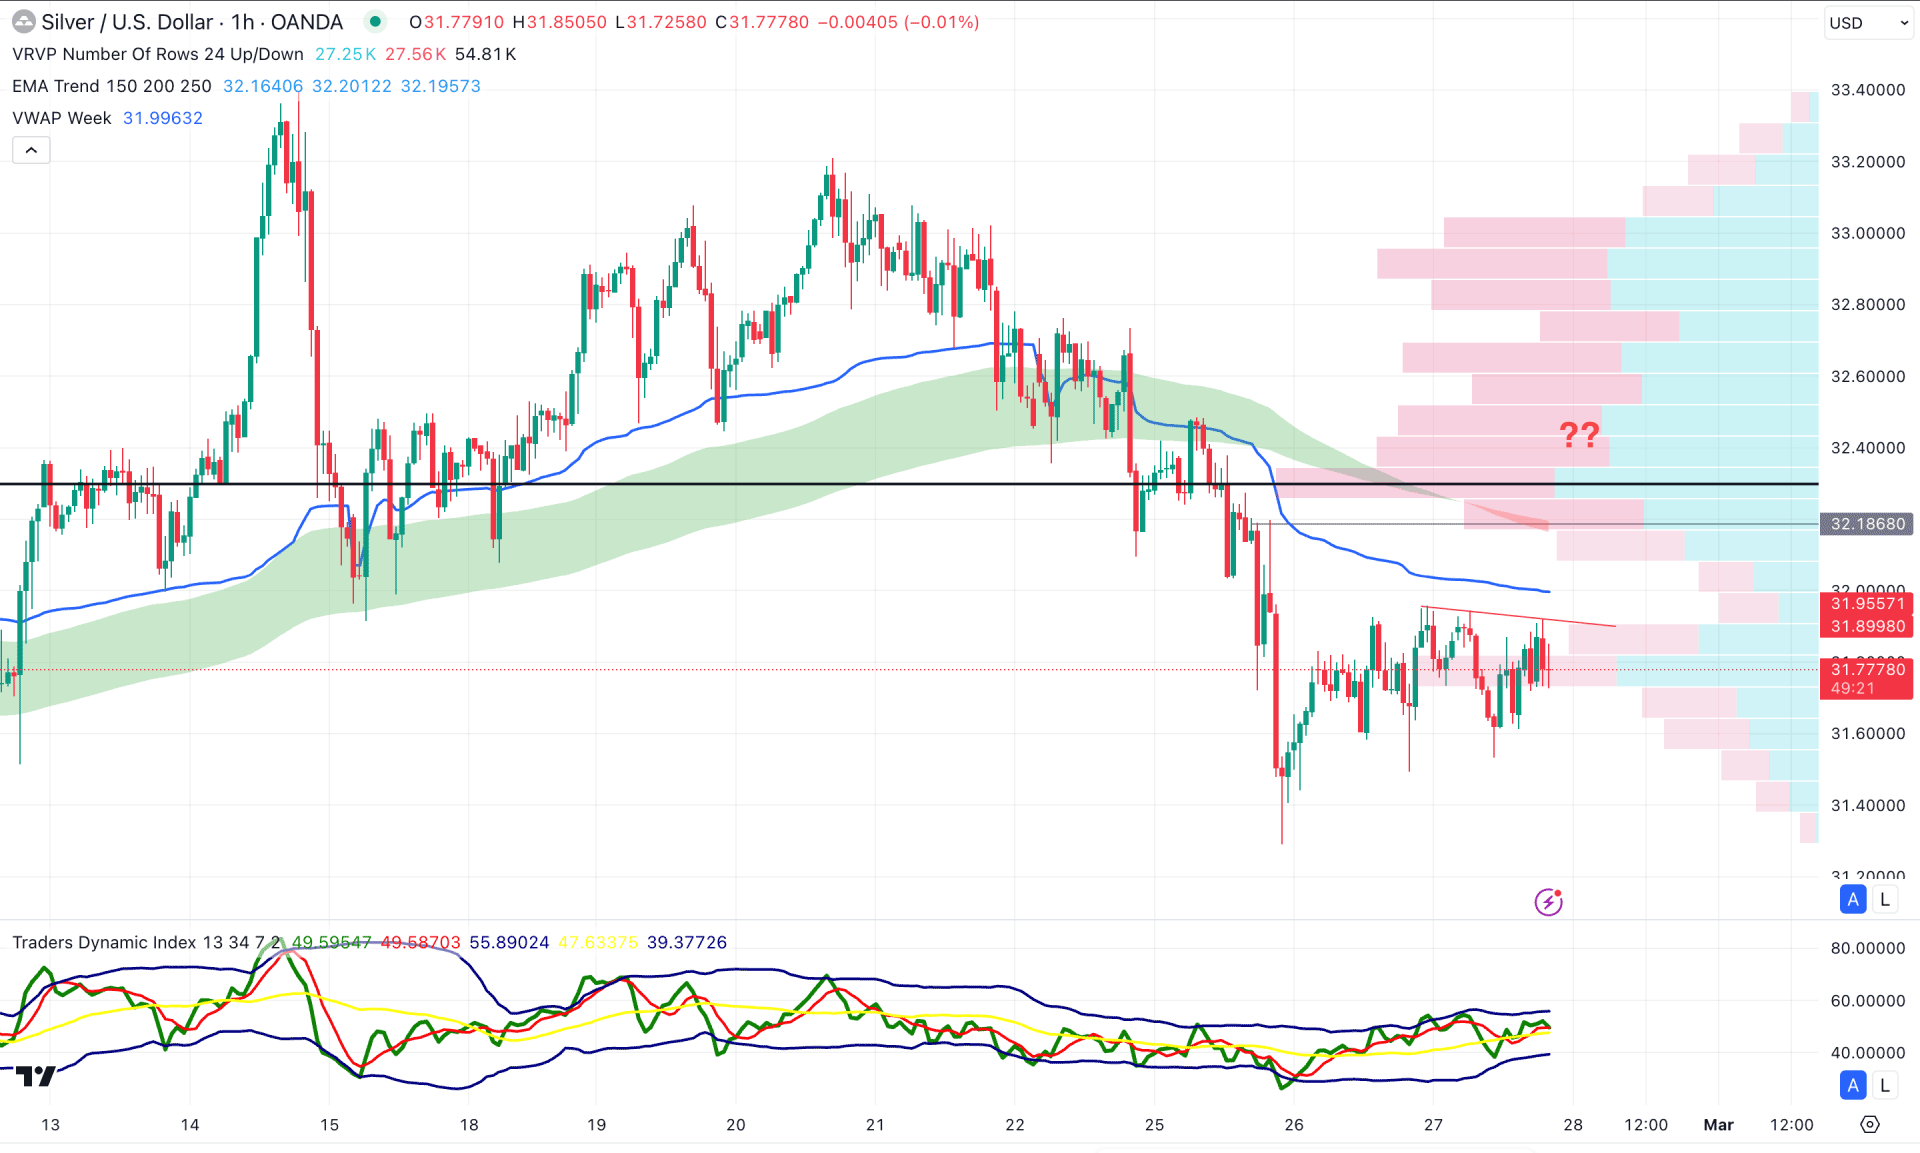
In the hourly time frame, downside pressure is visible, with a drop base drop formation as a price redistribution.
The visible range high volume line is above the current price, indicating a downside crossover with the Moving Average Wave. Additionally, the weekly VWAP line is just above the current price, acting as immediate resistance.
Based on this outlook, the buy-side liquidity area above the trendline resistance would suggest a bearish trading opportunity. Therefore, a valid bearish candlestick formation from the 31.95 to 32.18 zone could validate a short position.
On the other hand, the major market trend remains bullish on the daily chart. Following this, a recovery with an hourly close above the 32.60 level could increase the long opportunity toward the 33.00 area.
Based on the current multi-timeframe analysis, the Silver (XAGUSD) needs a valid bullish reversal at the support zone before expecting a channel extension. As the intraday price is still bearish, some selling pressure is expected. Any rebound with a recovery above the dynamic lines would be an early buying opportunity.


