
Published: December 24th, 2020
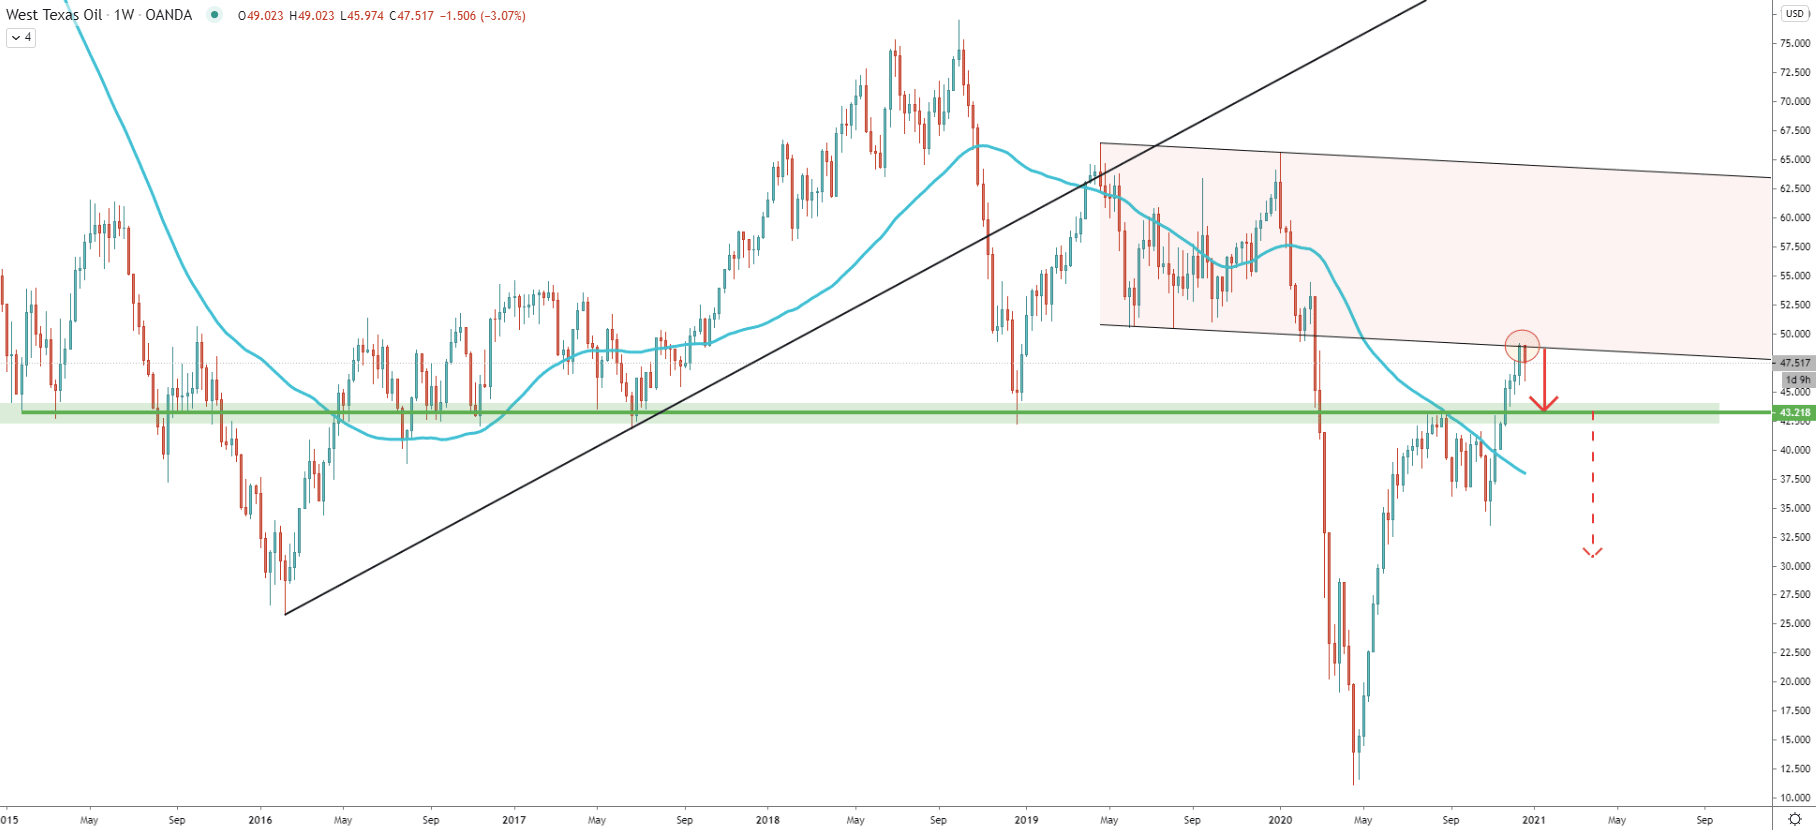
On the weekly chart, the long-term trend or the USOil still remains bearish. At the end of 2019 prie broke below the uptrend trendline, which has resulted in a massive drop in price. The WTI/USD has dropped from $75 down to $10 in just one year. But since May, the price has been steadily correcting up and it managed to break the key resistance area near $43.20, which previously acted as the supply/demand zone. At the same time, the 50 Exponential Moving Average was acting as the resistance at $43.20, and then the price broke to the upside, yet again emphasizing the importance of this price.
After the breakout, USOil has reached the $49.20 high, on December 18. This is where the lower trendline of the descending channel got rejected. Perhaps this level could be a key long-term resistance, which must be broken before/if the uptrend continues. But while the current high is holding, WTI/USD is likely to go through a correctional phase, to re-test the $43.20 support area, in the next several weeks.
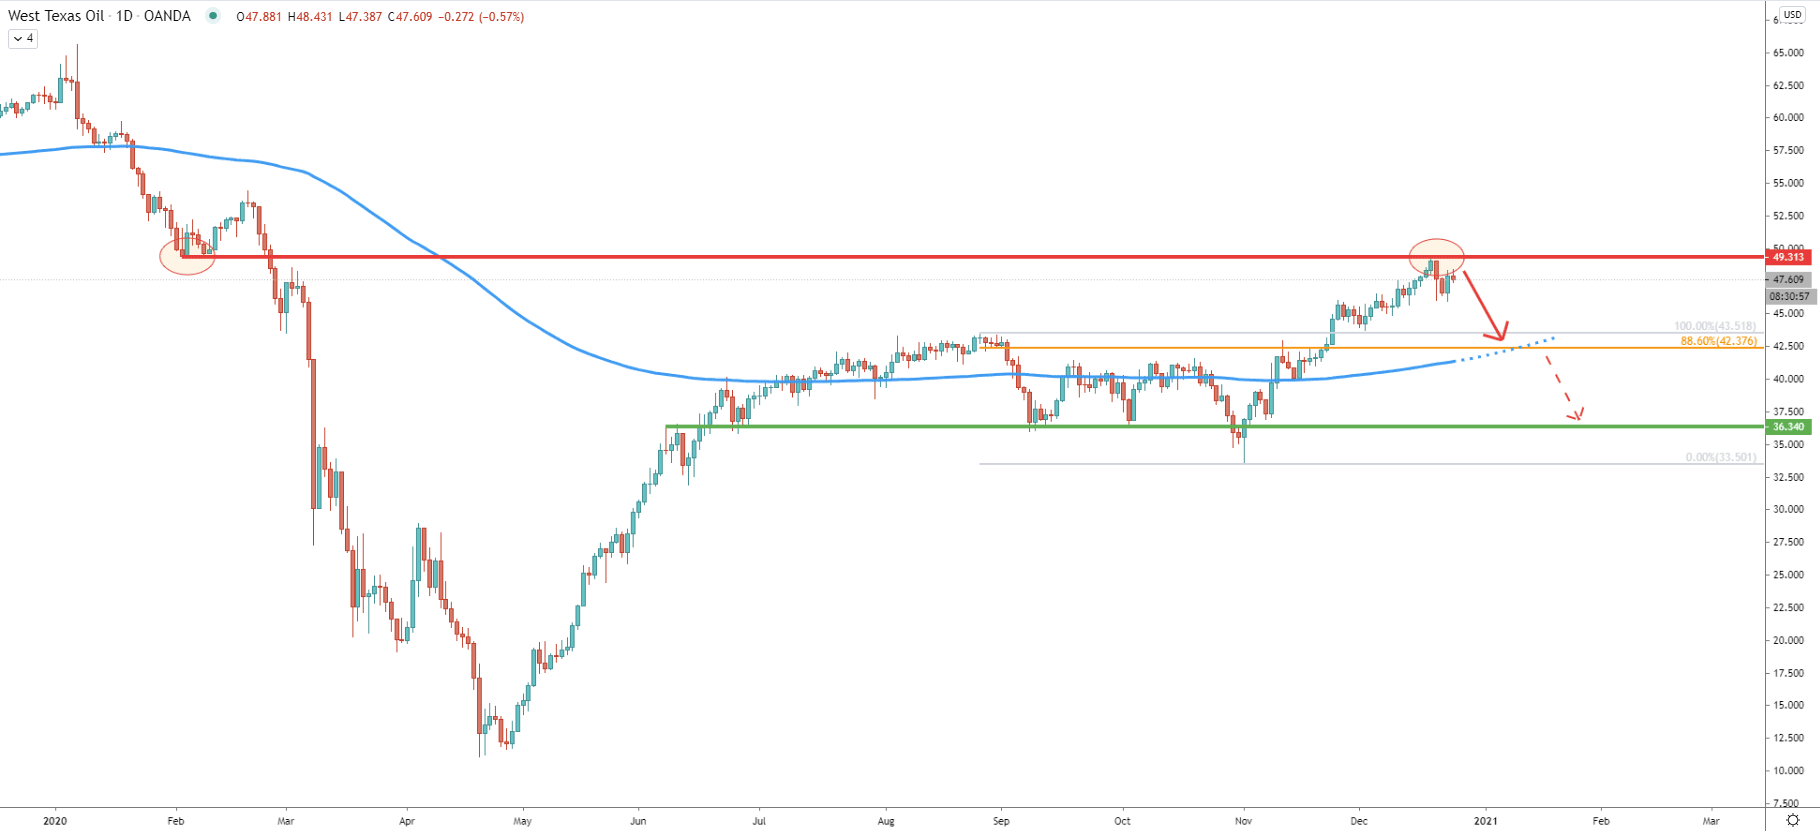
On the 16-hour chart, WTI has reached and cleanly rejected the previous area of support, formed back nearly a year ago, in February 2020. Such a clean bounce goes to show, that it is being defended by the sellers and the correction can be expected. The price might decline towards the 200 Exponential Moving Average which corresponds to the 88.6% Fibonacci retracement level applied to the previous correction down. Therefore, as long as the $49.30 resistance area holds, WTI/USD is likely to decline by $7. Based on the crossing of the support and the extended line of the 200 EMA, this might occur within the next two weeks.
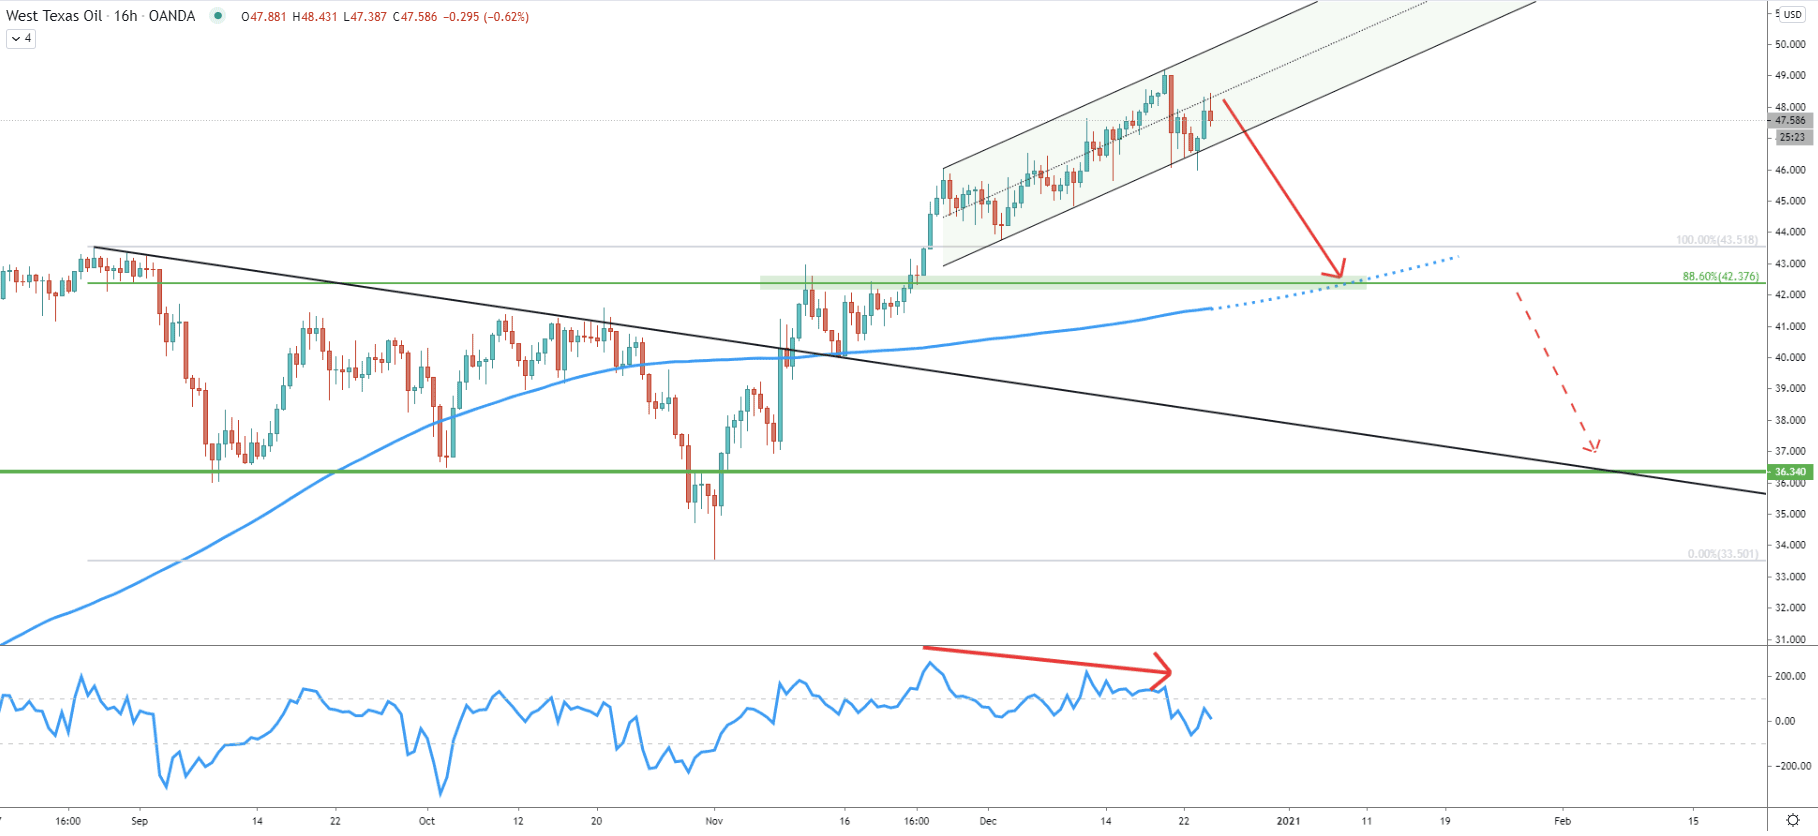
On the 16-hour chart, the USOil is still trading within the ascending channel. There was an attempt for a breakout, although the price failed to close below the channel. This implies that the uptrend is still valid, although some contradictions starting to appear. For example, the formation of bearish divergence on the RSI oscillator, indicating that the selling pressure is increasing. Perhaps the battle between bulls and bears has begun, which is likely to result in some consolidation before/if the downside correction will take place. Nonetheless, a break below the channel could be the confirmation of the downtrend and on this chart previously mentioned support is also confirmed by the 200 EMA.
But what if this will not be just a correction, but a long term downtrend continuation? Well, beak below the $42.37 support might trigger yet another downside wave, potentially sending price down to $36.34, which is a previously formed demand zone.
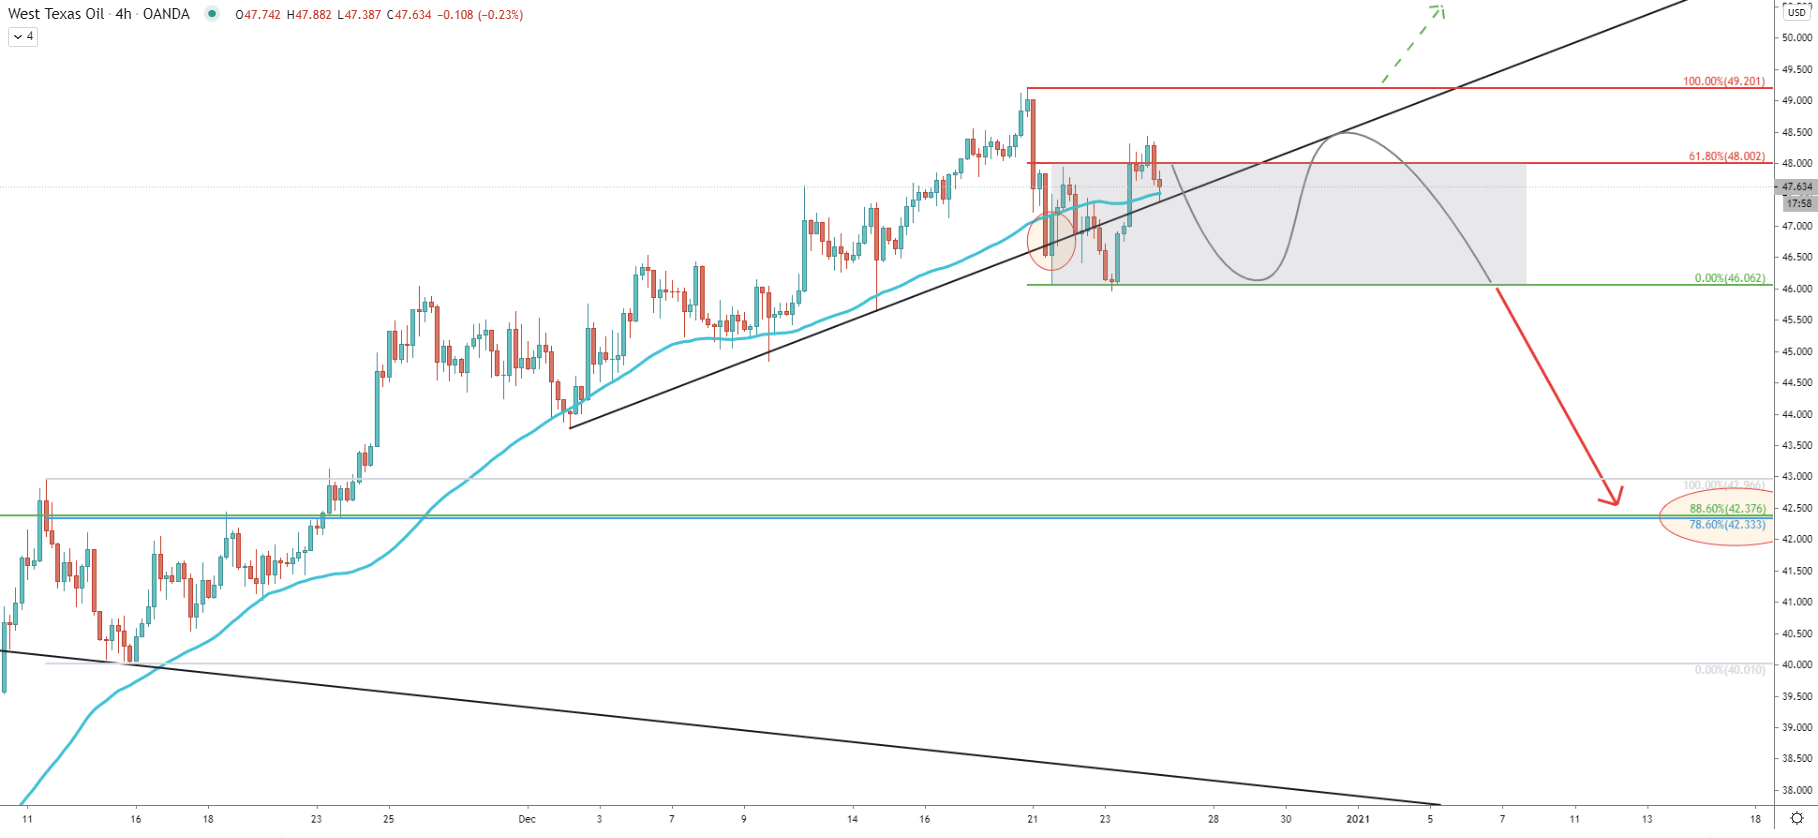
While the ascending channel is being respected on the 16-hour chart, on the 4-hour chart it can be seen that the uptrend trendline along with the 50 EMA got broken. After that price corrected up and rejected the 61.8% Fibonacci retracement level at $48.00. This is a very strong psychological resistance and perhaps the $48-49 area, has become a key resistance zone. While the price is below it, range trading should b expected to start.
Upon break below the $46 support, the decline towards the $42.30 might take place. On this chart, this support is confirmed now by two Fibonacci retracement levels. The first is 88.6% Fibs as per the daily chart. The second is the 78.6% Fibs applied to the previous correction down, where the downtrend trendline got rejected after the breakout.
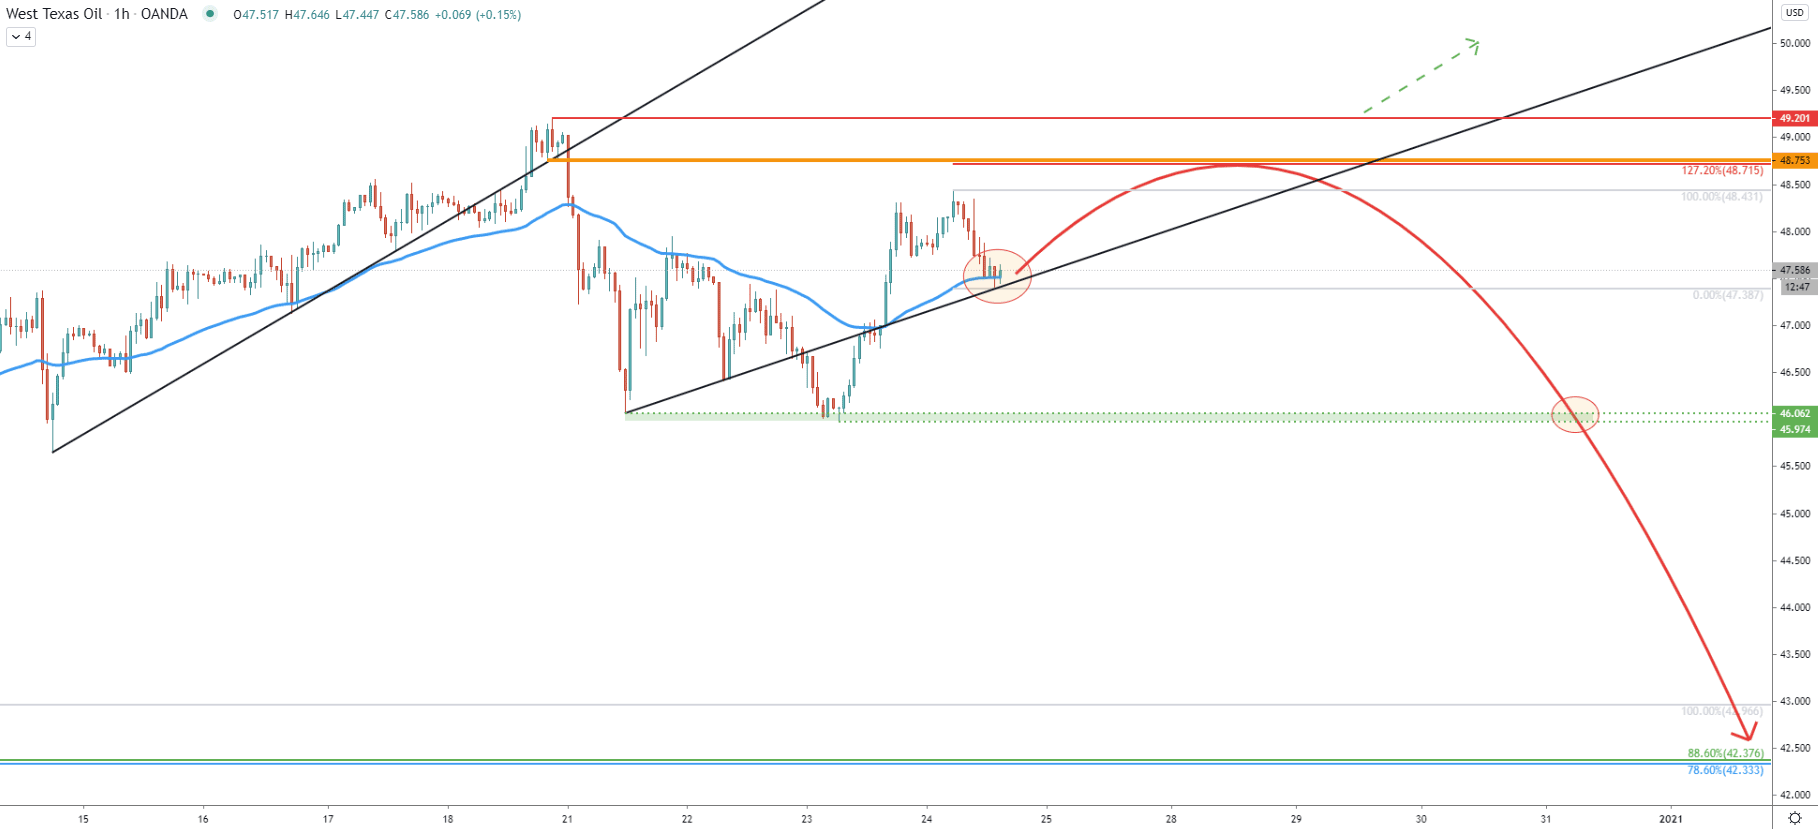
Finally, on the hourly chart, it can also be seen that the simple uptrend trendline got broken. The breakout point, near the $48.70 could be that strong supply point and the level of interest for the sellers. This is because it corresponds to the 127.2% Fibonacci retracement level, applied to the current downside correction, where the uptrend trenldine along with the 50 EMA got rejected.
While the trend is very bullish, the USOil is starting to show signs of weakness. If the price will manage to stay below the recently printed high at $49.20, the decline towards $42.30 is likely to be the case. But for this scenario price must break below the $46 support first. Right now the consolidation phase seems to have started, and maybe sometime next week the downside move will start.
As per the daily and 4-hour chart, the key support level is located at $42.30 and is confirmed by two Fibonacci retracement levels. Besides, it goes in line with the 200 Exponential Moving Average on two different timeframes.
As per the hourly chart, a break above the $49.20 will invalidate the bearish outlook, and in this case, the uptrend should continue. The nearest psychological resistance is at $50, and it will be highly probable that USOil will test this level in a relatively short period of time after the break above the current high.
Support: $47.40, $46.00, $42.30
Resistance: $48.00, $48.70, $$49.20