
Published: May 14th, 2026
West Texas Intermediate (WTI) is trading within a volatile market condition where clear price action could create an investment opportunity.
Following White House officials' description of the discussion between the US and Chinese presidents as "positive" and their emphasis on talks aimed at enhancing economic cooperation, prices have reversed. Additionally, both leaders concurred that the Strait of Hormuz should remain open, a matter of particular concern for oil markets given the passage's strategic significance to international oil commerce.
A portion of the geopolitical danger premium incorporated into energy costs in previous weeks was reduced by the remarks. With Donald Trump expected to push Beijing toward a peace deal and the full restoration of the Strait of Hormuz, markets were closely monitoring talks with Iran.
Nonetheless, the expectations for global supply continue to underpin oil prices. Due to difficulties caused by the Iran war in the Middle East, the International Energy Agency (IEA) stated on Wednesday that the world's oil supply is expected to remain below demand this year. The EPA has significantly revised its prior estimate and now predicts a decrease in world supply of about 3.9 million barrels each day this year.
Let's see the complete price projection from the WTI price analysis:
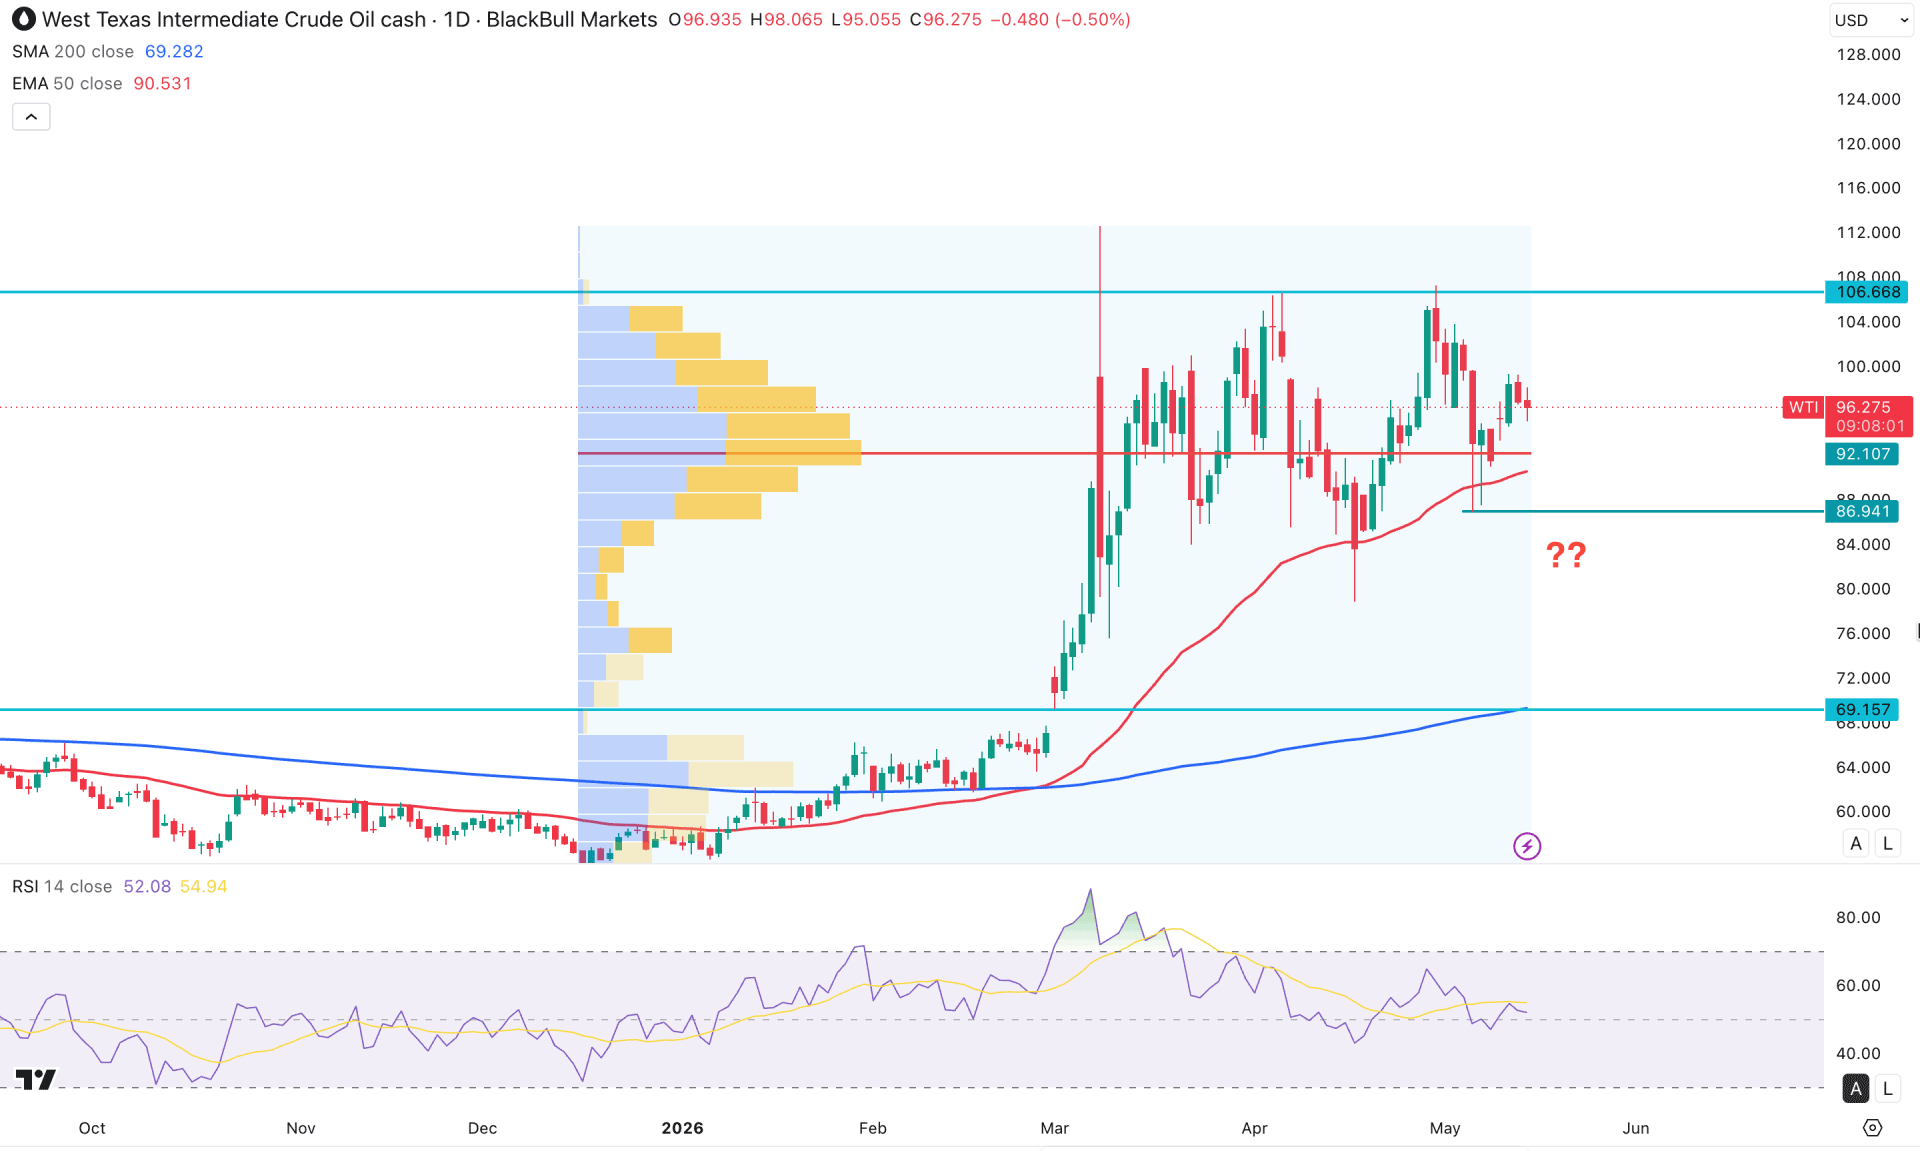
In the daily chart of WTI, the recent price shows extended volatility due to the uncertainty in the Middle East. As a result, a sideways market is visible after reaching the peak of 112.56 with multiple violations in near-term swing levels. As long as the price remains within the consolidation low, the primary anticipation would be to look for long trades only.
Looking at the higher timeframe, the monthly candle is showing a sideways market within a bullish wave. In this context, 103.79 is a crucial monthly resistance to look at. The weekly price indicates extreme volatility, and a declining market momentum is clear.
In the volume structure, the ongoing volatility is clear as multiple violations are seen from the high volume level at the 92.10 area. The most recent price above this high line is signalling a buyer's presence in the market.
In the main price, the 50-day EMA is the immediate support as multiple violations are seen from this line. Moreover, the 200-day SMA is below the entire structure and is working as a major support. Primarily, the gap between the current price and the 200 SMA has expanded, creating a potential downside correction possibility.
In the secondary indicator window, the Relative Strength Index is hovering at the 50.00 neutral level, which signals a sideways market momentum. Moreover, multiple violations are seen at the 50.00 neutral level, which signals a breakout possibility after valid price action.
Based on the overall market outlook, WTI is trading within a bullish trend. In that case, the price is likely to extend buying pressure and test the 106.66 resistance level before continuing the long-term bullish trend.
On the other hand, a deeper correction is possible after moving below the 86.94 level, which could increase the possibility of testing the 69.15 support line. On the bearish side, a failure to hold the market above the 92.10 high-volume support line could be a challenging factor for buyers. In that case, the price might open a short opportunity targeting the 76.00 area.
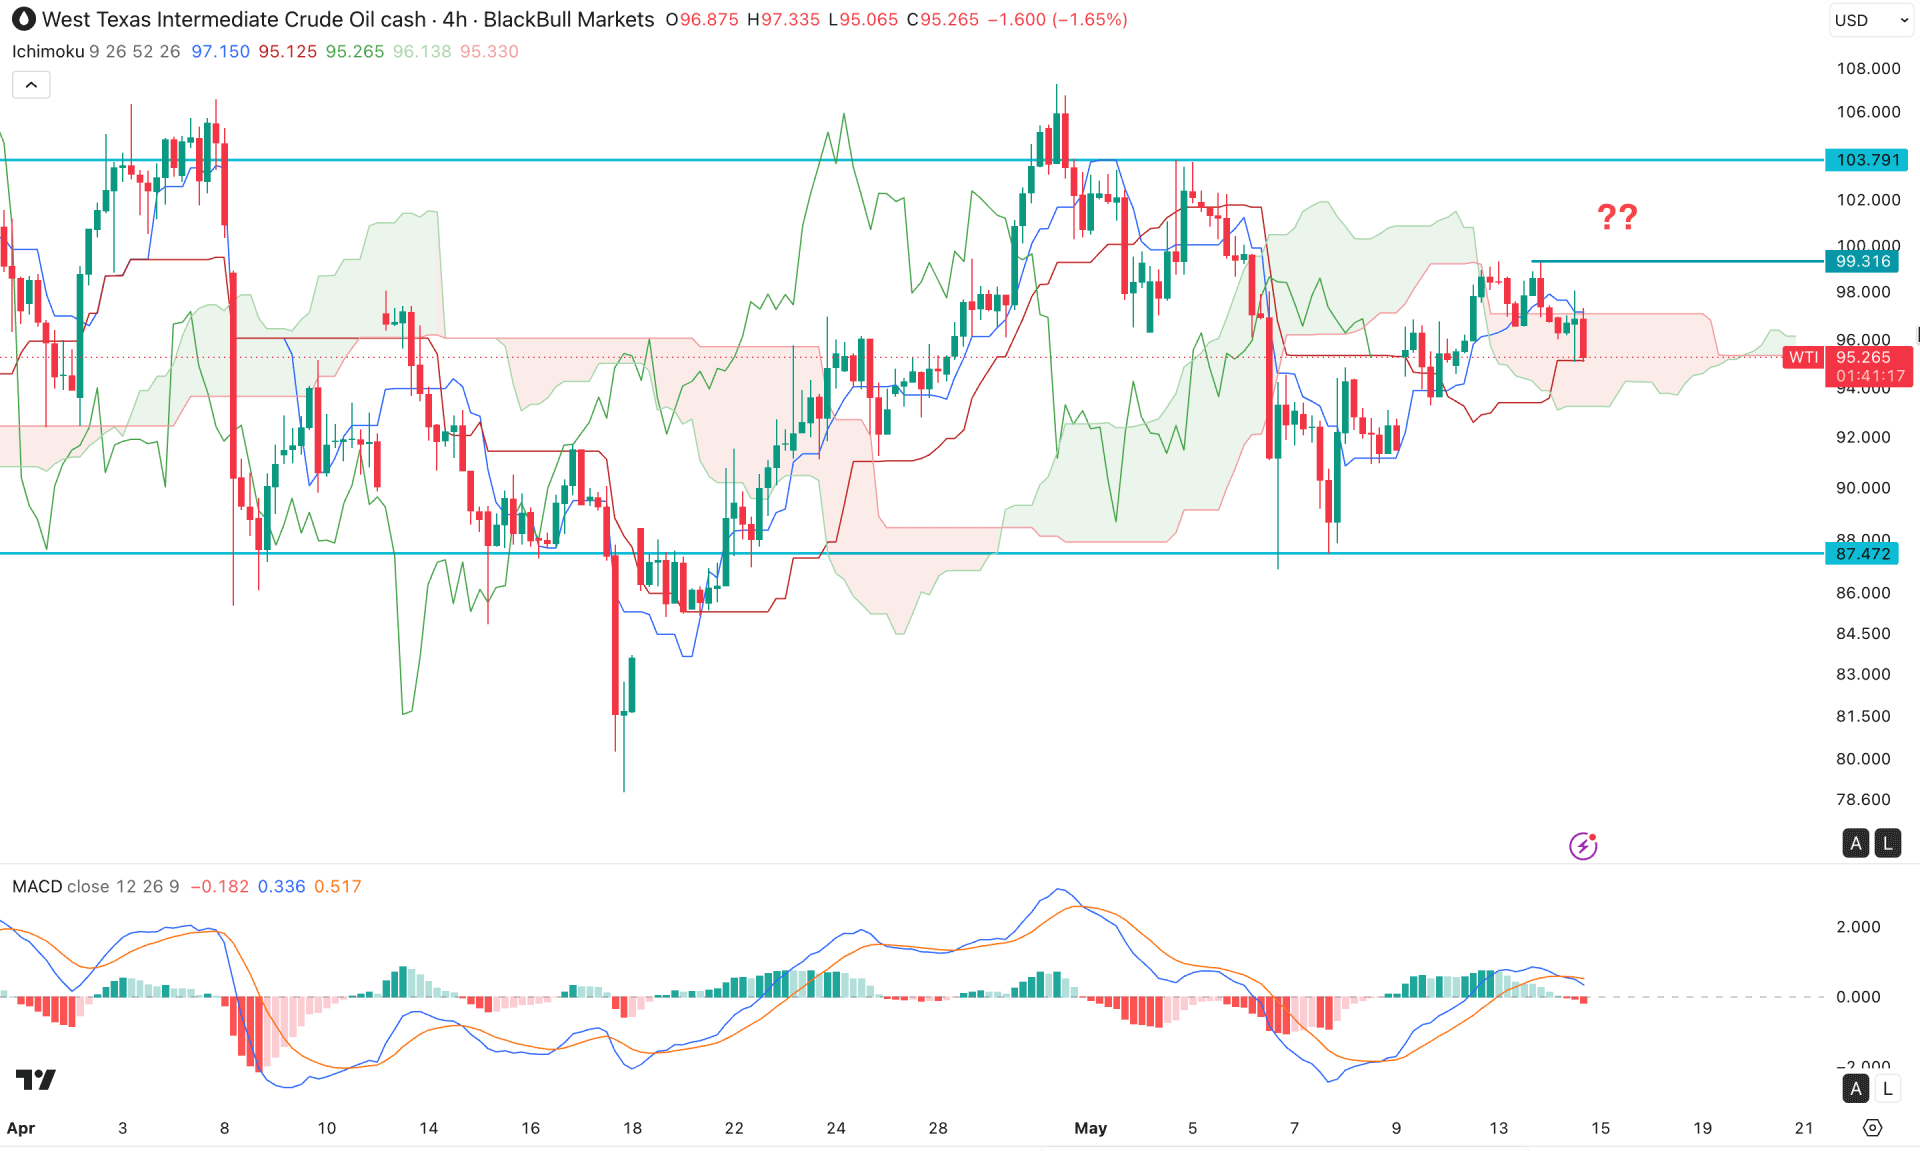
In the four-hour timeframe, the most recent price action is trading within the cloud area, signalling indecision. However, a corrective bullish pressure is visible after making a break below the cloud area and signalling a bear breakout.
The future cloud shows indecision as both lines are flat with a minor gap. Dynamic support lines are also within the current price with no clear trend direction.
In the secondary indicator window, a downside continuation is possible as the MACD signal line has found a crossover at the bullish peak. The histogram follows the sentiment by making multiple vertical lines below the neutral level.
Based on this outlook, a bearish close below the cloud could be a short opportunity targeting the 87.47 support level.
On the other hand, the immediate resistance to look at is 99.31 level, which needs to be overcome before validating the bullish opportunity. The major resistance is at 103.79 level, and overcoming this line could open the room for moving to the 110.00 area.
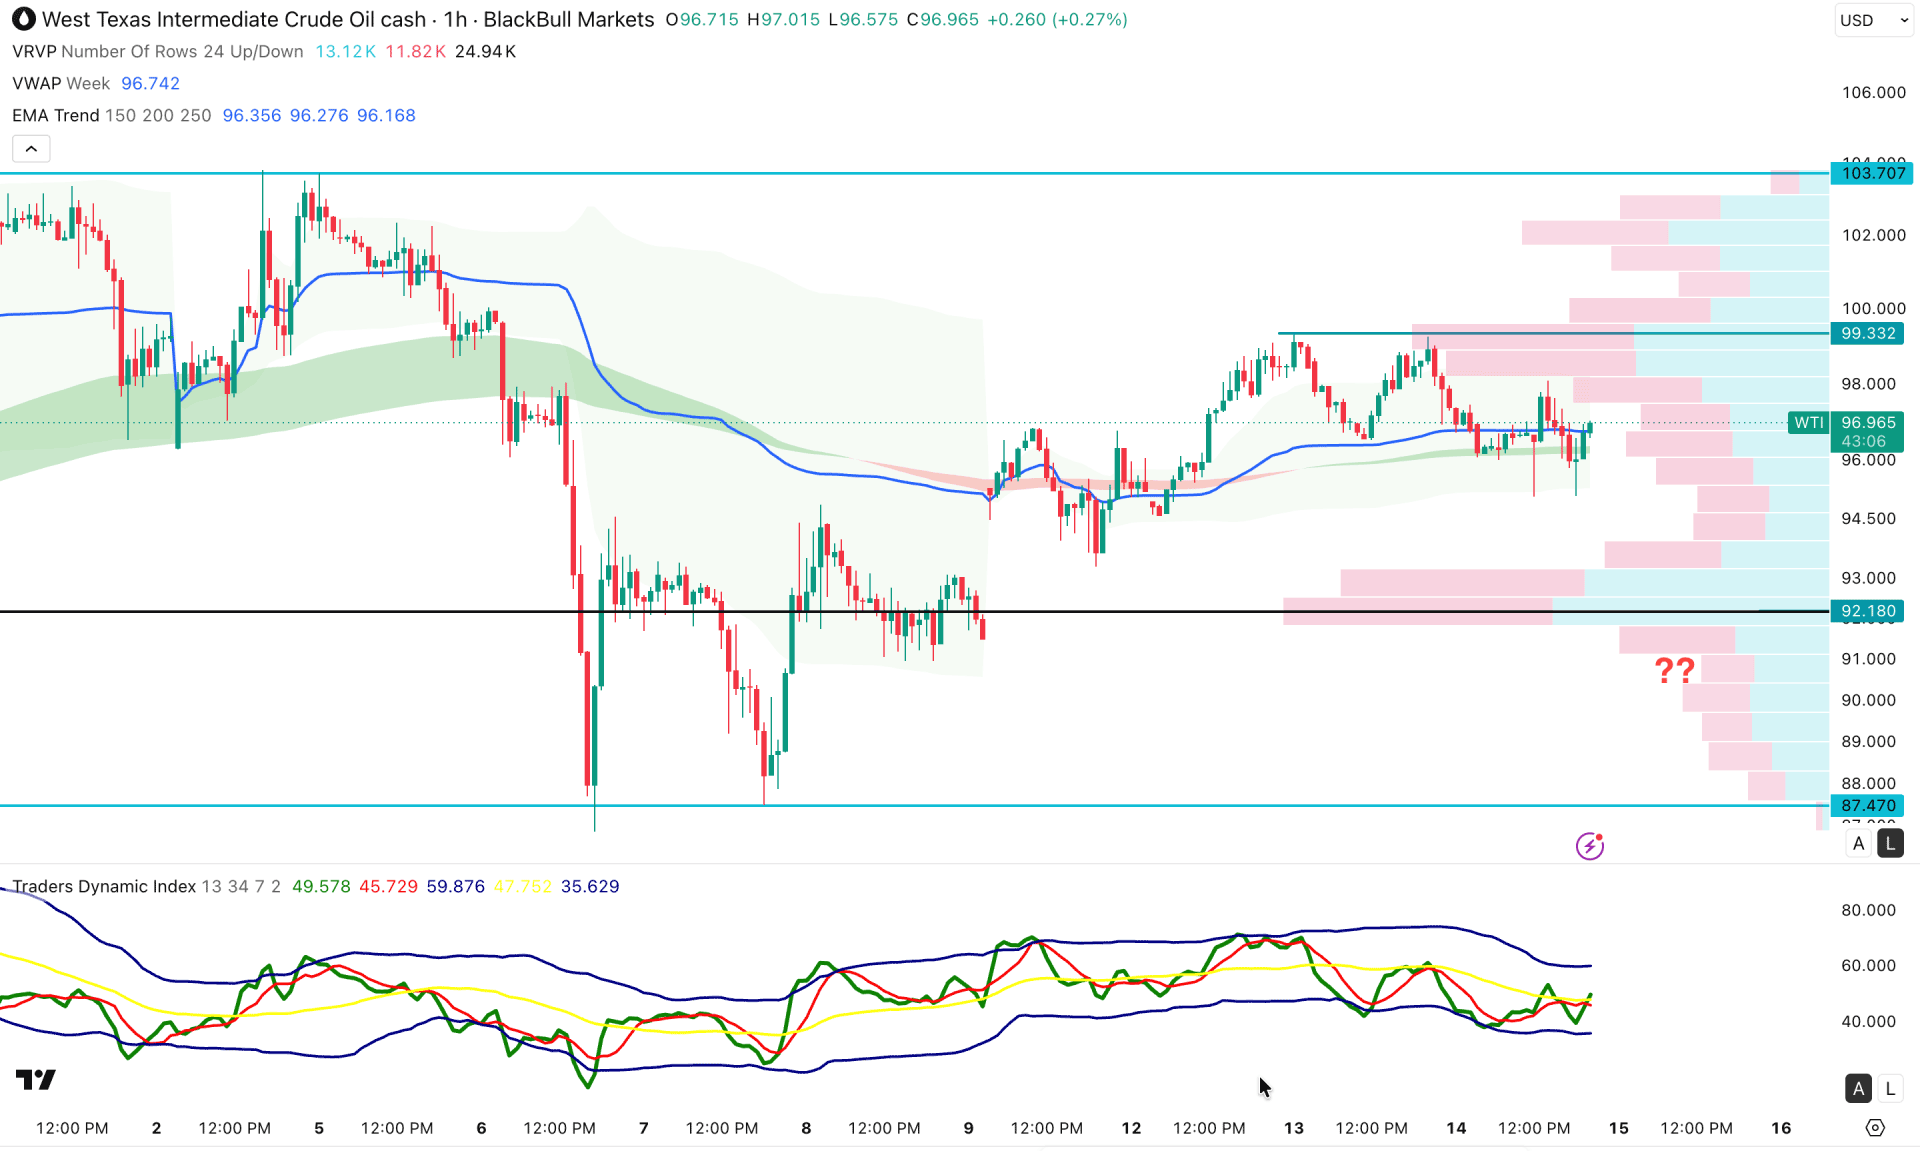
In the hourly timeframe, the price is trading sideways at the weekly VWAP level. Moreover, the entire structure is above the intraday high line, which is working as a major support at the 92.18 level.
In the secondary indicator window, the Trader's Dynamic Index has flipped its position and formed a bullish recovery at the 50.00 area. It is a sign of a possible bullish continuation in the price after having proper price action.
Based on the overall market structure, a bullish rebound with a valid breakout above the 99.33 resistance level could be a long opportunity targeting the 103.70 resistance level.
On the other hand, the ongoing momentum is sideways, where a bearish correction is possible towards the 92.18 key support level.
Based on the market outlook, WTI is trading within extremely volatile conditions. From a higher timeframe, the market price is bullish from a discounted area. In that case, the short-term outlook is bullish, but the long-term bullish continuation might need more clues from a valid breakout above the 100.00 psychological level.


