Published: August 22nd, 2024
Despite weak data from major oil consumers, WTI futures reached their lowest price point since January due to market concerns about demand.
The US nonfarm payroll data was revised almost 820 K from March 2023 to March 2024. Furthermore, the depressing data from China recently kept driving down prices.
According to the most recent FOMC minutes, most policymakers stated that alleviating policy in September might be appropriate if data met demands, which could increase economic activity and oil demand.
According to minutes from the July 30-31 conference of the U.S. central bank, the "vast majority" of administrators indicated that a reduction in interest rates was probable. As a result, the Federal Reserve looked set to lower interest rates in September. Reduced interest rates make borrowing less expensive, which may increase the need for oil and economic activity.
In a phone conversation with Israeli Prime Minister Benjamin Netanyahu, U.S. President Joe Biden emphasized the critical nature of the impending Cairo negotiations and emphasized the urgency of reaching a ceasefire agreement for the Gaza Strip in exchange for hostages.
However, Israel and Hamas militants were unable to reach an agreement in the Palestinian enclosure during the U.S. Secretary of State Antony Blinken's visit to the region earlier this week.
Let's see the upcoming price direction from the WTI technical analysis:

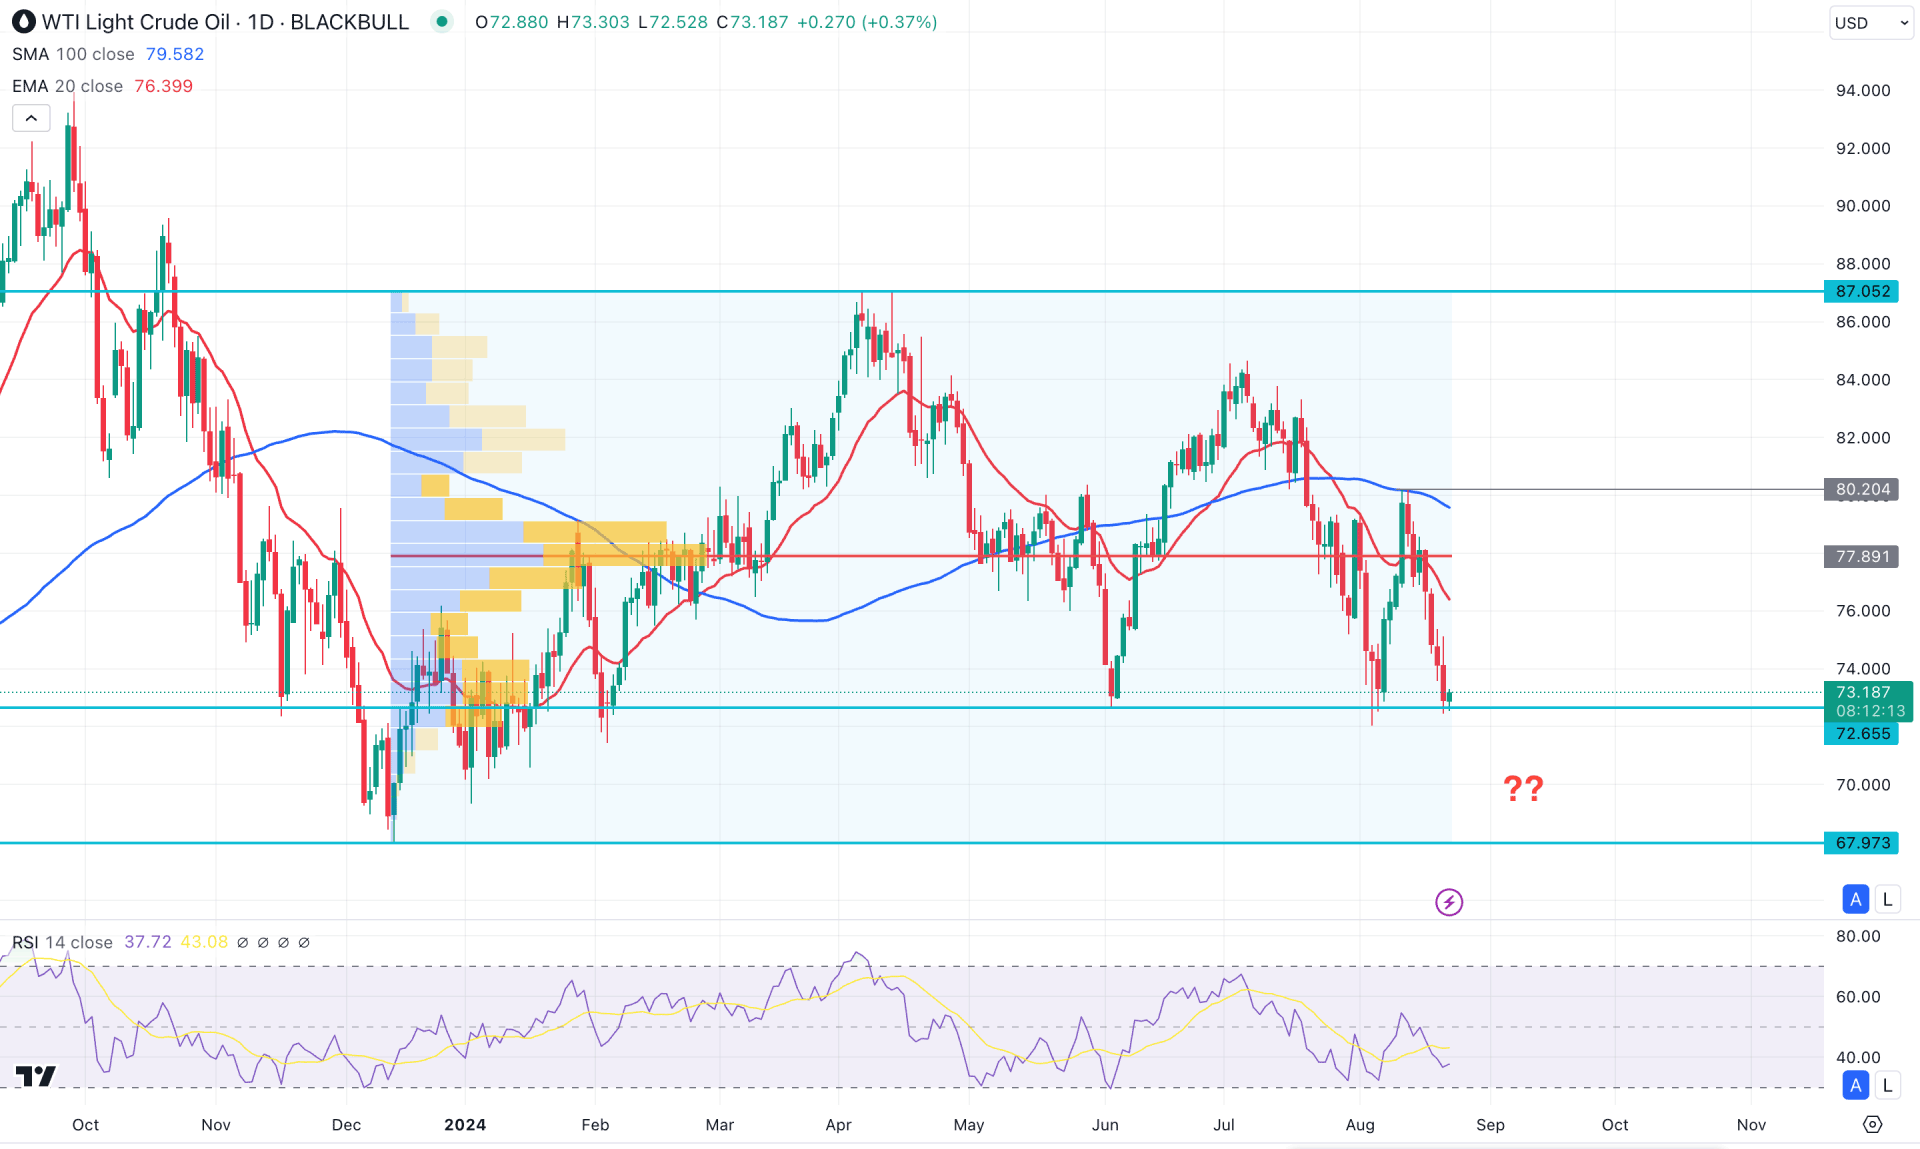
In the daily chart of WTI, the ongoing market pressure is extremely corrective, as a stable market trend has not been present since April 2024. Moreover, the most recent price reached the crucial support of the June 2024 low, which signals more downside pressure.
In the higher timeframe, the ongoing monthly candle remains bearish, reaching below the July 2024 low. Moreover, the latest weekly candle trades bearish with an inside bar formation. It is a sign of a bearish continuation signal, which a valid price action formation might validate.
In the volume structure, the selling pressure is also visible as the most active level since December 2023 is at the 77.85 level. In that case, investors might expect downside pressure until a new high volume level appears below the current price.
In the main price chart, the 100-day Simple Moving Average and 20-day Exponential Moving Average remain steady above the current price with a bearish slope. Moreover, the Relative Strength Index (RSI) remains below the 50.00 line with a possibility of reaching the overbought 30.00 area.
Based on the daily market outlook of WTI Crude Oil, investors should closely monitor how the price trades at the near-term support level. A bearish continuation with a daily candle below the 72.65 level could signal a downside continuation, aiming for the 67.97 support level.
On the other hand, a bullish reversal with a daily close above the 77.89 high volume line could be a bullish signal, aiming for the 87.00 resistance level.

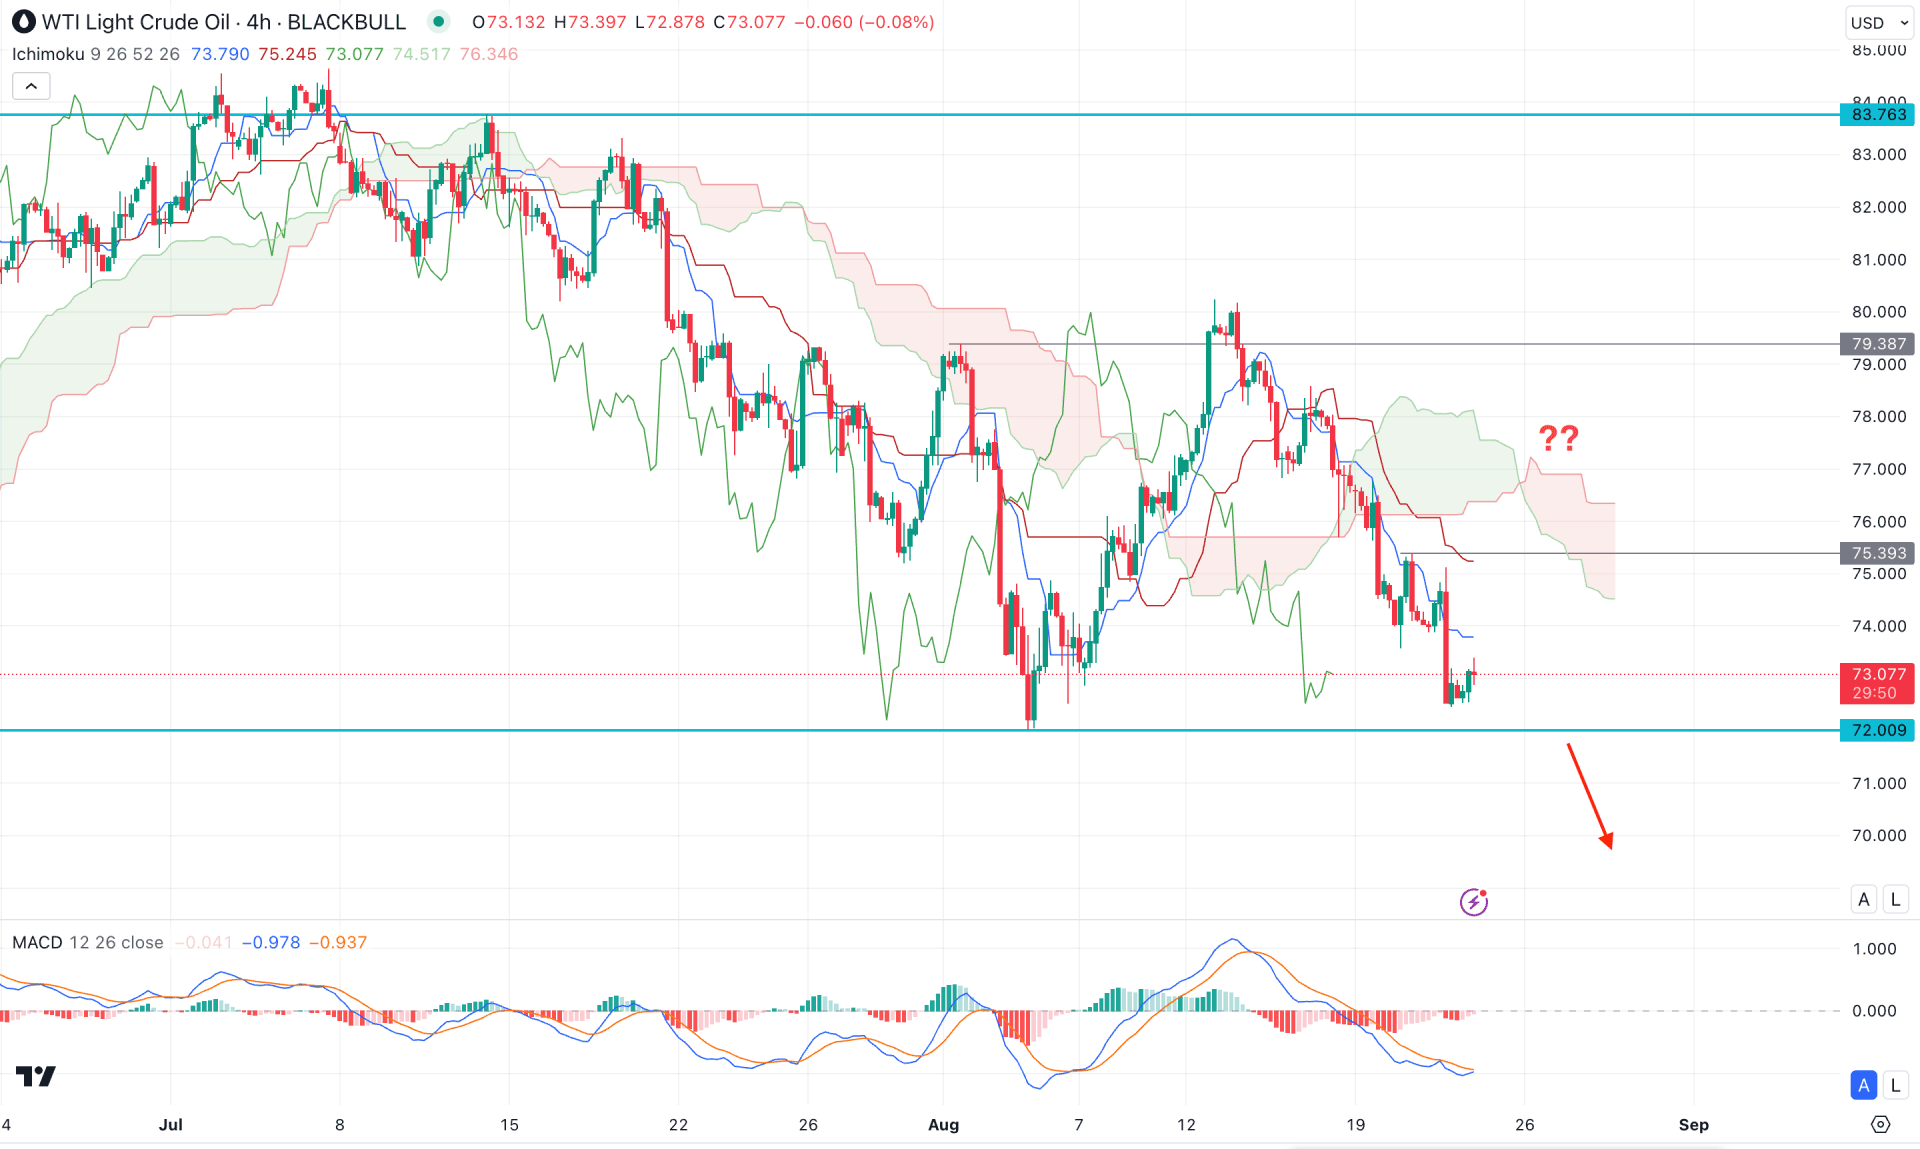
In the H4 chart, the recent price trades below the Ichimoku Cloud zone, suggesting a bearish continuation signal. However, the crucial static support of 72.00 level is still protected, keeping the last hope for bulls.
In the future cloud, both lines remain steady towards the bearish side, while the MACD Histogram remains corrective at the neutral point.
Based on the H4 structure, a bearish continuation opportunity is present as long as the current price trades below the 75.39 resistance level. In that case, the primary aim would be to test the 70.00 psychological line.
On the other hand, a valid bullish reversal with a cloud breakout needs an H4 close above the 79.39 level. In that case, the upside possibility could take the price towards the 83.00 area.

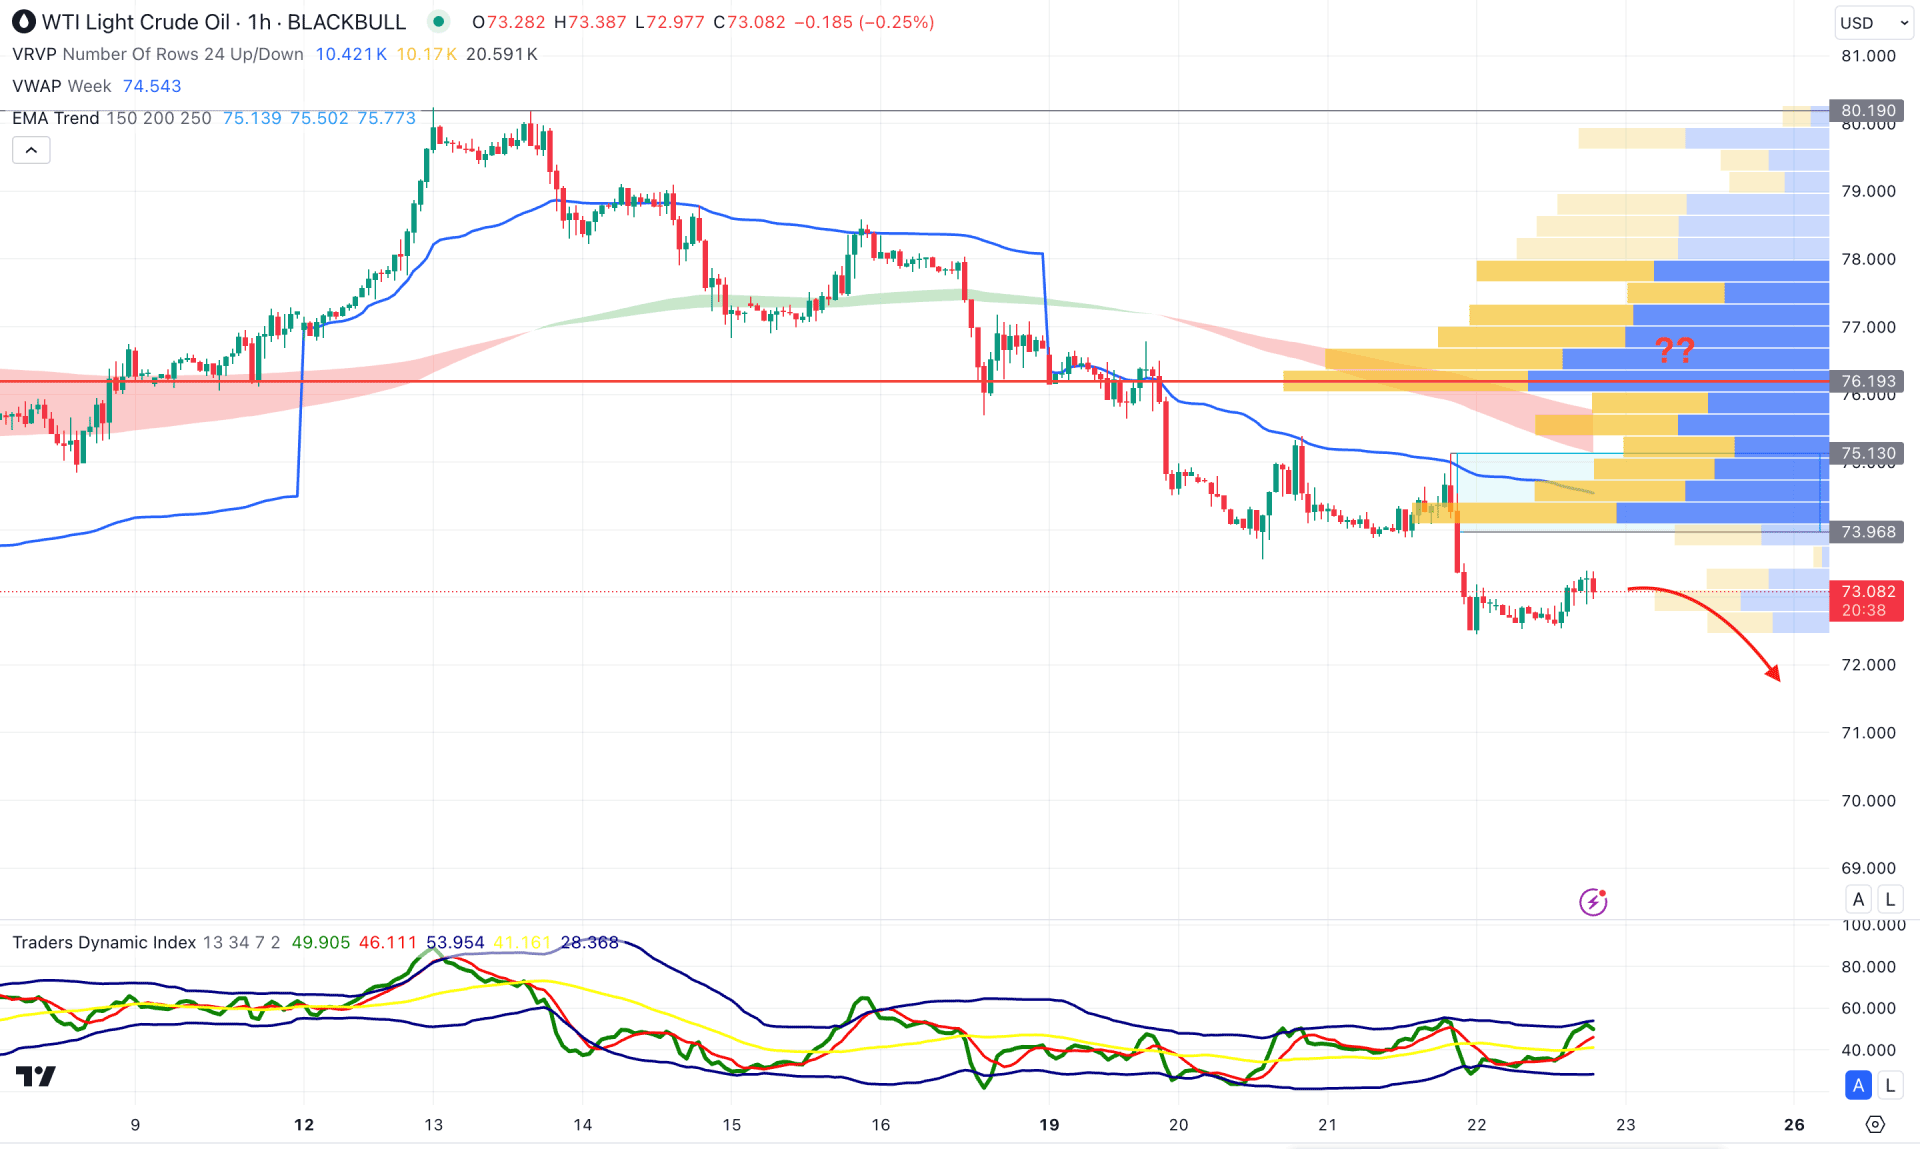
In the hourly chart, the WTI is trading within a bearish continuation signal, where the visible range high volume level is above the current price. Moreover, the immediate supply zone at the 75.10 to 73.89 zone could be a crucial bearish signal, extending the downside pressure below the 70.00 area.
In the indicator window, the Traders Dynamic Index (TDI) reached the overbought level, suggesting a peak in the main price chart.
Based on this outlook, a bearish continuation is highly possible as the MA wave and weekly VWAP are above the current price. On the other hand, a massive bullish reversal with an hourly candle above the 76.19 level.
Based on the current market structure, the WTI price is under pressure as the current price hovers at the multi-week low. Investors should closely monitor how the price trades at this level as a bearish continuation is highly possible with a valid break.