
Published: November 6th, 2025
After three days of declines WTI crude is slightly up. However, when a large inventory build raises fears about oversupply, oil prices can drop even more. Crude oil stocks increased by 5.202 million barrels last week, reversing the prior fall of 6.858 million barrels, according to data from the United States Energy Information Administration (EIA).
October saw a third consecutive month of declines in global oil prices due to concerns about excess supply as OPEC and the allies boost output while non-OPEC producers continue to expand production.
According to a client note from the JP Morgan, global oil demand increased by 850,000 barrels each day in the year ending November 4, falling short of earlier projection of 900,000 bpd.
In response to a saturated market as OPEC+ countries increase output, Saudi Arabia, the world's biggest oil exporter, drastically cut the price of its crude for Asian clients in December.
Let's see the complete outlook from the WTI technical analysis:
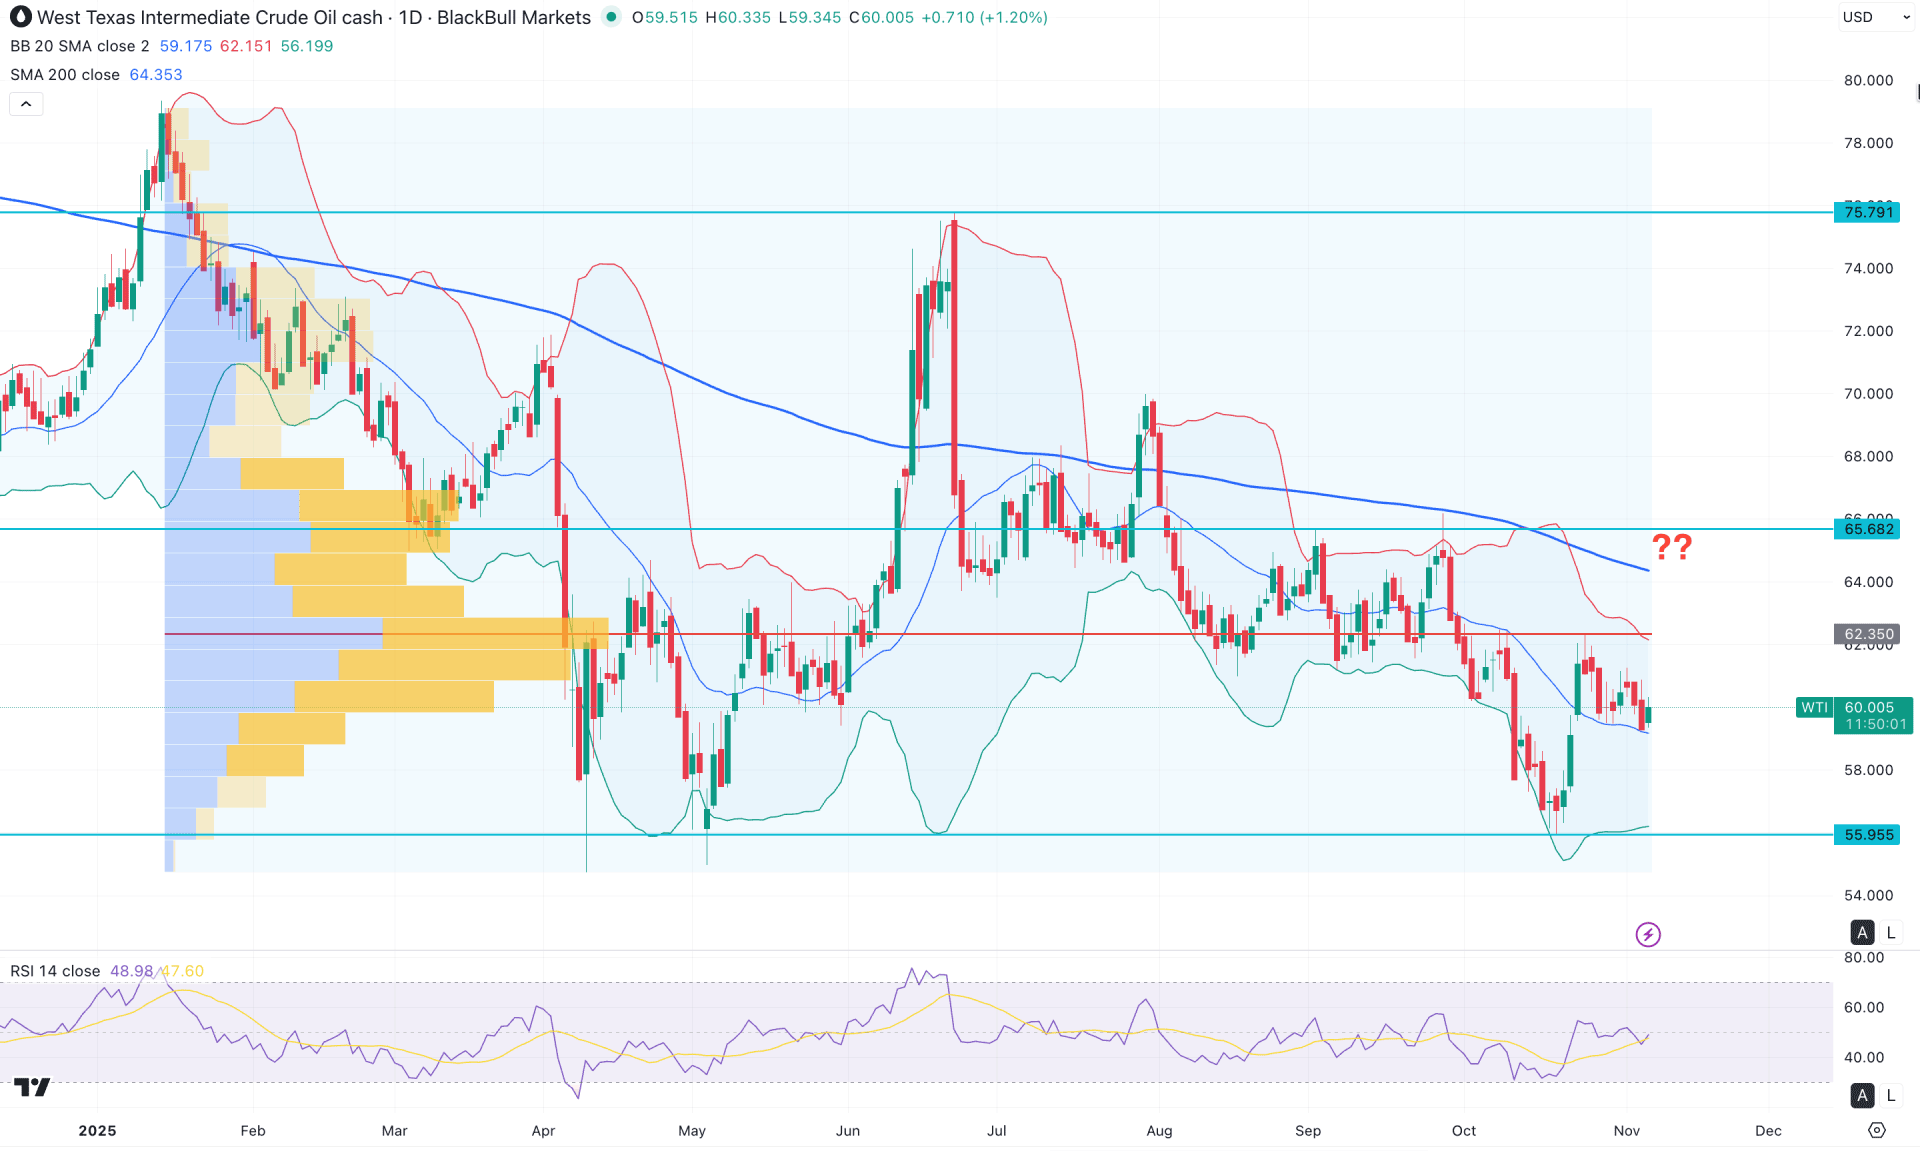
In the daily chart of WTI, the major market momentum remains bearish as the price continues to fall, following a strong liquidity sweep at the September 2025 high. As a result, a new swing low has formed at the 56.02 level, which could be a crucial area to watch.
In the higher timeframe, the monthly candle suggests consecutive bearish closes, with the most recent one continuing the downward momentum. As no significant reversal is seen in the monthly timeframe, we may consider the ongoing bearish pressure likely to extend further.
On the other hand, a weekly engulfing pattern has formed in the weekly timeframe, showing a failure to create a new swing high. This indicates seller dominance in the market, which could drive the price below the existing low of 55.00.
In terms of momentum, selling pressure remains strong as the price recently tested the 62.35 resistance level before continuing lower.
Currently, the price is trading near the equilibrium area, supported by the main Bollinger Band midline. However, the 200-day SMA is acting as a strong resistance above the mid-band. A failure to hold above the Bollinger midline could intensify bearish pressure at any time.
In the secondary indicator window, the Relative Strength Index (RSI) is hovering near the 50.0 neutral level, showing no signs of either an oversold or overbought condition.
Based on this outlook, investors should closely monitor how the price reacts near the Bollinger midline. A daily close below 56.10 could present a potential short opportunity, targeting the 55.00 area.
On the other hand, a strong bullish reversal above the 62.35 resistance level is needed before considering any long positions. A stable price above the 200-day SMA could trigger a high-probability long opportunity, targeting the 75.79 level.
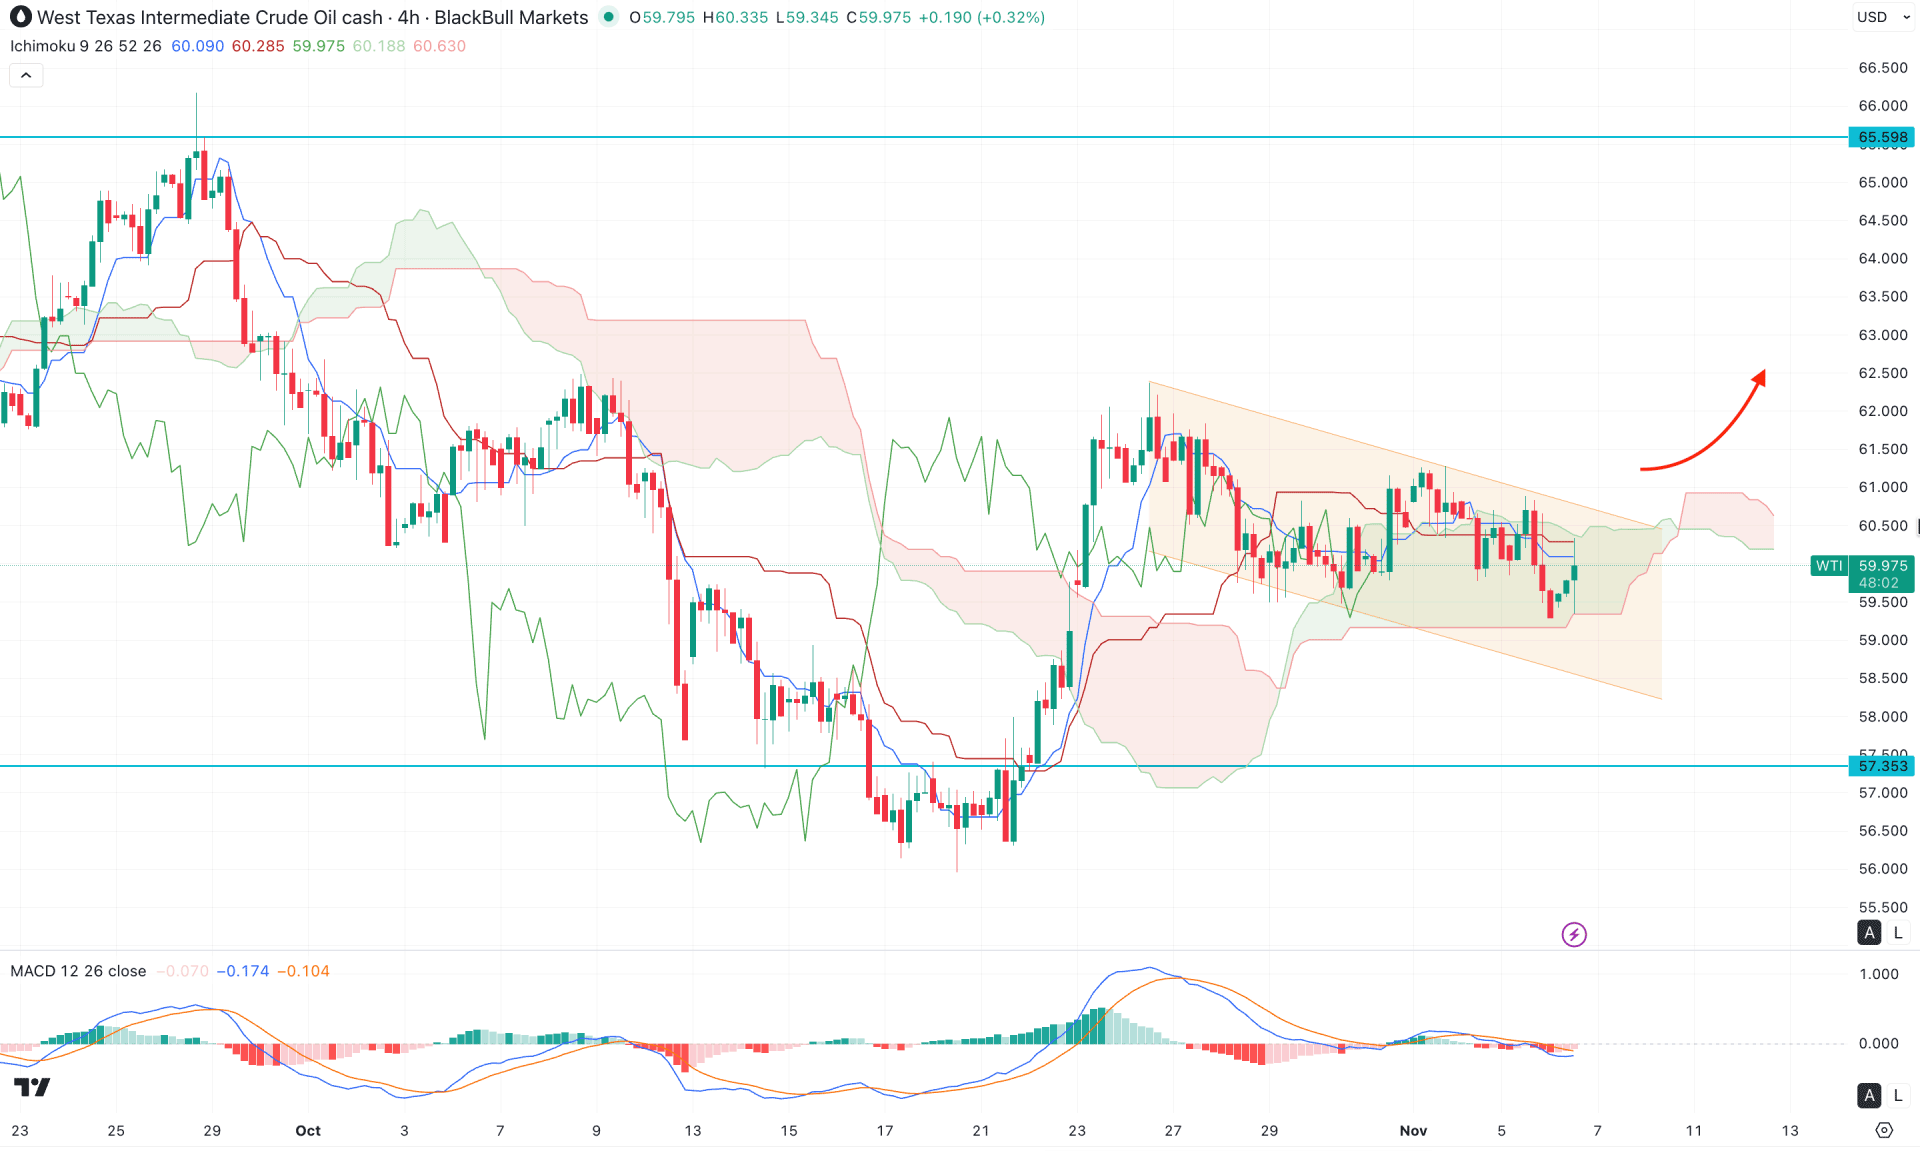
In the four-hour timeframe, the WTI price is showing a different scenario, where a bullish pre-breakout structure is visible. After forming a valid bullish Ichimoku cloud breakout, the price has stalled above the cloud area, moving within a descending channel.
In the secondary indicator window, the Relative Strength Index (RSI) remains flat near the neutral zone, indicating no strong trend formation in the main price movement.
On the other hand, the future cloud remains bearish, as both leading span lines are pointing downward with a sideways momentum. The near-term Kijun-sen level is also acting as a resistance, which must be overcome before a bullish setup can form.
Based on this outlook, a bearish correction remains possible as long as the price trades within the descending channel. A further rejection from the key resistance level could offer a potential short opportunity, targeting the 58.00 level.
Conversely, a bullish breakout and a stable price above the 61.00 level could open the way for a long opportunity, initially targeting 63.00, and potentially extending toward the 65.59 resistance level.
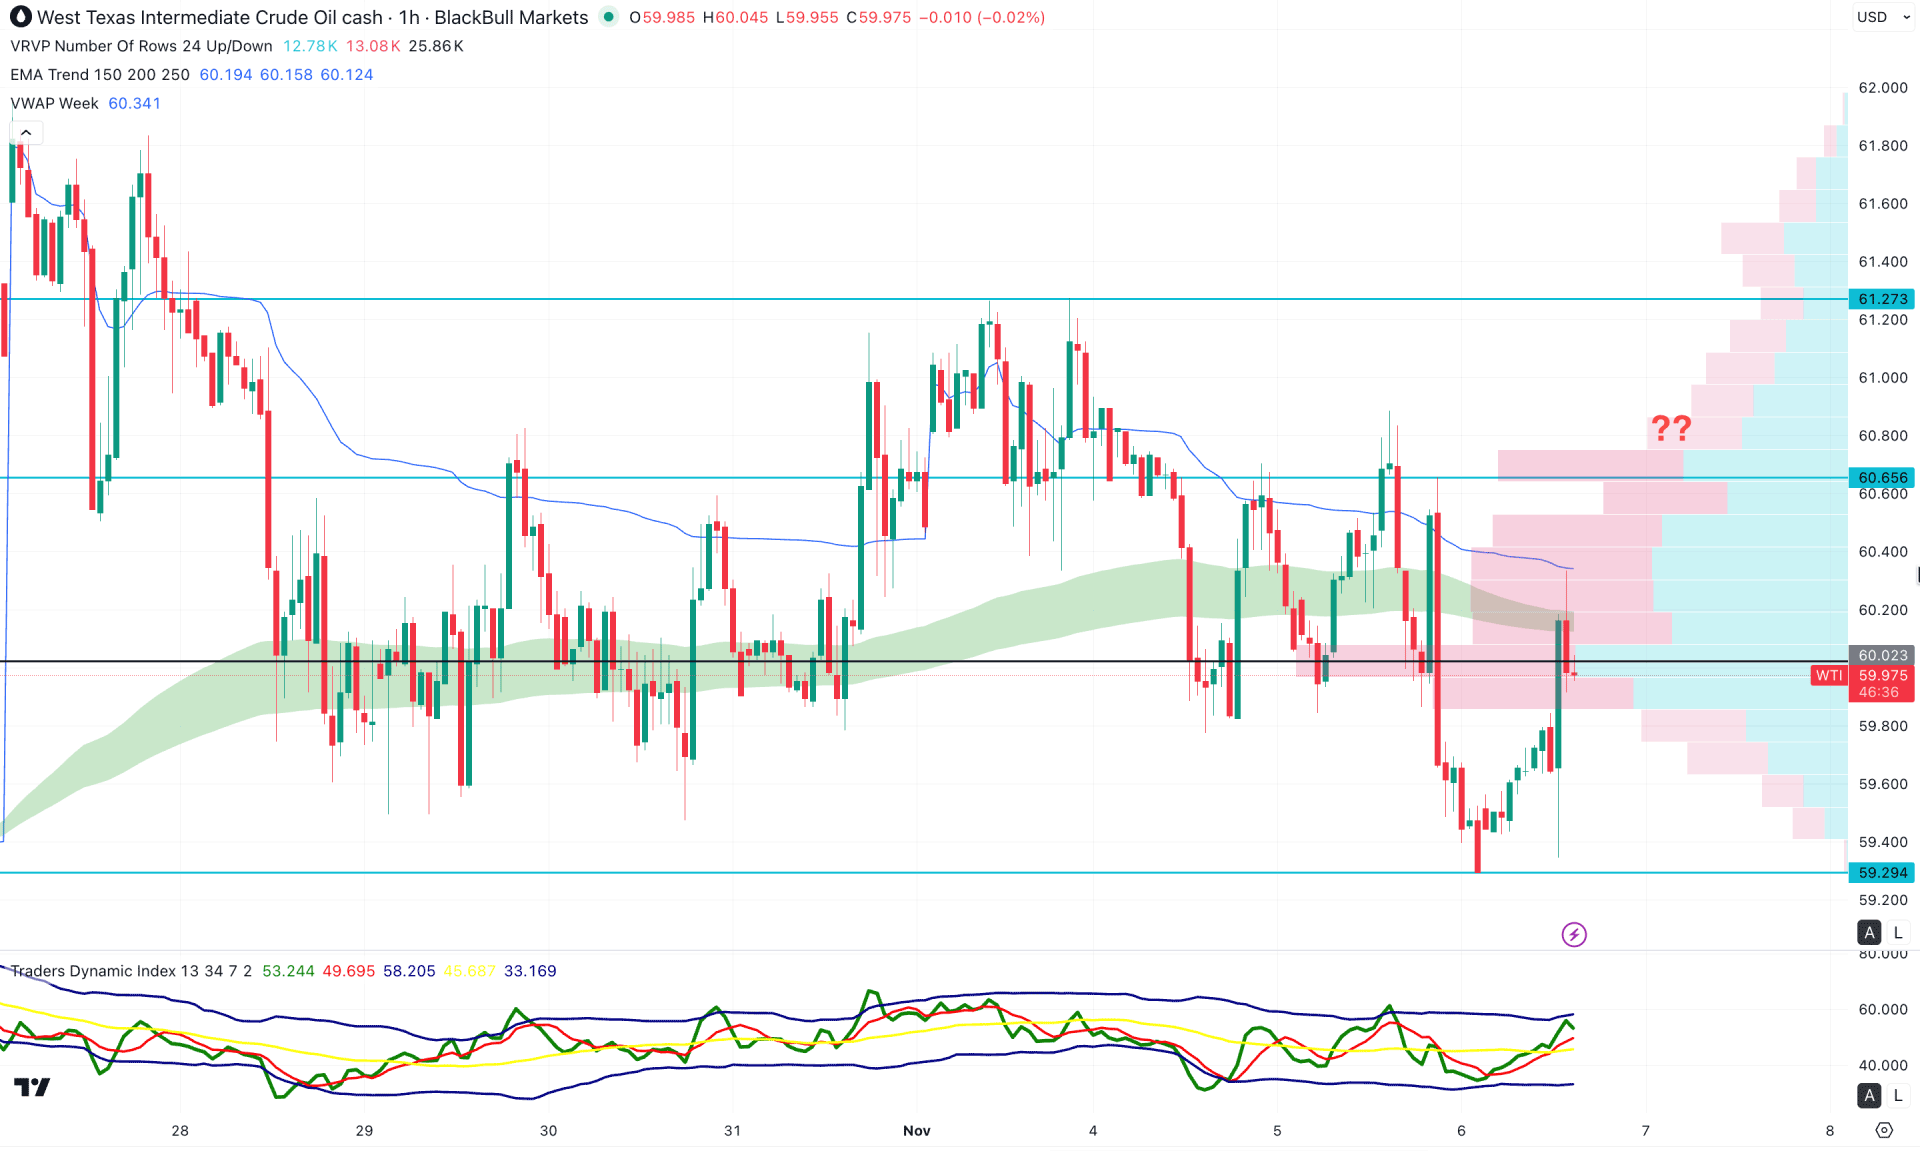
In the hourly timeframe, a corrective market momentum is visible. The exponential moving average (EMA) is acting as an immediate resistance, reinforced by selling pressure from the weekly VWAP level.
In the secondary indicator window, the Traders Dynamic Index (TDI) is trading above the 50.00 neutral line, suggesting a potential overbought market condition.
Based on this outlook, more confirmation is needed before anticipating a long opportunity. A bullish breakout above the 60.56 resistance level could invalidate the current bearish structure and signal a change of character. In that case, the price may face the near-term resistance at 61.27 before advancing toward the 62.00 area.
Alternatively, traders may look for a bearish continuation setup, as the recent bearish rejection from the 60.02 high-volume resistance level could serve as a crucial signal. In that scenario, the price has a higher probability of continuing lower to retest the 59.60 support zone, and potentially extending toward the 59.29 area.
Based on the market structure, WTI is trading under intensifying bearish pressure, with the overall market momentum still weak. The pattern formed from the broader supply zone, along with the failure to establish a solid bottom near the monthly low, suggests a potential downside correction may be pending. Investors should closely monitor how the price reacts to a range breakout before considering any short opportunities.


