

Published: October 1st, 2026
Crude oil prices rose above $91 per barrel as signs of tighter fuel availability in China intensified concerns about disruptions across global energy markets.
PetroChina has reportedly pulled several gasoline and jet-fuel shipments originally planned for October, with Chinese authorities looking to maintain sufficient domestic stockpiles.
The development comes as oil markets continue to navigate supply disruptions linked to tensions between the US and Iran, alongside the ongoing war in Ukraine. However, fears of a major crude supply shortfall have eased somewhat after Saudi Arabia resumed tanker operations at Yanbu following the restart of its East-West pipeline.
Shipments of Middle Eastern crude were nearing pre-conflict levels, although supplies of refined products remained relatively constrained.
Market participants are also closely watching diplomatic efforts, as uncertainty continues around potential US-Iran negotiations and their impact on WTI prices.
Let's see the next aspect of this instrument from the WTI technical analysis:
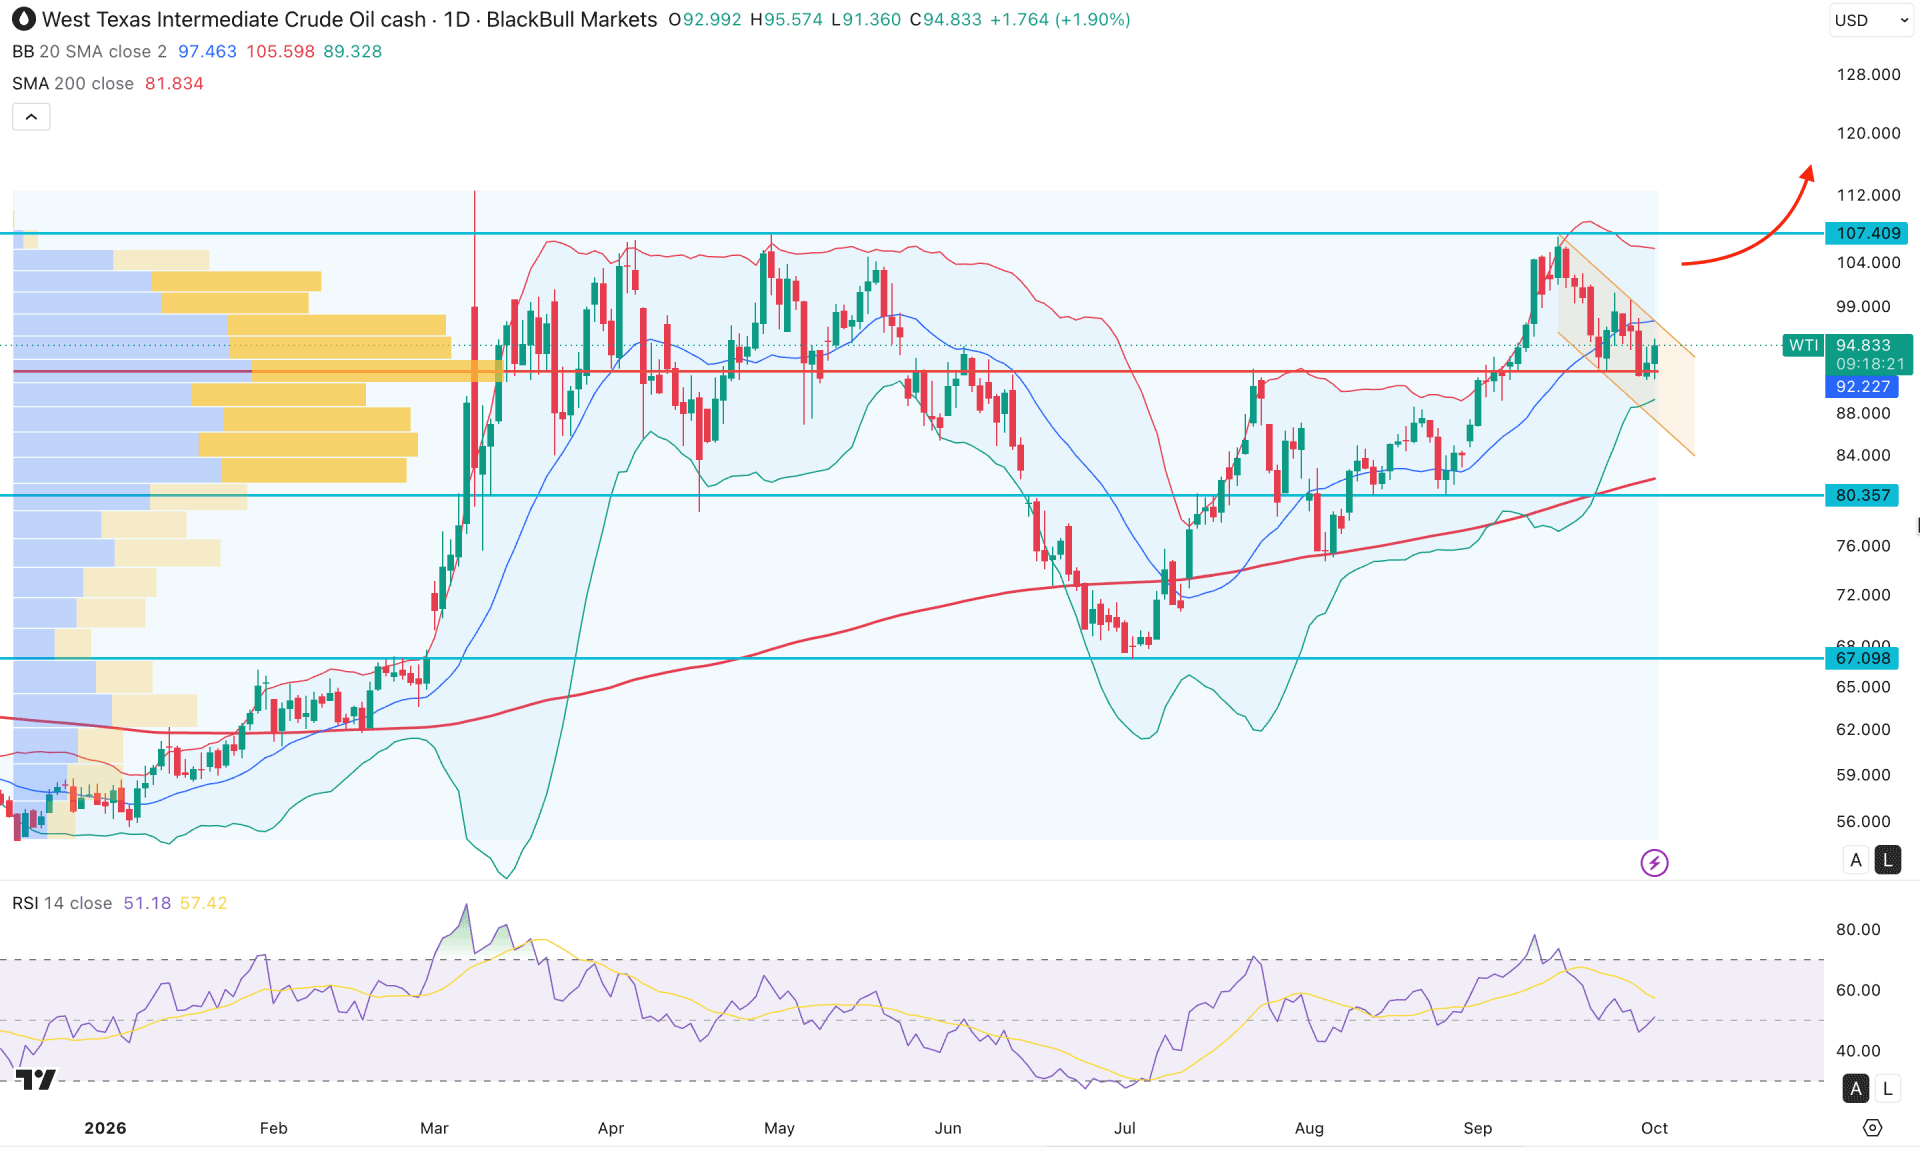
On the WTI daily chart, momentum remains bullish, supported by an extended bullish factor from geopolitical uncertainty. The price created a valid top in April 2026 before making a decent downside correction in July 2026. As the current price is testing the yearly high again, investors might expect buying pressure soon.
On the higher timeframe, price action looks positive for buyers, even with high volatility. The monthly candle has been trading bullish for four consecutive months, followed by selling pressure in July 2026. As a result, the weekly timeframe formed a valid V-shape recovery, creating a new swing high at the 107.40 level.
The volume structure looks positive, as the most active level since December 2025 is at the 92.227 level, which is just below the current price. Primarily, a bullish price action is visible above the high-volume line, where the entire market structure is bullish. In that case, any bullish signal could serve as a valid trend-continuation signal.
In the main price chart, a sideways market is present, as the most recent price is trading bearishly within a descending channel. Although the 200-day SMA shows bullish strength above the 80.357 crucial support level, there is no sign of a bearish reversal.
The Bollinger Bands suggest a corrective bearish momentum, as the recent price action is within the mid and lower Bollinger Band area. The price is testing a high resistance level, but it needs to overcome the mid Bollinger Band line to validate the long opportunity.
In the indicator window, the Relative Strength Index (RSI) rebounded lower and reached the 50.00 neutral level, signaling indecision. Because the recent rebound from the 70.00 level showed no significant divergence, we may view the current selling pressure as a minor downside correction.
In the WTI daily structure, the price is trading within a descending channel. A bullish break with the recovery above the mid Bollinger Band line could be the first sign of a bullish trend continuation. On the upside, the immediate resistance to watch is 107.40, and breaking above it could increase the chance of testing the 120.00 area.
On the other hand, the gap between the current price and the 200-day SMA has expanded, creating more downside possibility. The price is also trading within a descending channel, from which a channel extension is possible. A break below 92.227 could be bearish, with the ultimate target testing the 80.357 support level.
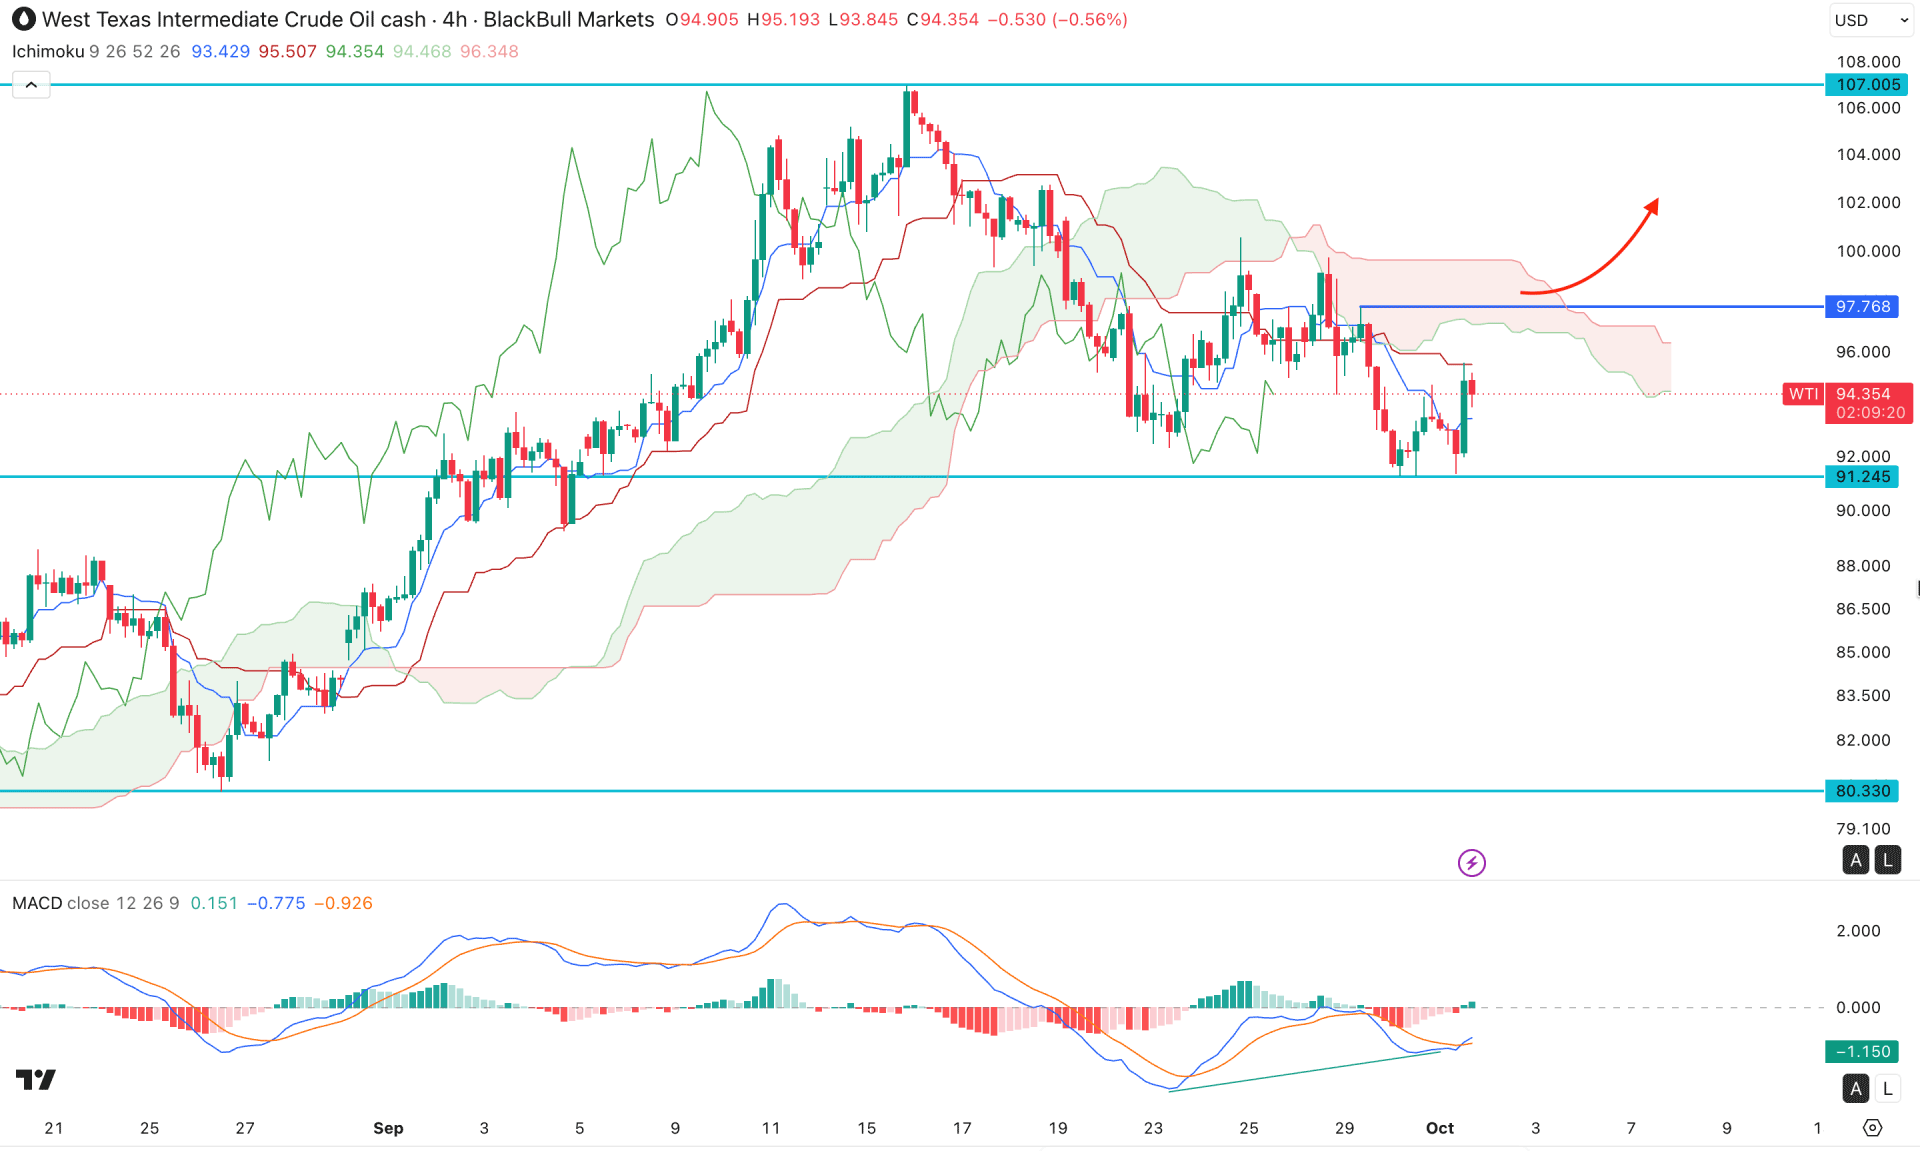
On the four-hour timeframe, WTI price has rebounded and formed multiple swing lows below the cloud resistance area. Moreover, price retested the cloud resistance before creating a new low at 91.245.
As a result, the Future Cloud has flipped its position, where the dynamic Kijun line is acting as an immediate resistance.
Although price is trading below the cloud resistance, selling pressure could be limited by the MACD indicator. Based on the current reading, a divergence formed after testing the 91.245 support level, where the signal line failed to follow the momentum. This suggests a primary possibility of a rebound, but price action may need to confirm it.
Based on this structure, the immediate swing high to watch is 97.768, which could be a key barrier for sellers. A four-hour close above this line could increase the chance of testing the 107.40 resistance level.
On the other hand, the price is already trading below the cloud resistance, where the dynamic lines are close to the current price. In that case, a bearish continuation with a four-hour close below the Tenkan support level could create a new swing low below the 91.245 level and test the 84.500 area.
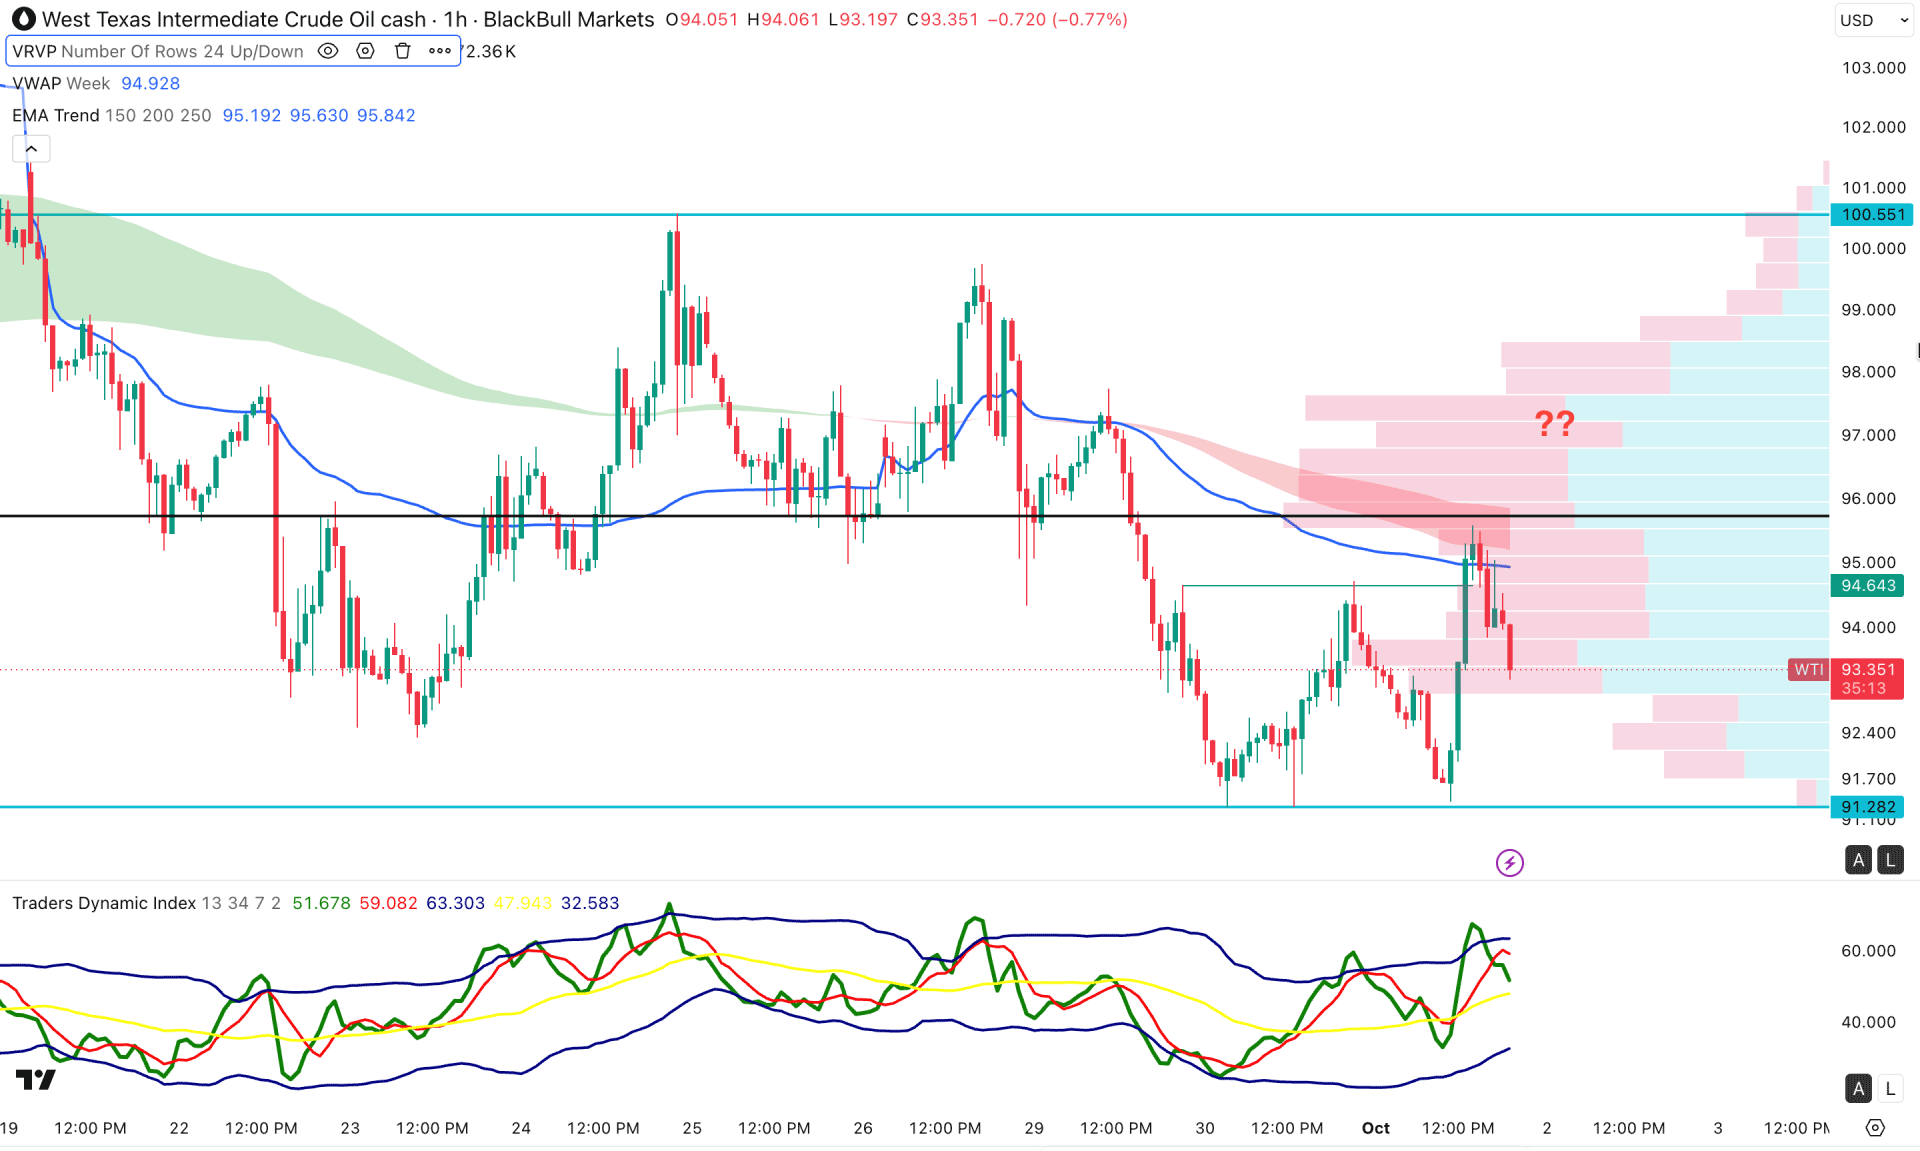
On the hourly timeframe, WTI is trading within a bearish structure, as the most recent price formed a sell-side liquidity grab at the 94.64 resistance level. As price rebounds lower from the weekly VWAP resistance, the primary anticipation is to look for short trades only.
Across the structure, the high-volume line sits at 96.492, acting as a key resistance level just above the Exponential Moving Average wave. Price is trading below multiple key resistances, signaling active selling pressure.
In the indicator window, the Traders Dynamic Index has reached the overbought area and is rebounding toward the 50.00 level. This signals weak buying pressure in the market, with room for bearish momentum to extend.
Based on the overall market structure, ongoing selling pressure from the weekly VWAP level could push price toward the 91.282 support level.
On the other hand, a bullish recovery is possible on the daily chart, where a move above 96.517 would open the way for a test of the 100.55 resistance area.
Based on the overall market structure, WTI is trading under minor selling pressure on the daily chart. Moreover, the hourly price is strongly bearish. In that case, a major bullish breakout is needed before following the structure shown on the daily chart.


