
Published: February 12th, 2026
As per the latest report, US crude oil inventories increased by 8.53 million barrels, according to the Energy Information Administration (EIA), far more than the market had anticipated. Although total inventories are at 428.8 million barrels, about 3% below the five-year median for this time of year, the steep weekly increase raises new questions about the US's short-term inventory-demand balance.
However, ongoing hostilities between the United States and Iran continue to hinder WTI's growth. Following his conversation with Israeli Prime Minister Benjamin Netanyahu, US President Donald Trump confirmed that talks with Tehran will continue, but said no hard decisions were reached. To maintain a geopolitical risk differential in oil prices, he added that further military operations in the Middle East remain possible if an agreement cannot be reached.
With regard to global supply, the Organization of the Petroleum Exporting Countries (OPEC) maintained its outlook for non-OPEC production while leaving its demand growth projections for 2026 and 2027 at 1.38 million and 1.34 million barrels each day, respectively, unchanged.
Investors' focus now shifts to the International Energy Agency's (IEA) report next month, which may once again highlight the possibility of a global surplus, which could put additional pressure on WTI should this come to pass.
Let's see the complete market outlook from the WTI technical analysis:
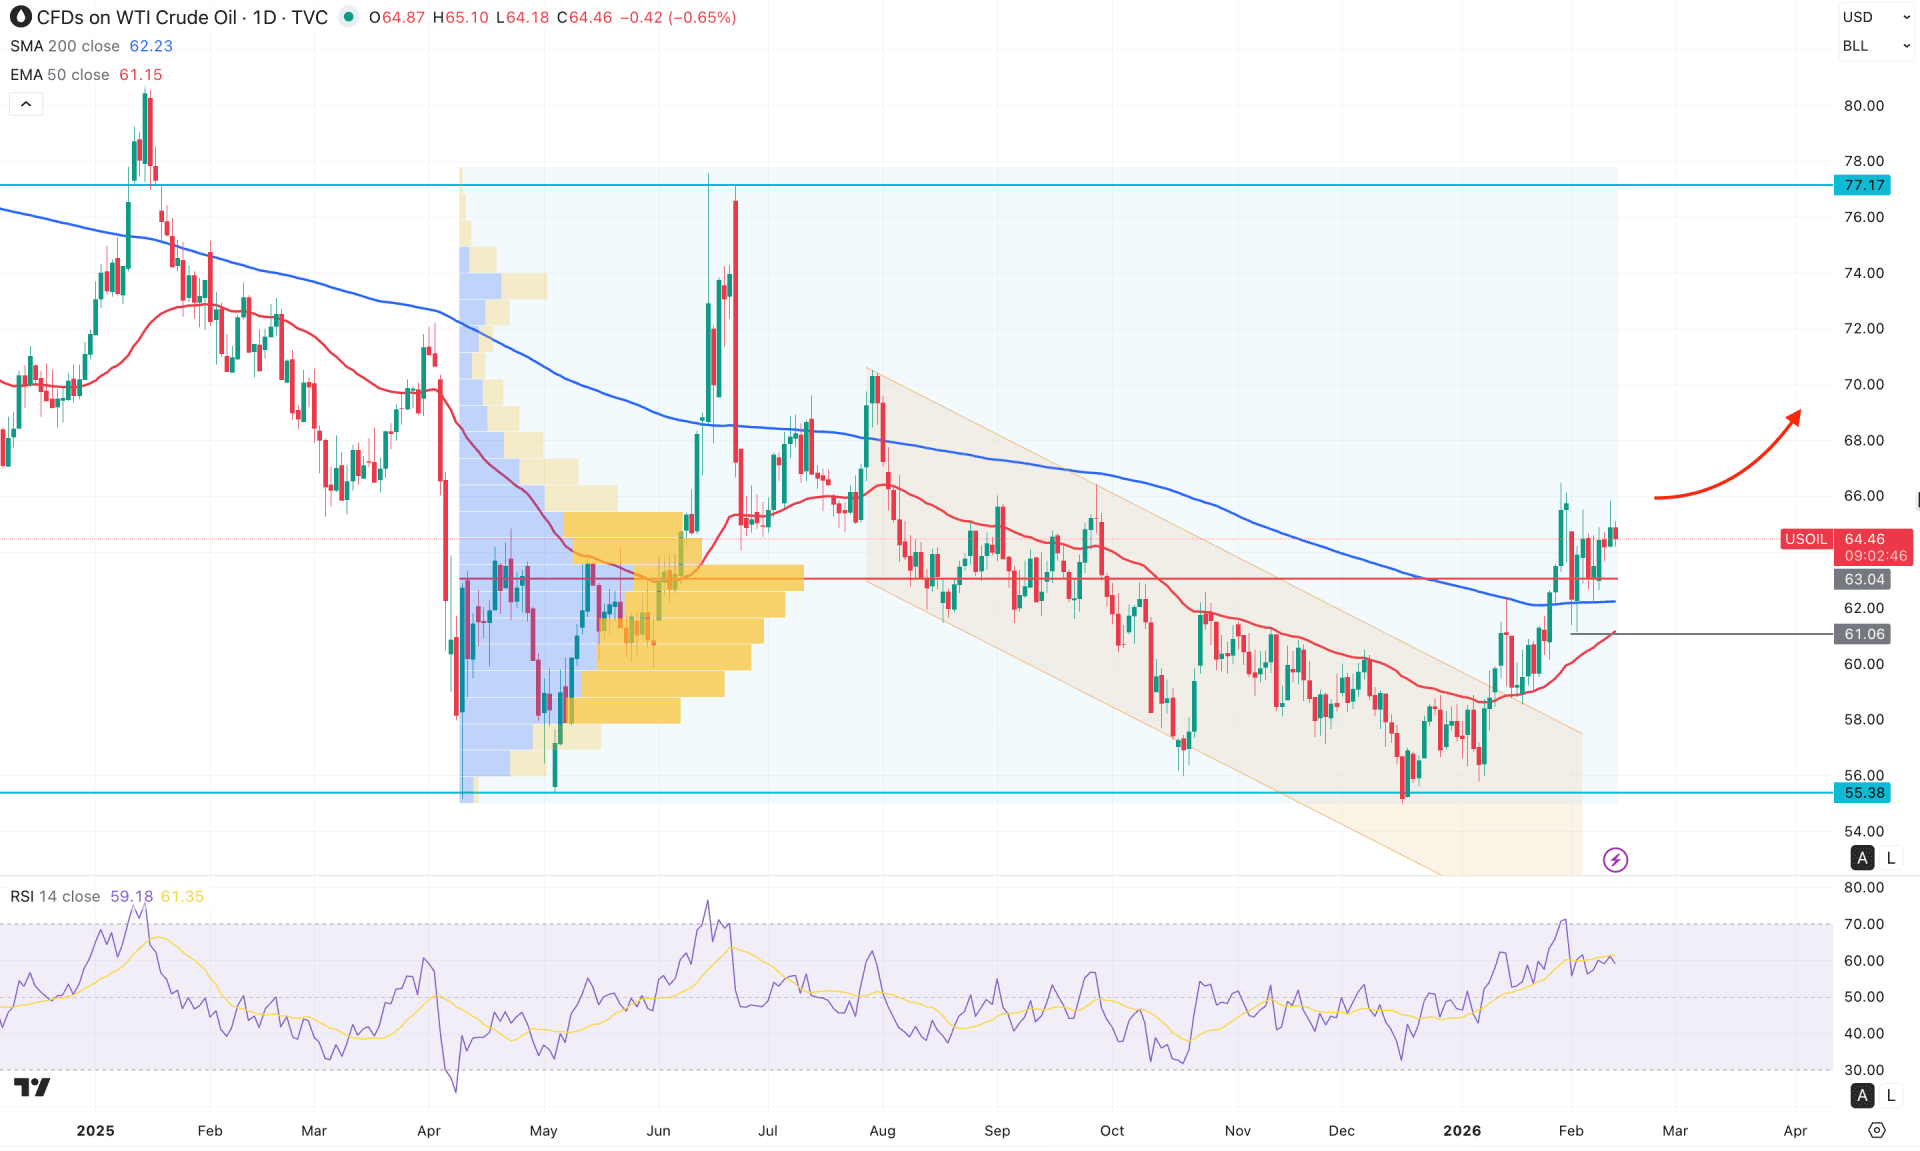
On the daily timeframe, WTI crude oil is regaining momentum, with recent price action signaling a bullish rebound from the 55.38 support level. With the price rising following a breakout from a descending channel, the primary anticipation is to look for long opportunities.
In terms of volume, a bullish reaccumulation phase is evident, as the current price is trading sideways just above the high-volume node at 63.04. Primarily, a bullish order-building phase appears to be underway, from which a range breakout could initiate a stable trend at any time.
On the higher timeframe, the monthly chart represents a strong recovery, with the January 2026 close forming at a four-month high. A valid bullish monthly close with an engulfing pattern formation presents a strong continuation signal. However, investors should closely monitor how the price reacts at the 65.57 monthly flip zone. The weekly chart remains bullish, and an inside bar breakout is likely. A valid weekly close above the 65.65 level could validate the inside bar breakout at any time.
On the main price chart, price action is stable above the 200-day SMA, with multiple bullish rejections at this level. The 50-day EMA follows the same structure, remaining bullish after a breakout.
The secondary indicator window presents a slightly different perspective. The RSI recently touched the 70.00 overbought level before moving sideways around the 60.00 area. As long as the RSI remains above the 50.00 neutral level, bullish pressure may persist.
Given the overall market structure, investors should monitor how the price behaves within the current range-bound market. A short-term retracement could push the price toward the 62.00–61.06 area before another bullish momentum develops. A valid bullish reversal from this zone could provide a long opportunity targeting the 76.00 level.
On the other hand, the price is currently trading within a strong liquidity zone. Any bearish break with a daily close below the 61.06 level could signal a buy-side liquidity grab. In that scenario, the price may resume the existing bearish pressure, with the primary objective being a retest or breach of the 55.38 low.
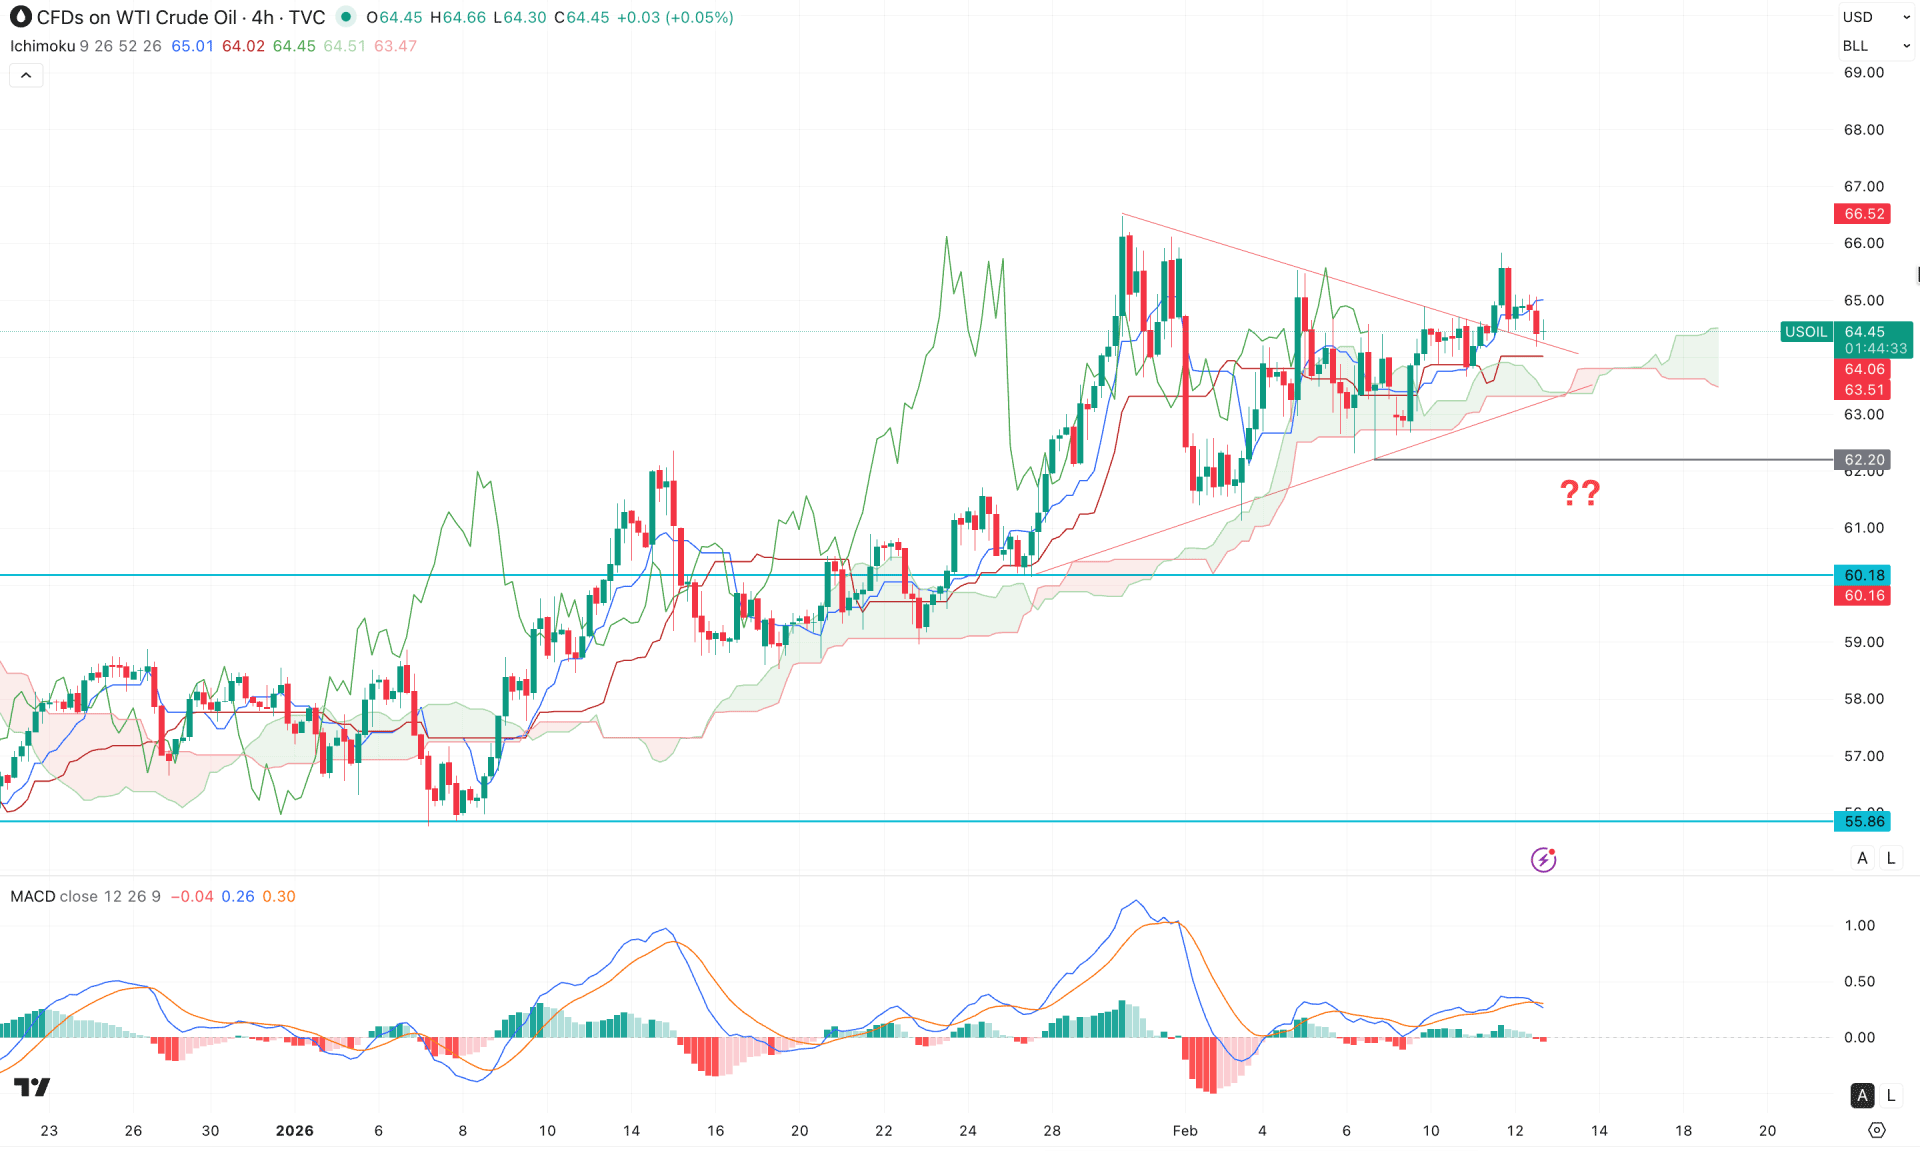
In the four-hour timeframe, ongoing bullish momentum is visible above the Ichimoku cloud, although the market is currently experiencing sideways pressure. The future cloud remains positive for buyers, as both leading spans are trending upward.
In the secondary indicator window, the MACD histogram remains sideways, with the most recent bars hovering near the neutral line. The MACD Signal line is still in positive territory, and a bullish crossover has recently formed.
Based on the current H4 market structure, a bullish symmetrical triangle breakout has developed above the cloud, which serves as a primary bullish continuation signal. However, recent price action remains sideways, indicating that a sufficient liquidity sweep may still be pending.
A bullish reaction at the dynamic support line could resume the uptrend, targeting 68.00. However, an extended pullback toward the 62.20 level is possible before another long opportunity emerges. Failure to hold the price above the cloud area could invalidate the bullish structure at any time. In that case, the price could decline further toward the 57.00 psychological level.
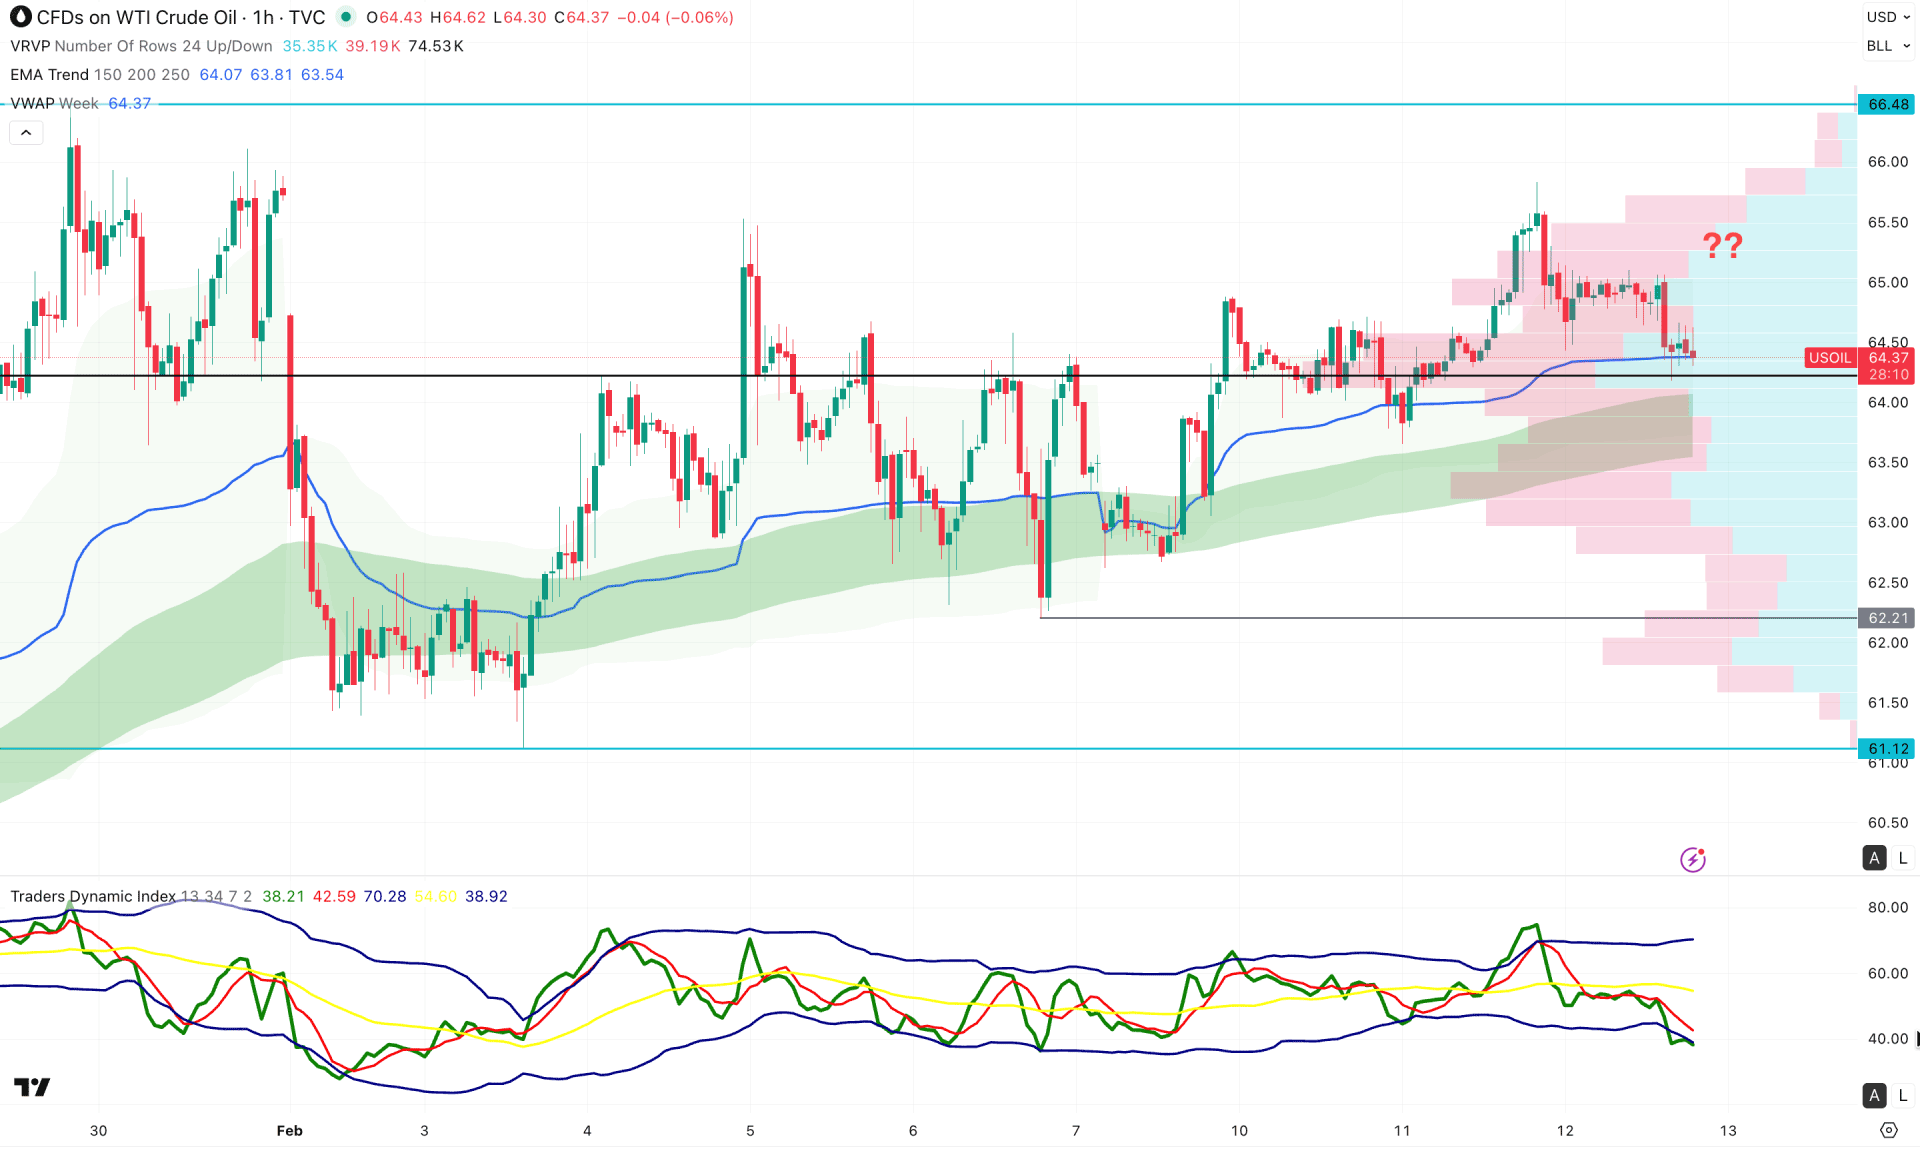
In the hourly timeframe, intraday momentum is visible on the chart, but the most recent price action lacks strong support from the weekly VWAP line. However, the intraday high-volume node remains below the current price and is acting as immediate support.
In the secondary indicator window, the Traders Dynamic Index (TDI) has moved lower and found support near the lower band area. Although this reflects extreme selling pressure, a bottom formation could limit further downside at any time.
Based on the hourly structure, investors should monitor how the price reacts around the exponential moving average. Any immediate bullish rebound from the trend support level could create a range-extension opportunity. On the bullish side, the primary target is a retest of the 66.48 resistance level before confirming further long-term trend continuation.
On the other hand, extended selling pressure with the price remaining below the 62.21 level could increase the downside risk toward the 60.00 area.
Based on the overall market structure, bullish signals are visible on the daily chart for WTI. The price is trading sideways after forming a strong rebound, from which a rally continuation pattern could develop. Investors should closely monitor a breakout from the current range. Any bullish reaction at near-term support levels could create a favorable swing-trading opportunity aligned with the broader trend.


