
Published: July 13th, 2022
The US Energy Information Administration (EIA) forecasted that the US crude oil production could reach 12.8 million barrels per day from 11.9 million barrels a day within 2023. Moreover, the EIA provided a short-term outlook for Crude Oil, saying that the Brent Crude price may remain on average $104 per barrel in 2022 and $94 per barrel in 2023.
According to EIA, The global oil inventories could rise by 0.8 million barrels per day and remain unchanged in 2023 due to the rising liquid fuel production from petroleum exporting countries. As a result, the global liquid fuel consumption may rise by 2.2 million barrels a day in 2022 and additional 2.0 million barrels a day in 2023.
The global financial market awaits the Consumer Price Index report today, where any upbeat data will increase the possibility of a potential recession. On the other hand, the softer data could relieve investors by easing energy prices.
Let’s see the future price direction of this pair from the WTI Crude Oil technical analysis:
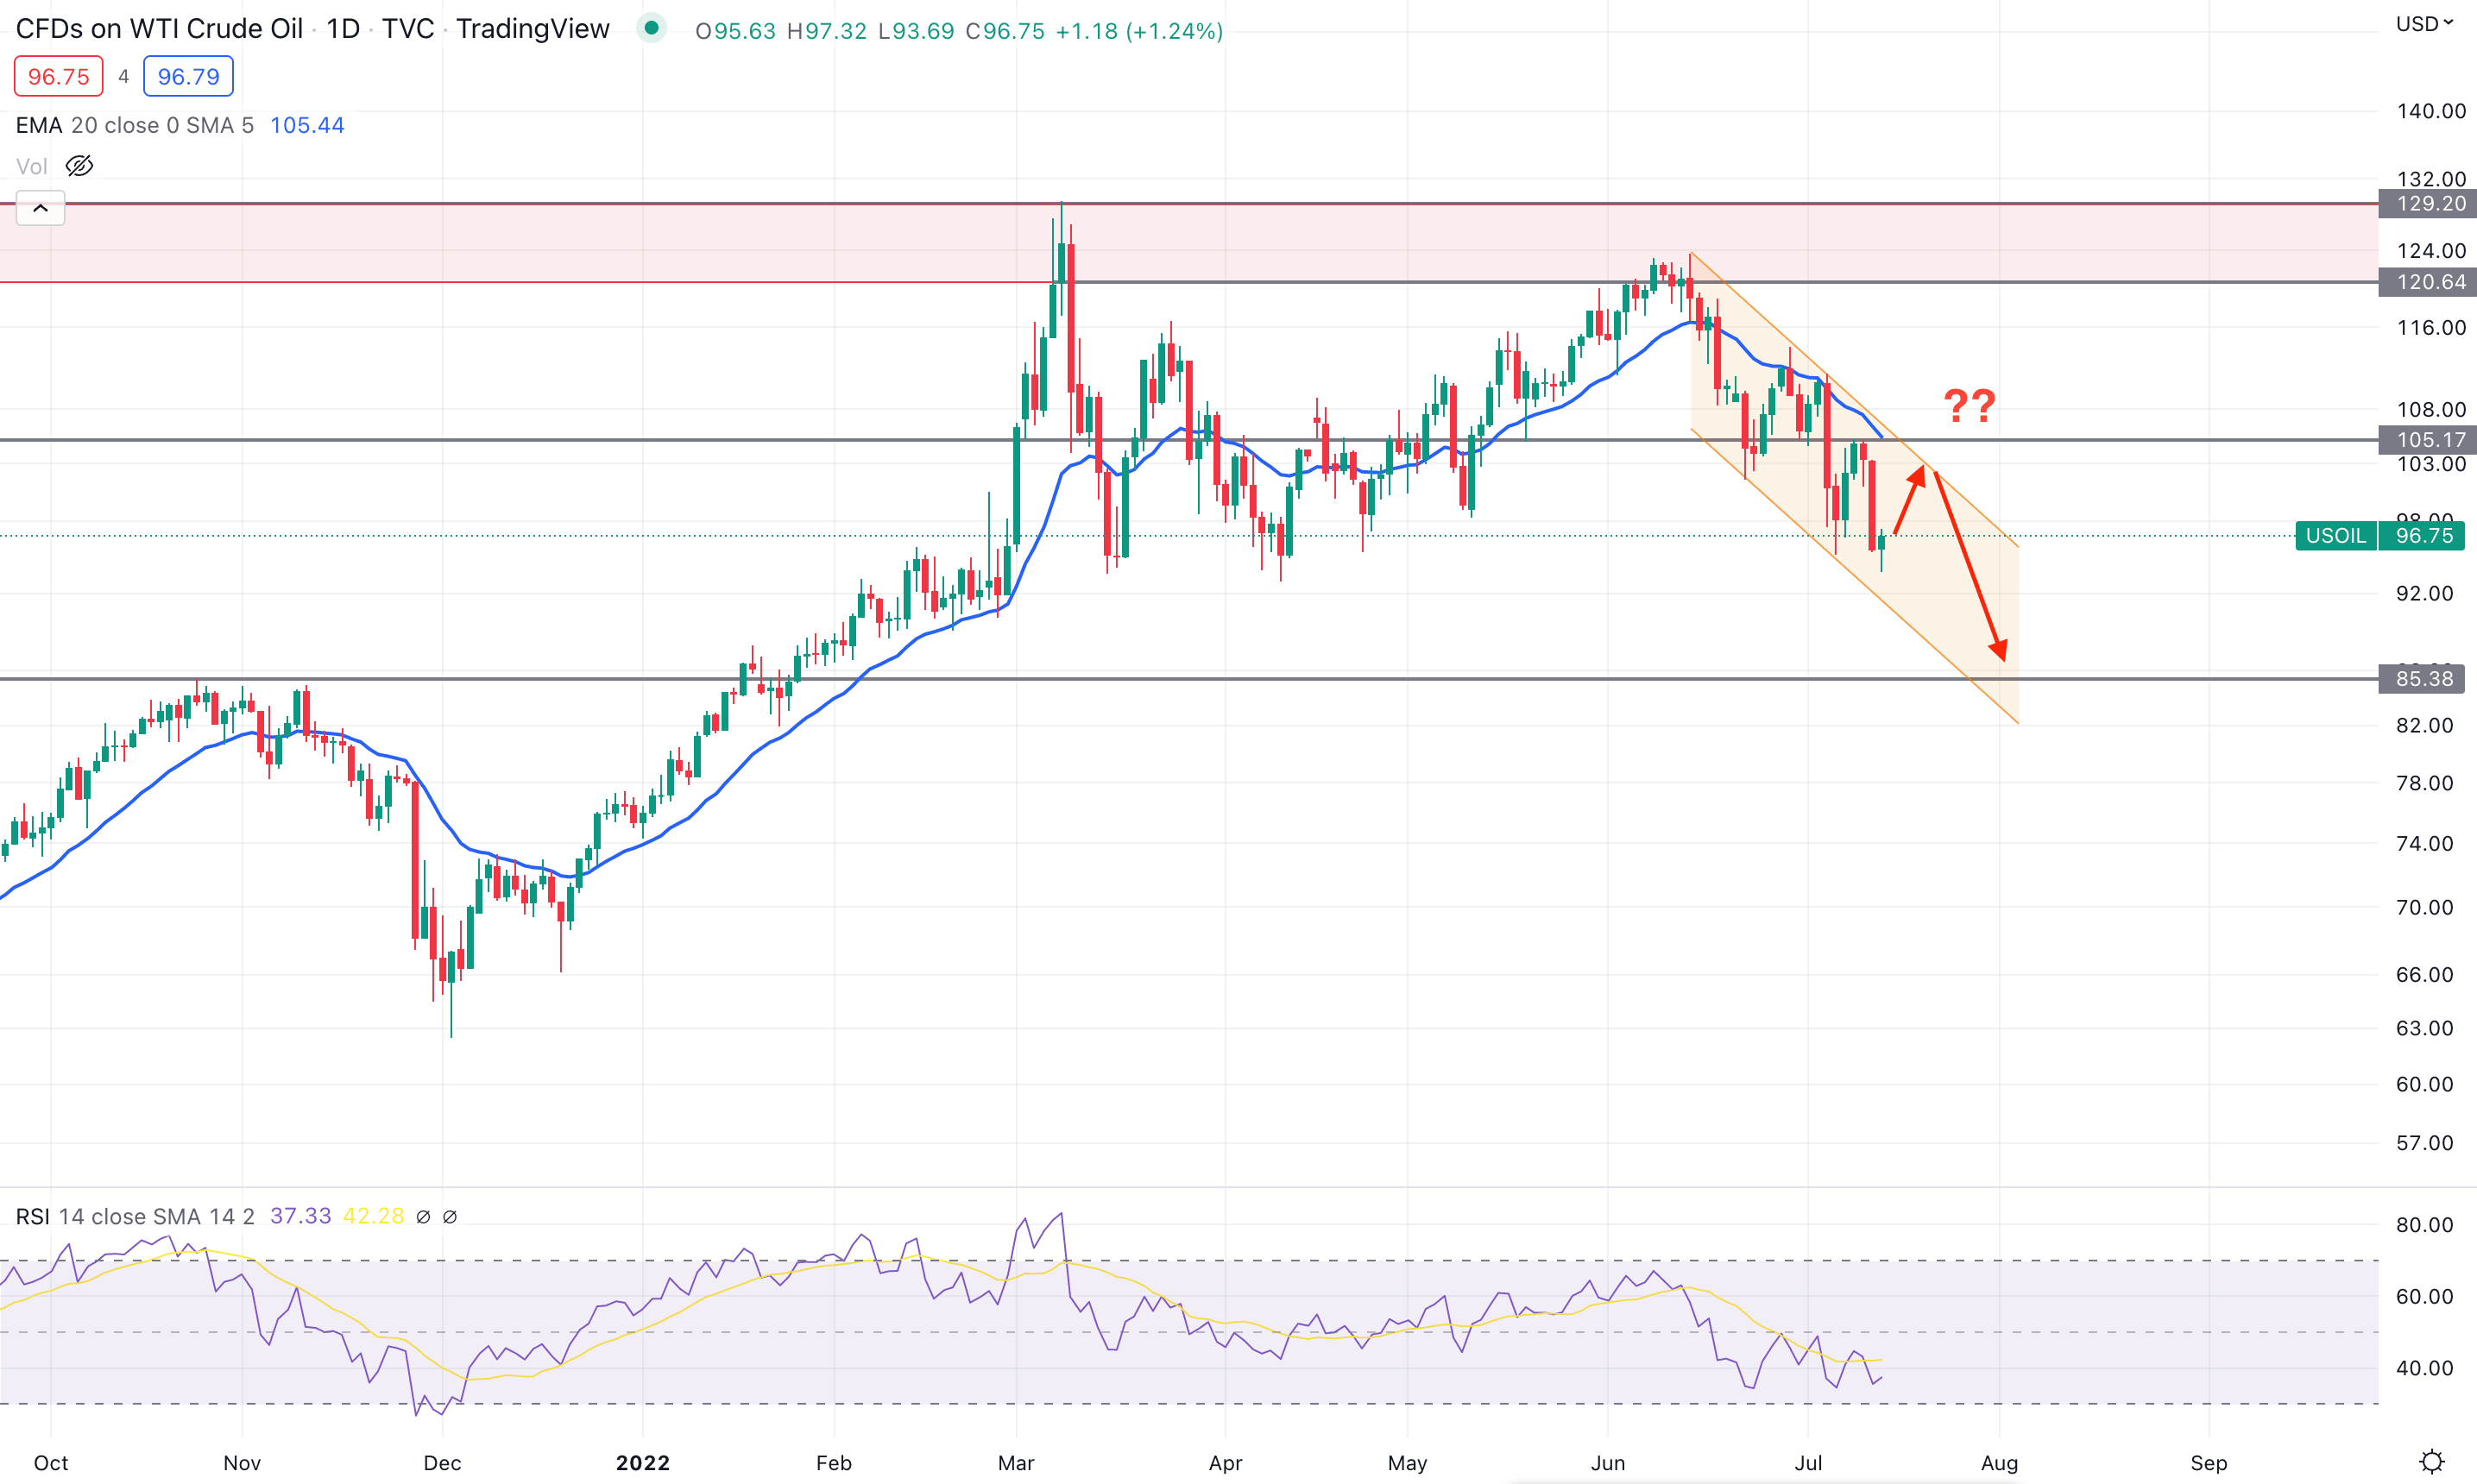
According to the WTI daily chart, the market peaked at 129.20 level, from where a strong selling pressure appeared. Moreover, the last bullish candle before the selling pressure started in March 2022 covered the 120.64 to 129.20 zone, indicating a strong supply area. In June 2022, the price revisited the supply zone as a part of the order-building process before pushing down towards the 105.17 support level. Therefore, the current market condition indicates a possible trend-changing momentum where an upside correction towards a reliable resistance level would be a potential bearish opportunity.
The above image represents the daily candlestick chart of WTI Crude Oil, where the current price is stable below the dynamic 20 EMA and static 105.17 resistance level. Moreover, the price is moving down within a bearish channel where a correction towards the channel resistance is pending. The Relative Strength Index (RSI) hovers between 50 and 30 levels, indicating a pending test of the oversold 30 level.
Based on the daily price structure, investors should closely monitor how the price trades at the dynamic 20-day moving average area. Any bearish rejection from the 101.00 to 106.00 zone could provide a profitable bearish opportunity in this instrument, where the primary target is to test the 85.38 support level. Conversely, the bearish outlook will be invalid if a strong bullish daily candle appears above the 106.00 psychological level, which could increase the possibility of testing the 120.00 level.
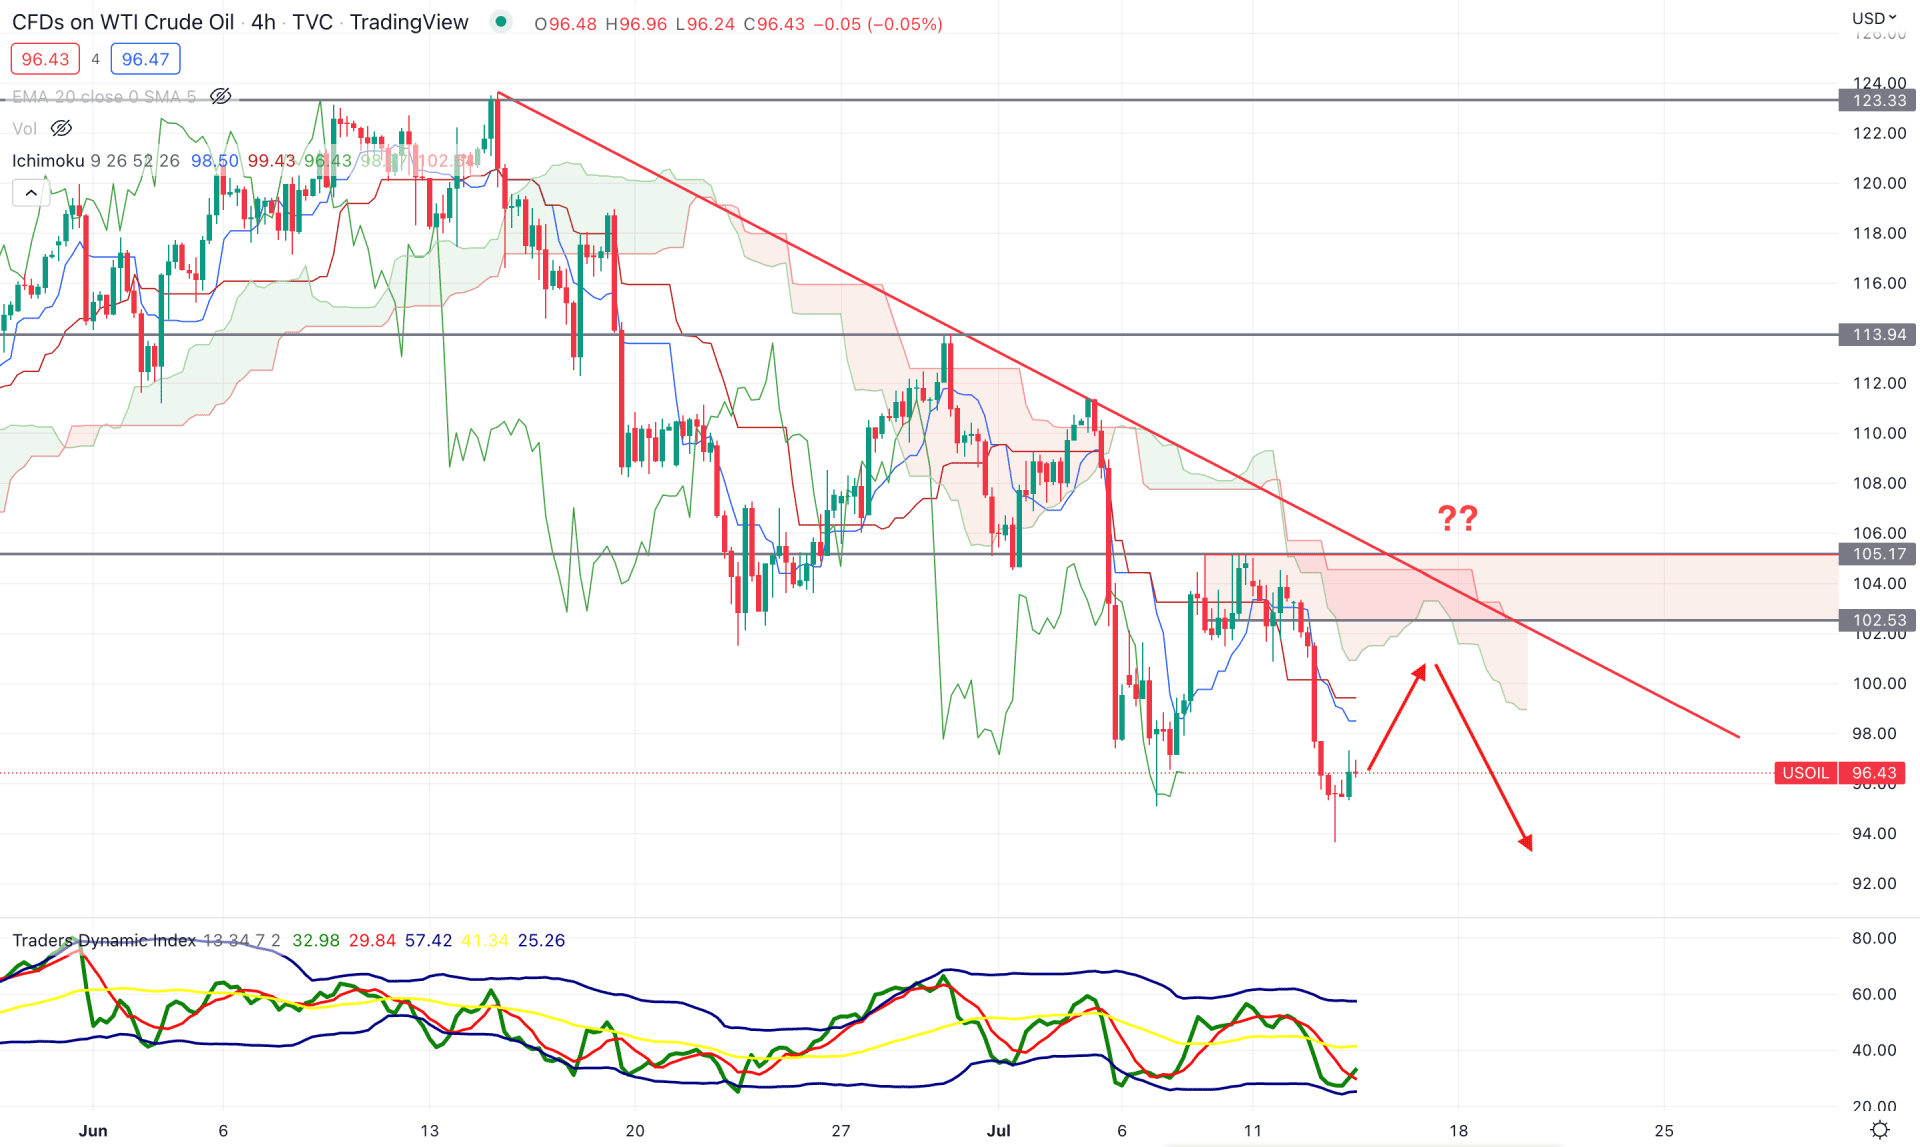
According to the H4 price action, the current price trades below the Ichimoku Cloud for a considerable time, indicating a strong seller presence. In the future cloud, the Senkou Span B is above the Senkou Span A. Moreover, the Senkou Span A is moving downwards, indicating that the upcoming price direction is bearish. The latest new swing low below the 95.17 level was initiated from the 105.17 to 102.53 intraday supply zone, which is the ultimate barrier for H4 sellers.
The indicator window shows the Traders Dynamic Index, a unique tool to determine buyers/sellers' dominance in the market. As the current TDI level is below the 50.0 neutral zone and moving up from the lower band, the price may shift the trend to the buyers' zone once the TDI line is above the 50 level. The dynamic Kijun Sen and Tenkan Sen are also above the current price, working as minor resistance.
Above the H4 context, any bearish rejection from the Kijun Sen resistance could increase the bearish possibility in this instrument towards the 90.00 level. On the other hand, a bullish break above the 105.20 level would eliminate the current bearish structure and open room for grabbing the buy-side liquidity above the trend line resistance.
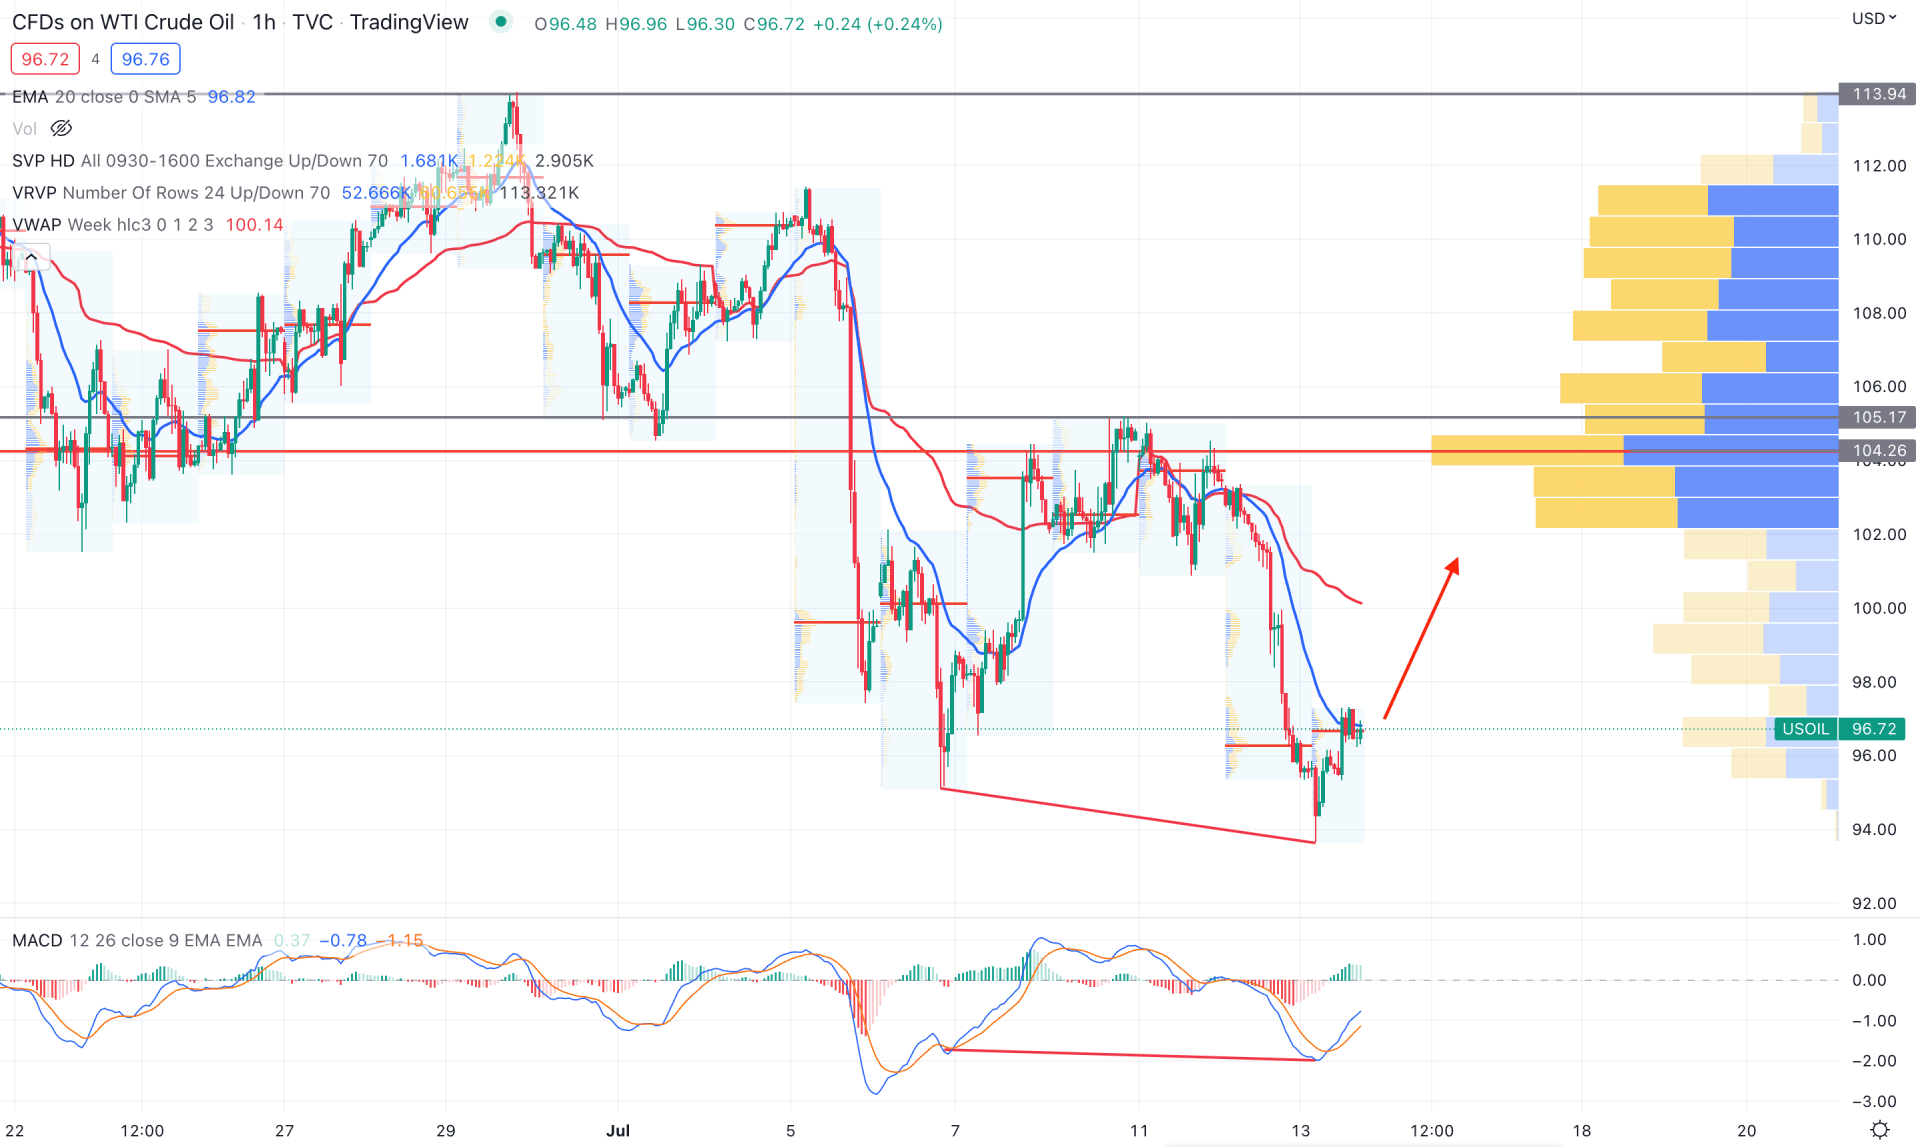
According to the intraday volume profile, the strongest trading volume based on the visible range is at the 104.26 level. Therefore, as long as the price remains below the 104.26 level, we can expect the bearish momentum to extend in the coming days.
The dynamic 20 EMA is working as an immediate resistance where the gap between the price and weekly VWAP is higher. In that case, the price could increase and test the VWAP level before pushing down.
The above image shows how a divergence formed in MACD Histogram, increasing the bullish possibility in the price. Therefore, based on this price action, the intraday market trend is bearish, where a minor bullish correction is pending. However, any selling pressure from weekly VWAP could resume the current trend, but a bullish H1 candle above the 106.00 level may alter the current market context.
Based on the current multi-timeframe analysis, the WTI market trend is bearish, where a minor bullish correction is pending. In that case, bears may regain momentum at any time until the price moves above the 106.00 level on the daily chart.


