
Published: March 27th, 2025
Crude prices continue to decline as markets evaluate the effects of US President Donald Trump's automobile tariffs and the continued worries about disruptions in global supply brought on by US sanctions on purchasers of Iranian and Venezuelan oil.
Concerns over the stability of the world's supply have been heightened by reports that India's Reliance Industries, the operator of the largest refining facility in the world, intends to stop importing Venezuelan oil in response to the most recent US tax announcement.
Trade tensions around the world have escalated since President Trump issued an order establishing a 25% tariff on vehicle imports. The tariffs are scheduled to go into force on April 2nd, and collection will start the following day. Some economists, however, think that the tariffs might help oil prices in a roundabout way.
Due to tighter global supply and indications of robust demand, oil prices increased by about 1% on Wednesday. According to the US Energy Information Administration (EIA), gasoline stocks also decreased last week, and crude stockpiles declined by 3.34 million barrels, the biggest drop since December.
Crude prices have declined due to US negotiations with Russia and Ukraine that may result in the lifting of US restrictions on Russian oil. The market may also be somewhat impacted by worries about a potential May supply increase by OPEC+ (Organization of the Petroleum Exporting Countries and its allies). Meanwhile, by 2029, Iraq intends to increase its oil production capacity to exceed 6 million barrels a day (bpd).
Let's see the more detailed outlook from the WTI technical analysis:
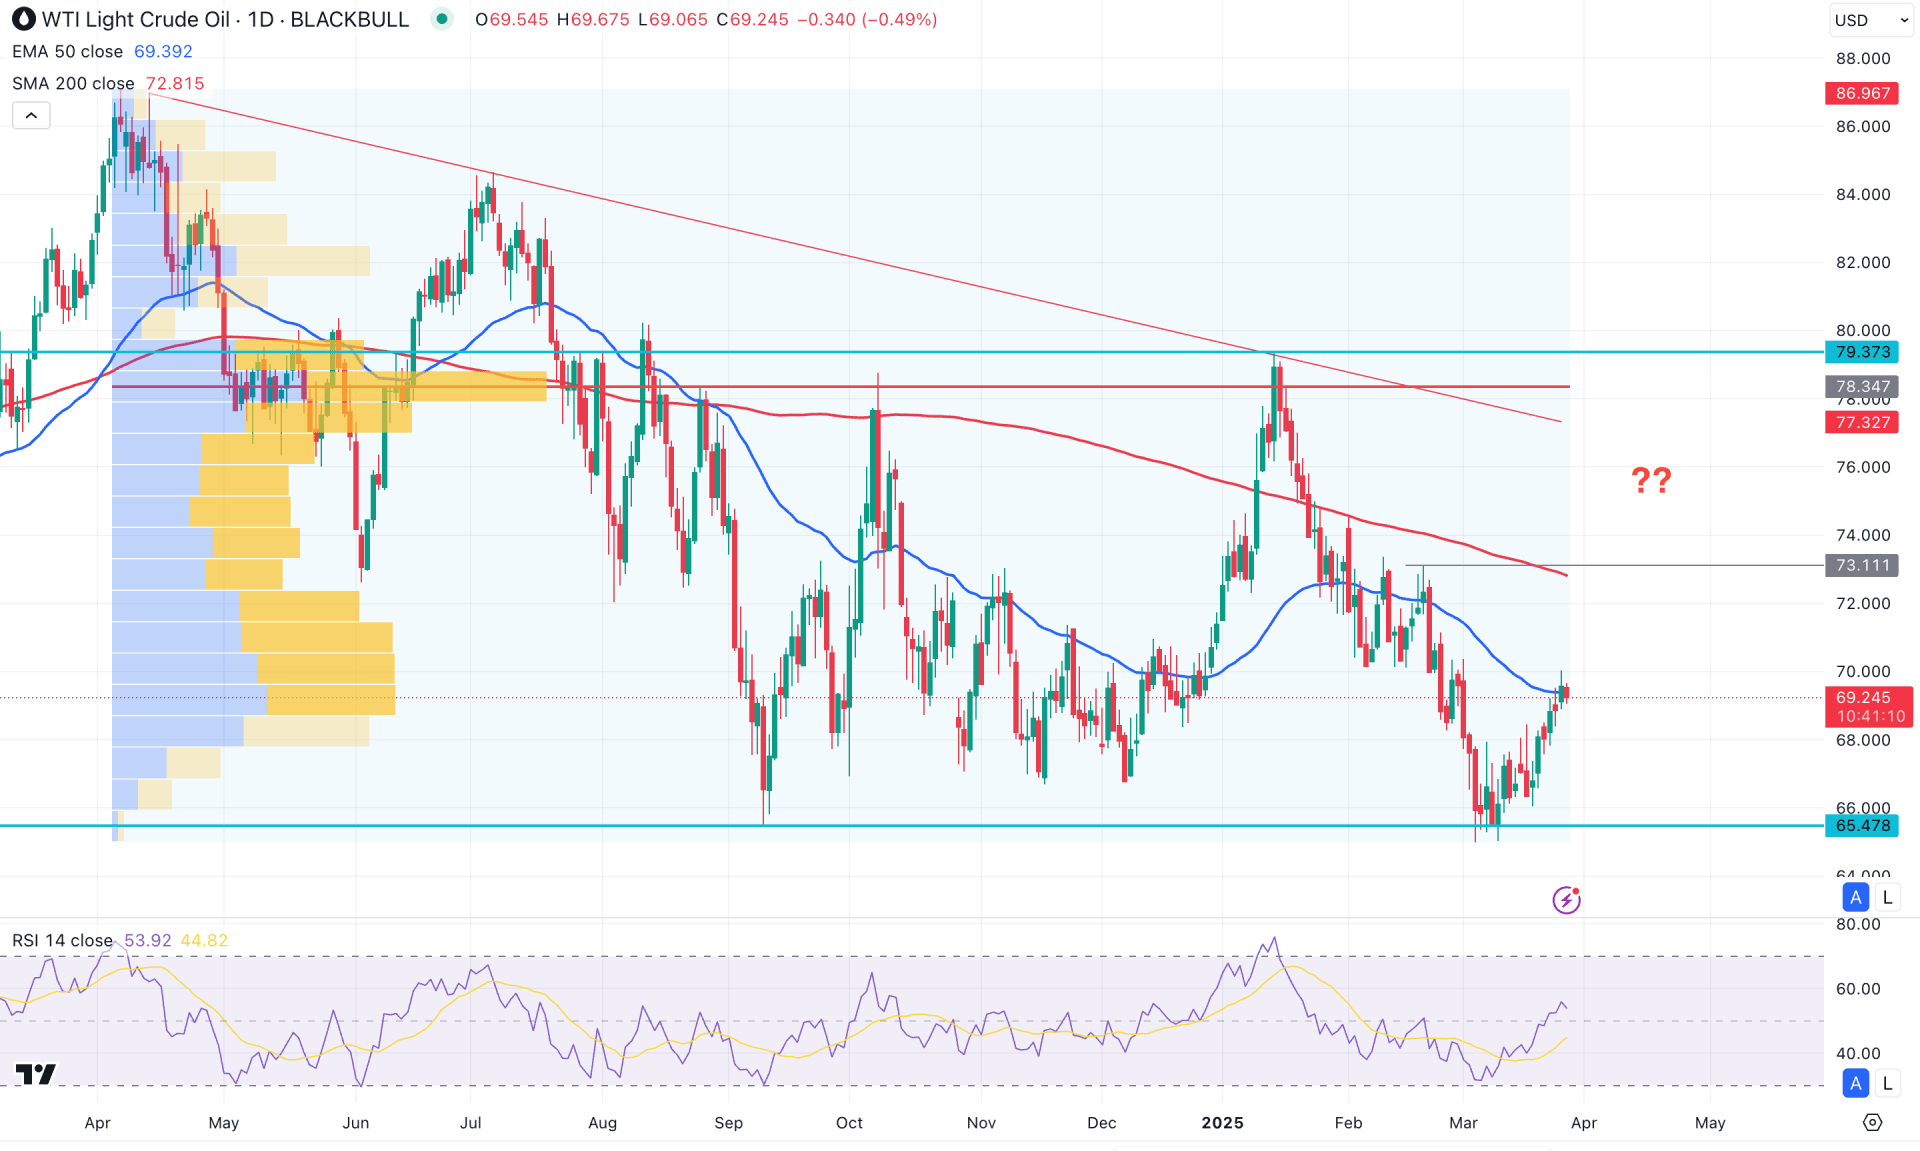
In the daily chart of WTI, the price is trading near the 50-day EMA after testing the September 2024 low. Following the minor buying pressure seen from the bottom, the price is likely to face selling pressure once a reliable top is established.
The price action in the higher time frame shows a corrective pressure, as no significant price change has been observed since 2023. The price has barely changed by more than 10% in the last six months, indicating a sideways momentum. In the most recent monthly candle, the price is trading below the February 2024 low, but a rebound from the September 2024 high needs to be monitored. A valid bullish rebound with a monthly close above the March 2025 open price could signal a minor bullish trend extension opportunity.
Looking at the volume structure, selling pressure is still prominent, as the most active level since April 2024 remains above the current price. However, a potential upward extension is seen, as the current price is trading sideways after a 17% price drop.
In the main price chart, both the medium-term and long-term market trends are bearish. The 200-day SMA is acting as major resistance, with a bearish slope visible above the current price. The 50-day exponential moving average follows the same path, remaining above the current price. As the price approaches these crucial dynamic levels, investors should monitor how the price reacts after testing them. The primary expectation is to find any immediate bearish reversal patterns aiming for downside continuation.
In the Relative Strength Index (RSI), the recent line shows a bullish recovery from the oversold level. The current line fluctuates between the 50 and 70 levels, which suggests a potential trend soon.
Based on the daily market outlook for WTI crude oil, a descending channel breakout is visible. The current price is facing resistance at the 50-day EMA. Primarily, any selling pressure from the 70.00 to 73.11 resistance zone would present a valid short opportunity, targeting the 65.47 level.
On the other hand, an extended bullish continuation, with a stable market above the 200-day SMA, could invalidate the current bearish outlook at any time. In that case, the next resistance level to test would be 79.37 before heading towards the 84.00 area.
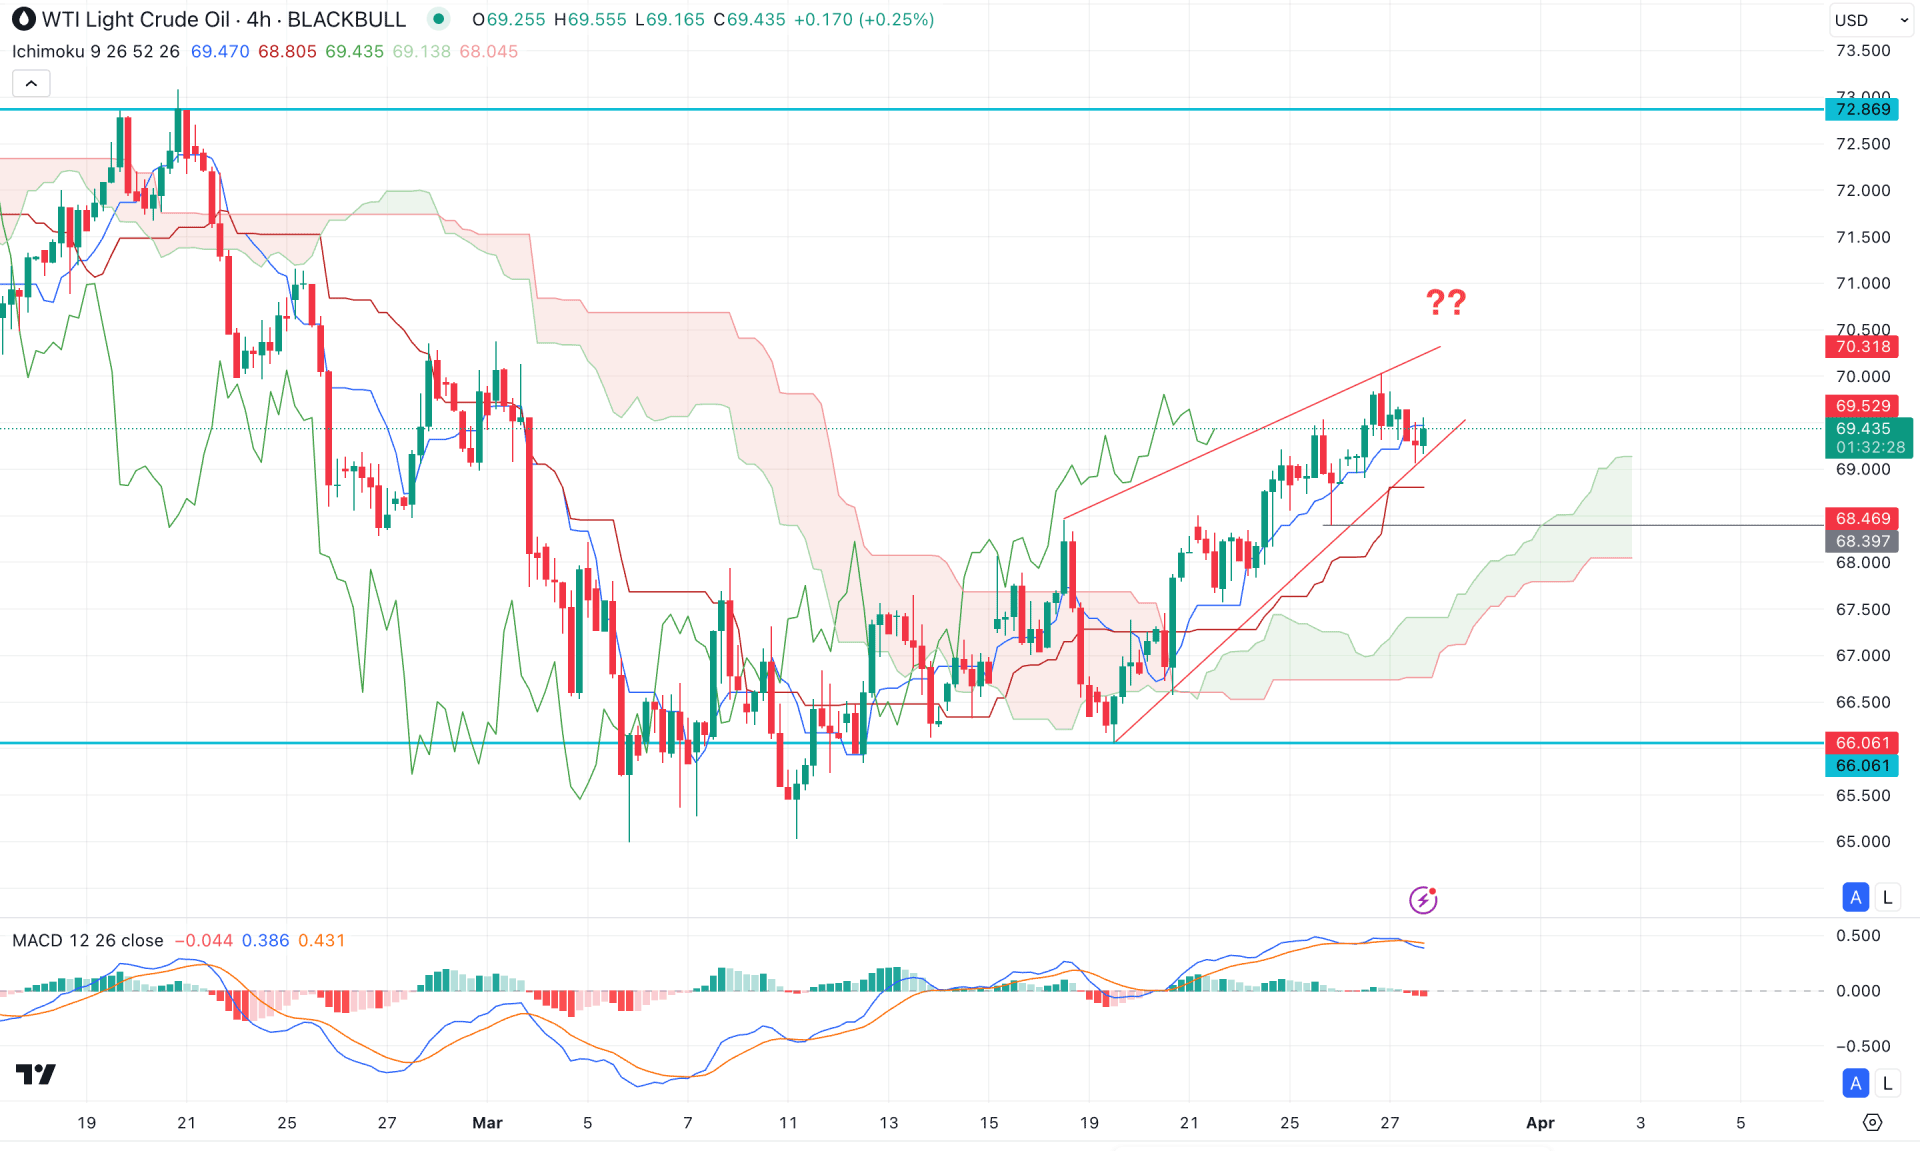
In the H4 timeframe, a solid bottom is formed at the 65.01 level before rebounding above the cloud area. In the most recent chart, the price is trading upward, indicating a bullish continuation and signaling further upside potential.
In the indicator window, the MACD Signal Line reached its highest level in a month and formed a crossover at the top. Moreover, the histogram continues moving lower while three consecutive downward trend lines are visible.
Based on this, the bullish momentum is trading within a Rising Wedge pattern. Additionally, the dynamic trendlines are supporting the buying pressure by remaining below the current price. In this case, a bullish continuation is possible as long as the price remains above the 68.39 level.
On the other hand, a failure to hold the price above the near-term level with a valid cloud breakout would validate the wedge breakout. In that case, the immediate support level to watch is the 66.06 level, before potentially moving below the 64.00 area.
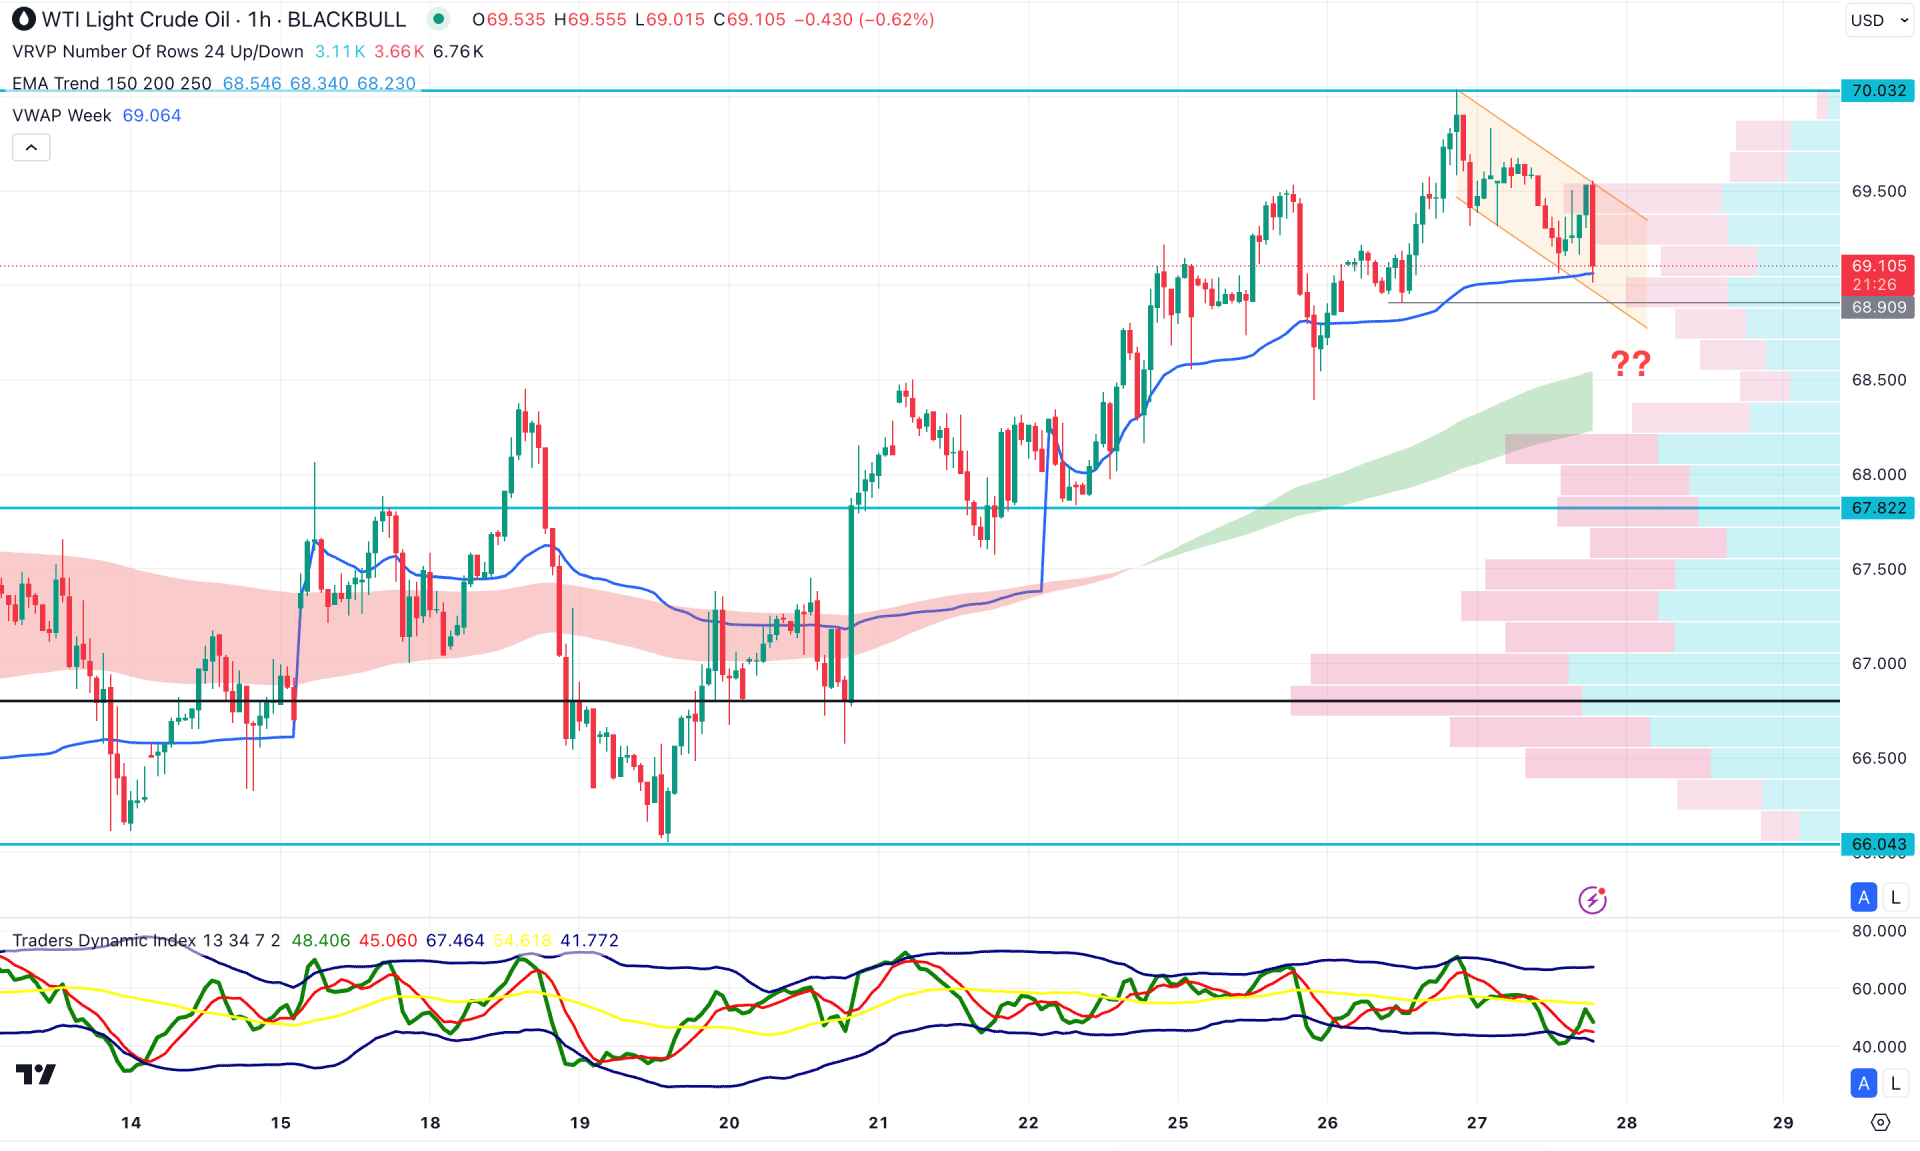
In the hourly time frame, the recent price shows a bullish pressure where the EMA wave is the major support. Moreover, the weekly VWAP is just below the current price, working as an immediate support. As long as both dynamic lines are below the current price, the intraday price action will be bullish for this pair.
In the secondary window, the Traders Dynamic Index (TDI) aimed below the 50.00 line, signalling a selling pressure in the intraday price. Although a bottom is formed below the lower banks area, no sufficient bullish price action is visible.
Based on the hourly outlook, any minor downside correction towards the 68.90 support level is possible from where a valid bullish reversal can signal an upward continuation.
On the bearish side, an extended downside pressure below the EMA wave could signal a bearish opportunity toward the 67.00 level.
On the other hand, any bullish reversal from the descending channel breakout could offer a short-term long opportunity, aiming for the 70.00 level.
Based on the current market structure, the WTI price is trading within an intraday bullish pressure. However, the broader market direction is still bearish, where a downside trend might extend after forming an intraday top.


