
Published: March 1st, 2023
The crude oil market has experienced limited movement due to several factors, including a stronger US Dollar and higher inventories, despite historical technical levels providing support and resistance for pricing.
The US Dollar index (DXY) has decreased from a seven-week high, reducing concerns about a potential recession and a weaker global outlook. Still, supply issues in Poland persist due to Russia's decision to halt the oil supply.
The conflict in Ukraine remains a significant factor affecting oil supply, and an increase in oil inventories reported by the EIA has contributed to the current market situation.
The US Dollar Index (DXY) reached a critical supply zone on the daily chart from where a bearish pressure is seen. However, it is just the beginning of a new month, and investors wait until the correction is over.
Overall, the downside momentum is solid for Crude Oil, but finding the perfect price needs close attention to the price action.
Let’s see the upcoming market direction from the WTI Crude Oil technical analysis:
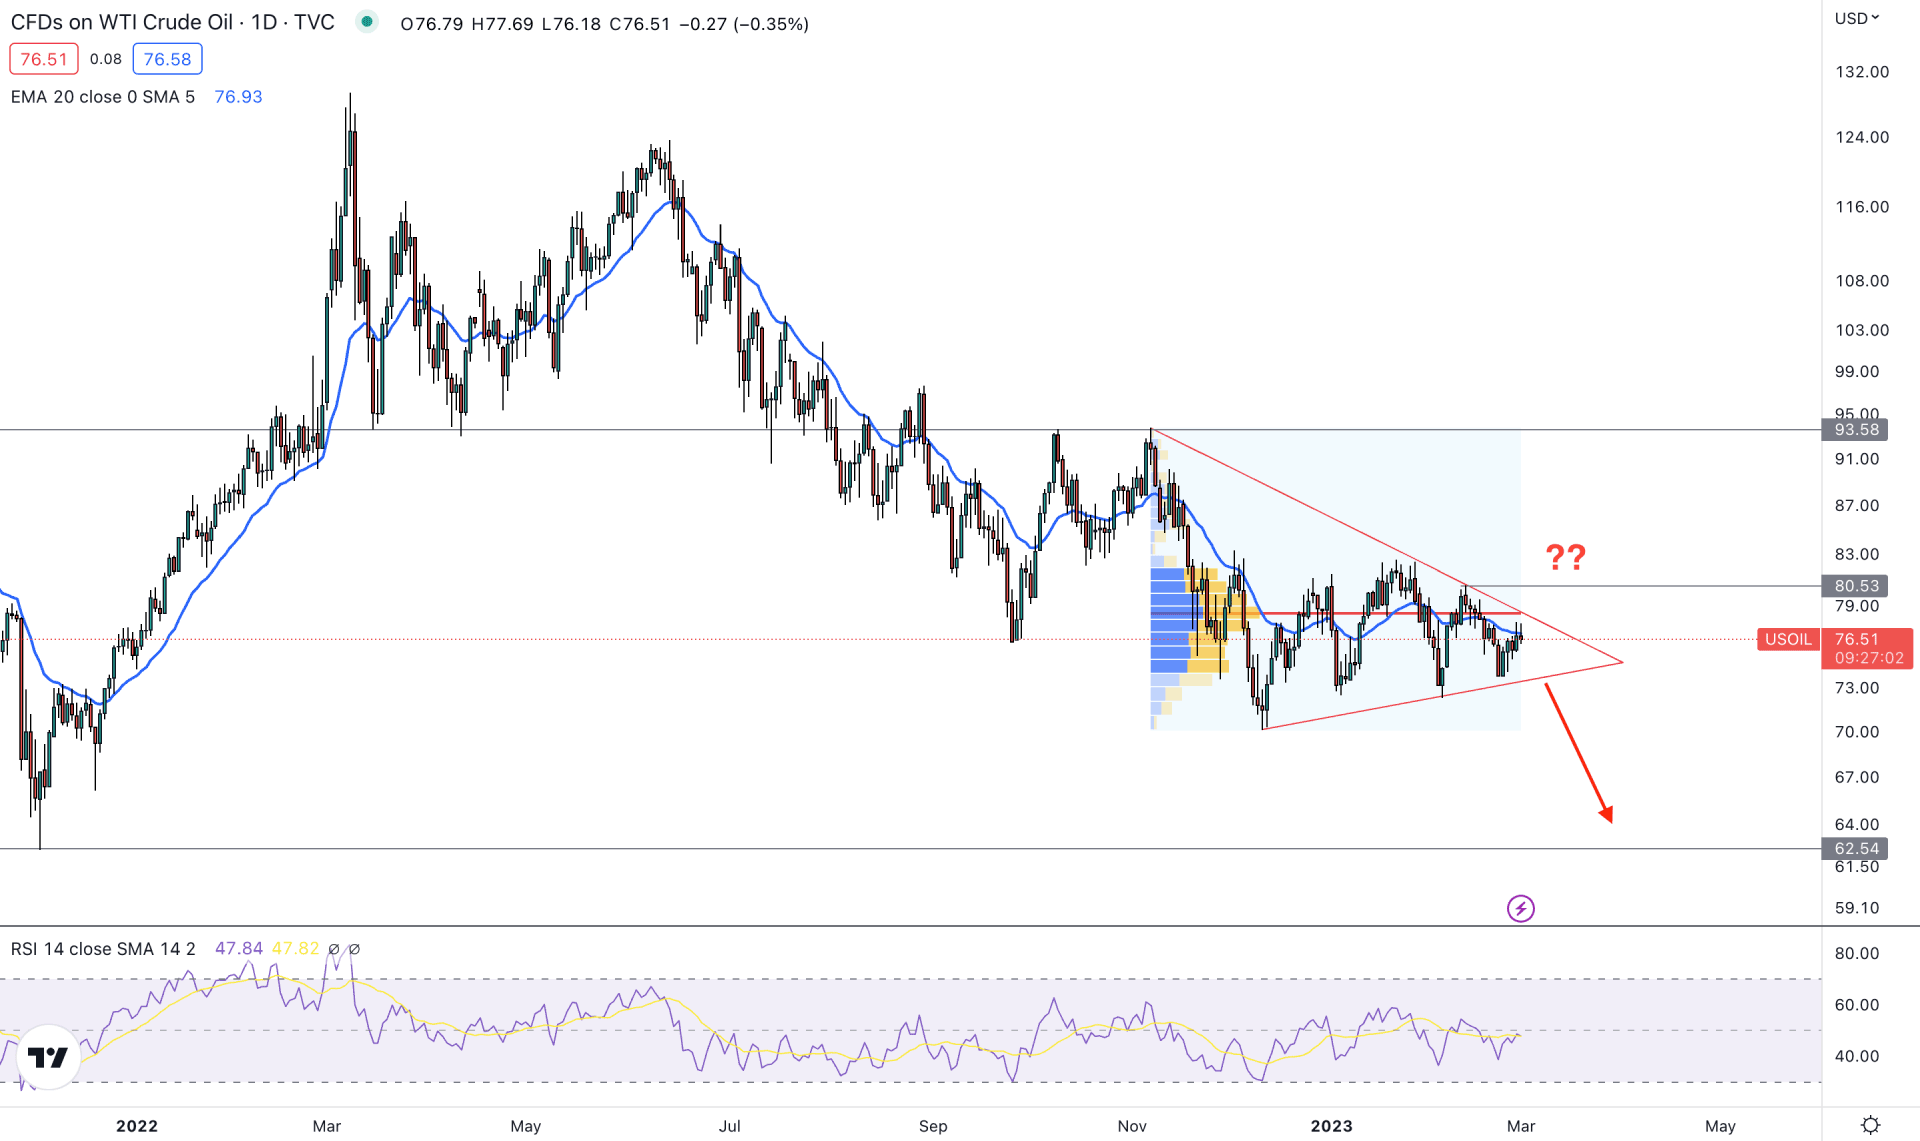
In the daily chart, the broader market outlook of crude oil is bearish, although the recent price traded in the tight range for a considerable time.
The downside pressure from the 93.58 level is solid, which is the upper boundary of this tradable area. On the other hand, there is an open space below the triangle support where any sell possibility could lower the price towards the 62.54 level.
Institutional traders are interested in this instrument, where bears are more likely to win the battle. The latest high volume level from the pennant pattern high to close is marked at 78.38 level, which is above the current price. Moreover, the near-term static resistance level of 80.53 also provides resistance to bulls. In that case, any bearish signal on the intraday chart could work well then buying setups.
The dynamic 20 DMA is above the price in the main chart window, but multiple violations are seen due to an excessive correction price action. On the other hand, the indicator window shows the same story where the current RSI level is at the 50.00 neutral area.
Based on the current price structure, bulls should wait for the violation of the 80.53 level before going long, targeting the 93.58 resistance level. A bullish daily candle above the 81.00 level would be the conservative approach to buying this instrument.
On the other hand, a downside pressure could come after a solid bearish pennant pattern breakout, but an early sign might come from 78.00 to 80.00 with bearish rejections. The primary target of the bearish possibility would be the 68.00 to 65.00 area from where a bullish pressure may come.
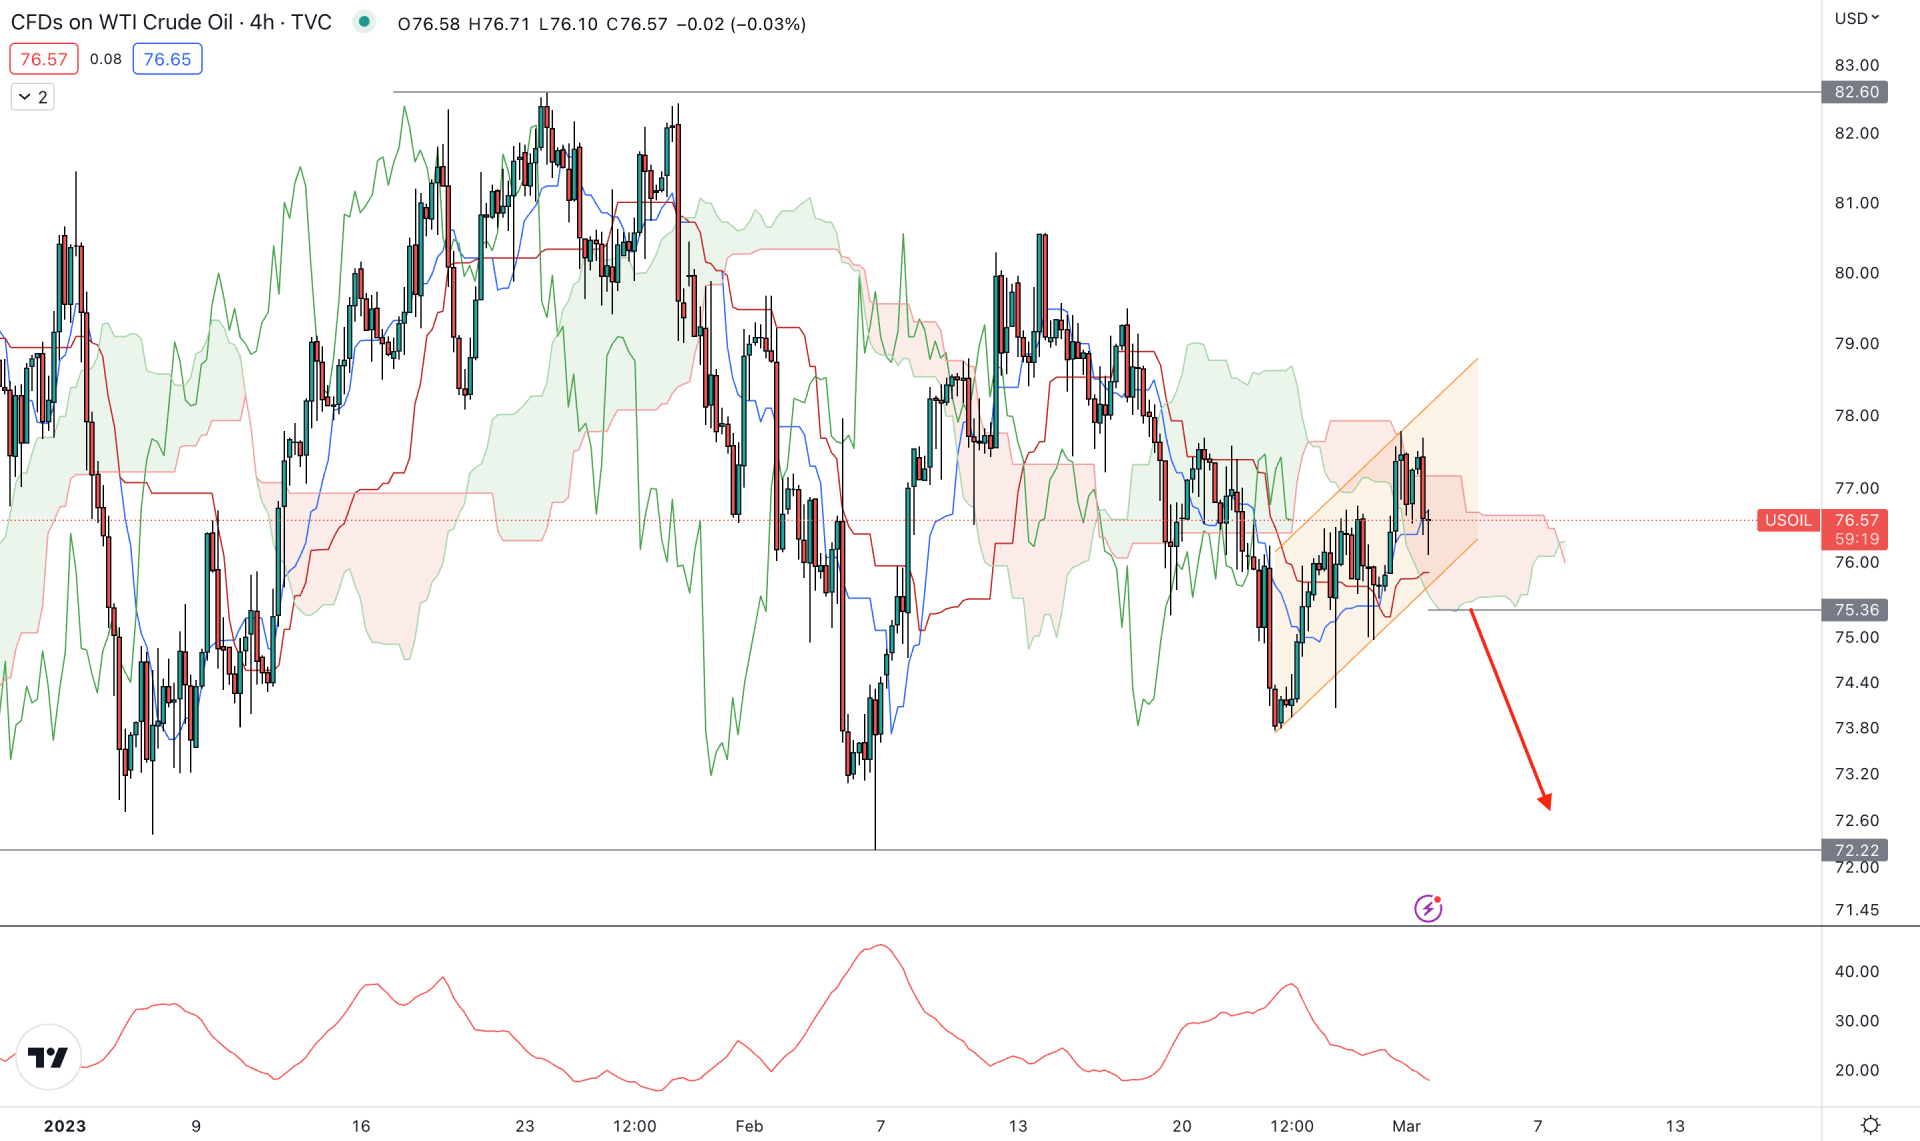
In the H4 chart, a bearish possibility is potent as the recent price became excessively volatile above the Cloud support. As a result, a corrective price action has appeared within the ascending channel, where a bearish break could lower the price in the coming hours.
In the future cloud, a bearish crossover is seen where Senkou Span A moved below the B, indicating a trend change.
The indicator window signals a volatile market as the ADX reaches the 20.00 lower band.
Based on this structure, a bearish break from the channel support with an H4 candle below the 75.36 level could lower the price toward the 72.22 level.
On the other hand, the price could become volatile after breaking above the 78.00 area, where more clues might need to find the next price direction.
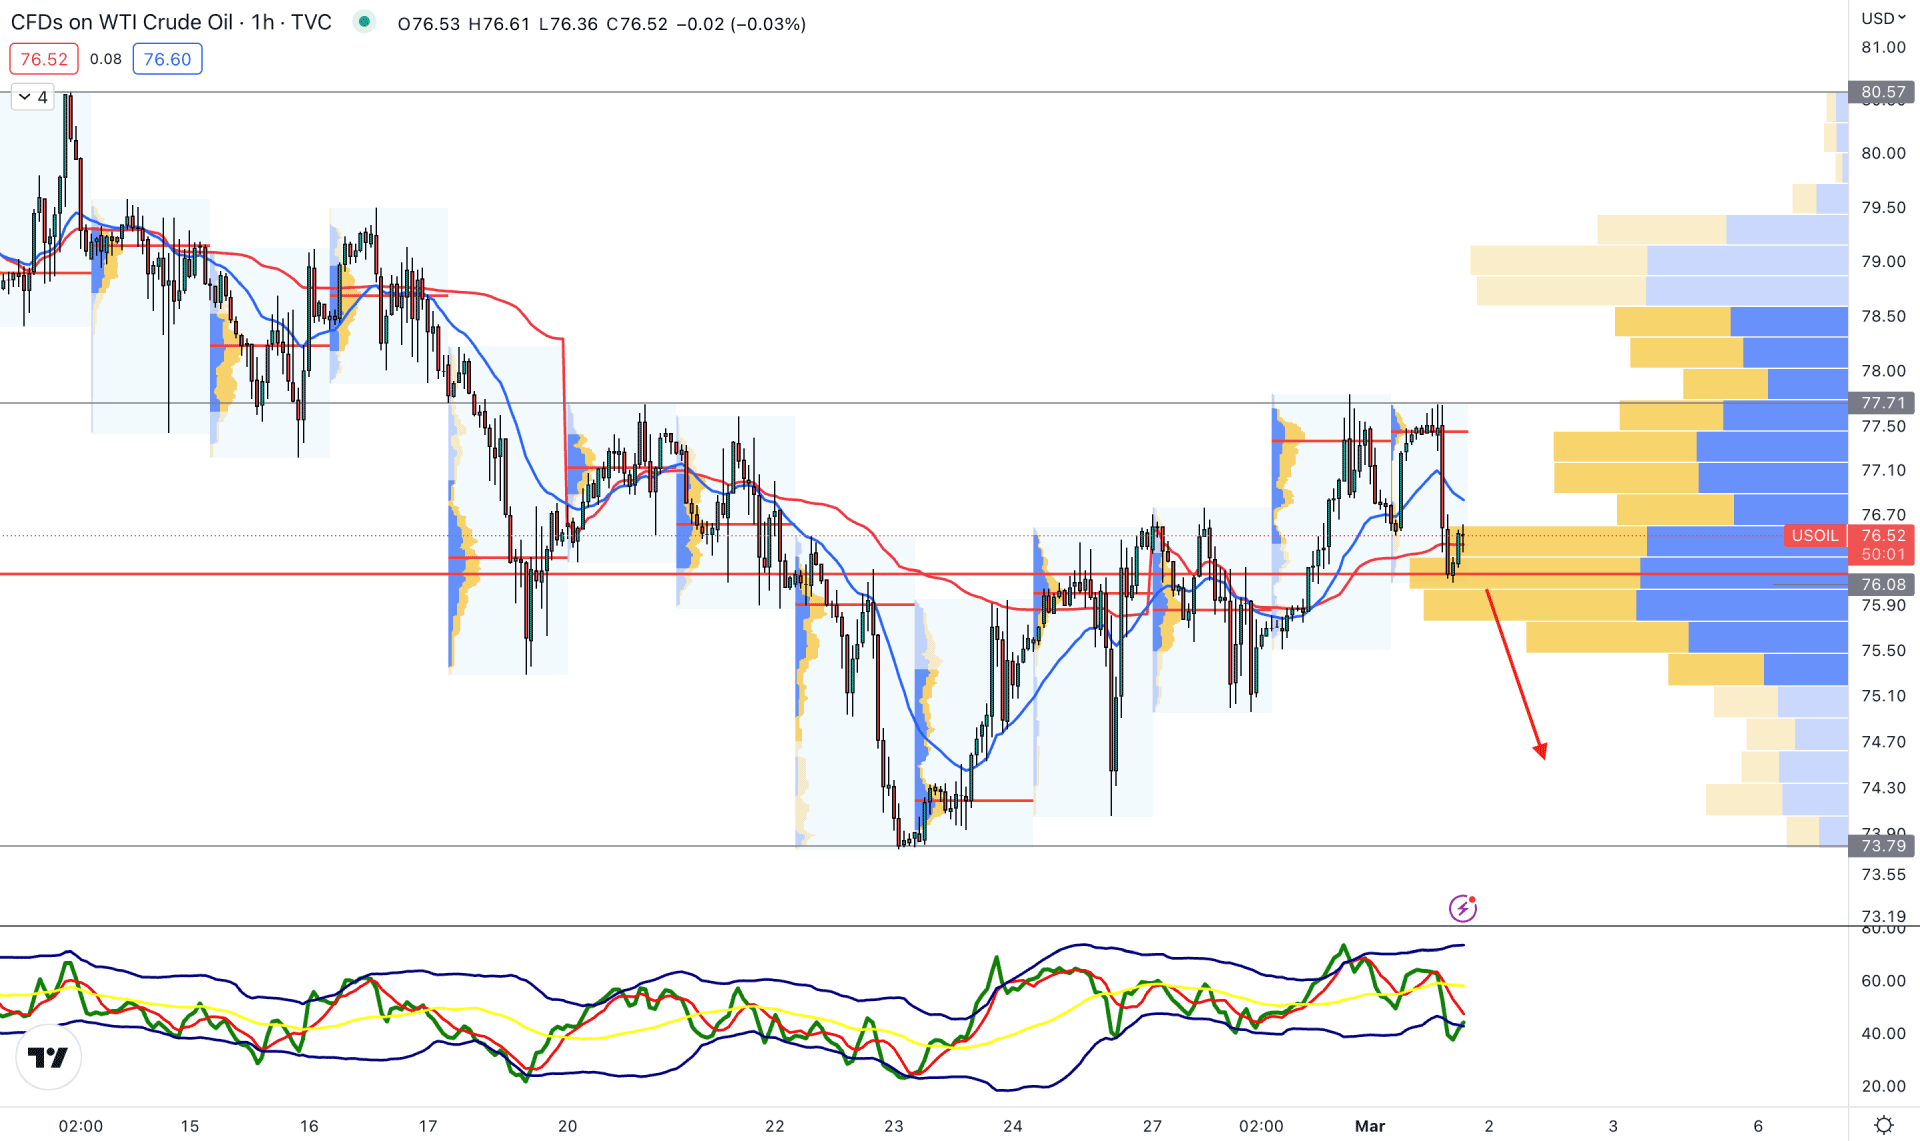
The buying pressure in the hourly price chart is still valid as the recent visible range high volume level at 76.08 level is below the current price. In that case, a bearish pressure with an H1 candle below the 76.00 level would be the first sign of possible selling pressure.
The dynamic 20 EMA and weekly VWAP are still above the current price, while the current Traders Dynamic Index (TDI) reached the oversold zone.
Based on the current price behavior, an immediate bullish recovery with an H1 candle above the 77.71 level would invalidate the buying possibility. However, a break below the 76.00 level would lower the price in the coming days, where the main aim is to test the 74.00 area.
Based on the current price outlook, WTI crude oil could come down in the coming days. However, an early sign may come from the intraday price chart, where investors should monitor near-term resistance levels to find the best place to join the bearish rally.


