
Published: March 16th, 2022
After testing the multi-year high, the oil price moved below $100 per barrel. The real question is whether the current bearish pressure is a major trend reversal or a nominal current of the next bullish swing. On the supply side, a disruption in global oil production might attract bulls to the price. On the other hand, the recent concern on China’s lockdown might work as a bearish factor for oil as the number of Covid cases is rising. However, the impact of the infection rate is not clear to find its effect on the oil price. However, the bigger picture from the weekly chart indicates that the price is still above the 90.00 key support level, from where a bullish rebound might happen.
According to the American Petroleum Institute (API), there was a surprise build in crude oil inventories of 3.754 million barrels, where the analysts' expectation was the production of 1.867 million barrels. On the other hand, the US crude oil production stagnated for five consecutive weeks, where the most recent weekly report showed 11.6 million bpd, which is 1.5 million bpd down from the pre-pandemic level.
Investors should closely monitor how the infection rate shows in China besides finding uncertainties from the Ukraine-Russia crisis. Let’s see the upcoming price direction from the WTI Crude Oil technical analysis:
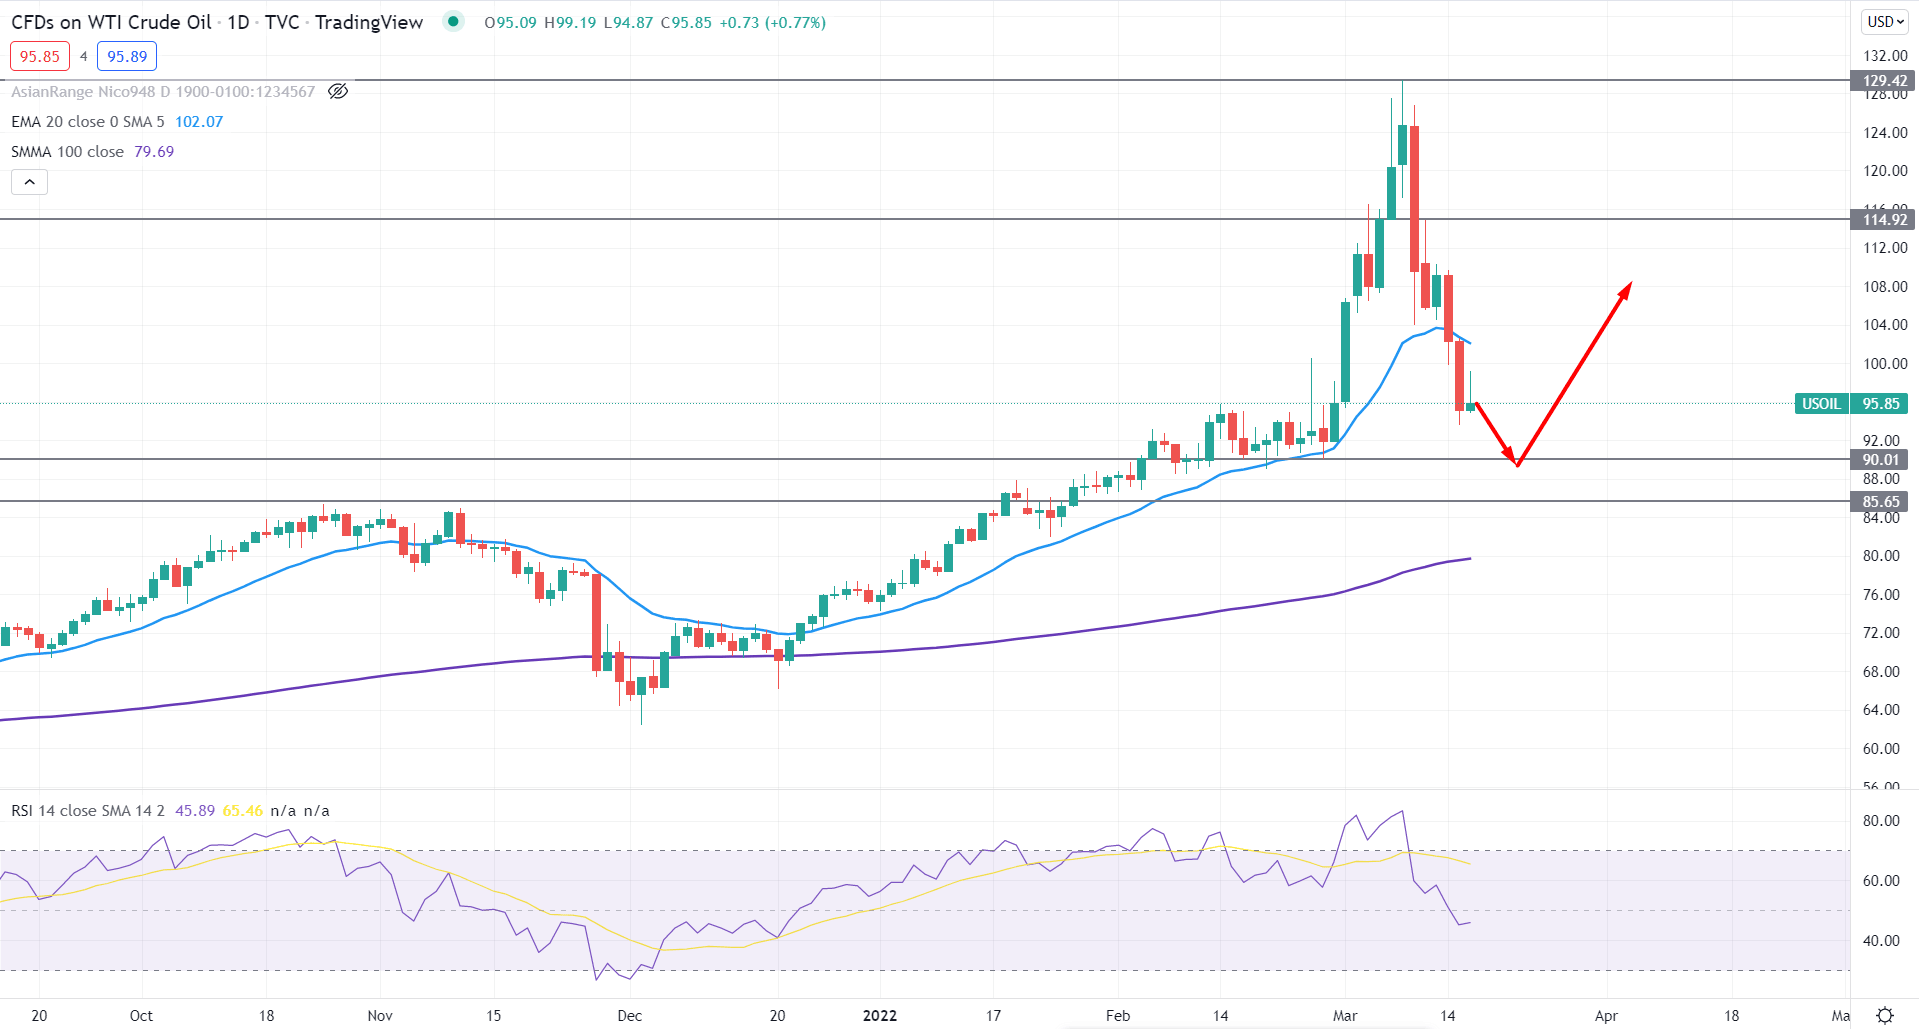
In the WTI Crude daily chart, the broader market trend is bullish as it has been trading above the 100 SMA line for a considerable time. In December 2021, the price tested the 62.77 swing low and initiated a bullish trend that ended up by testing the multi-year high at the 129.42 level. Ukraine-Russia influenced the recent buying pressure from 97.42 to 129.42 was where western countries restricted Russian oil. However, buying pressure is being eliminated with an inverted V-shape recovery, which is alarming for bulls.
The above image represents the daily chart of WTI Crude oil, where the selling pressure below the 100 level appeared with a strong bearish daily candle below the dynamic 20 EMA. On the other hand, the RSI line moved below the 50 level where the possibility of testing the overbought 30 levels is high.
In that case, investors should closely monitor how the price trades at 95.00-90.00 demand area from where a bullish trend continuation pattern may increase the buying possibility. On the other hand, a bearish daily candle below the 90.00 level is likely to find support from 100 SMA before showing further selling momentum.
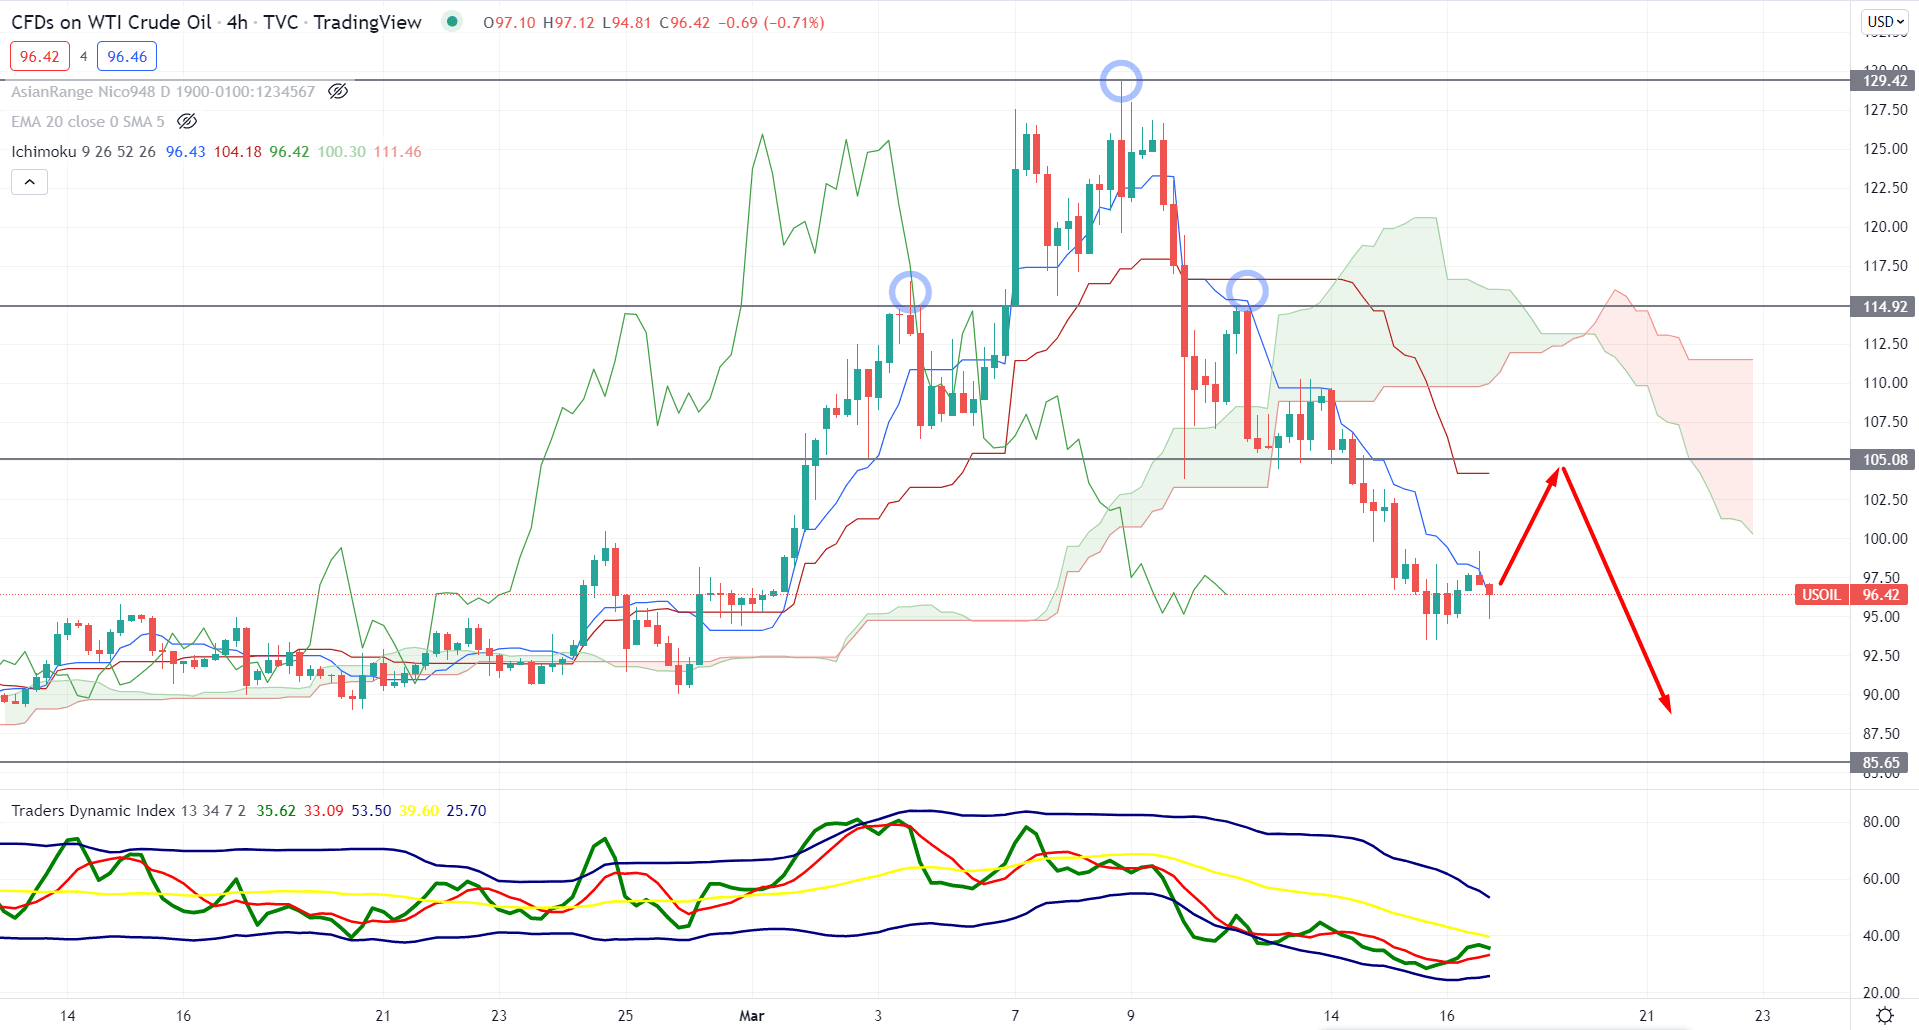
In the H4 chart, the broader market trend changed its direction from bullish to bearish as the recent price trades below the Cloud resistance with a bearish momentum in the future cloud. The Senkou Span A moved below the Senkou Span B in the future cloud while the Lagging Span trade below the price chart on that level.
The above image shows how the Traders Dynamic Index (TDI) remains below the 50 level with a strong selling momentum. Moreover, the upper and lower band of the TDI is sloping down, indicating a possible bearish pressure in the coming days. On the other hand, the current price moved below the dynamic Tenkan Sen and Kijun Sen, where the Kijun Sen became flat, opening bullish possibilities.
Based on the current price context, investors may experience a bullish correction in the H4 price where the primary aim is to test the dynamic Kijun Sen as a mean reversion. The neckline of the Head and shoulder pattern is also present at the Kijun Sen area to provide confluence resistance. Therefore, the selling momentum is valid as long as the price trades below the Cloud resistance where a bullish H4 candle above the 106.00 level would alter the current market structure. In that case, the price might move higher to the next resistance level at 114.92 level.
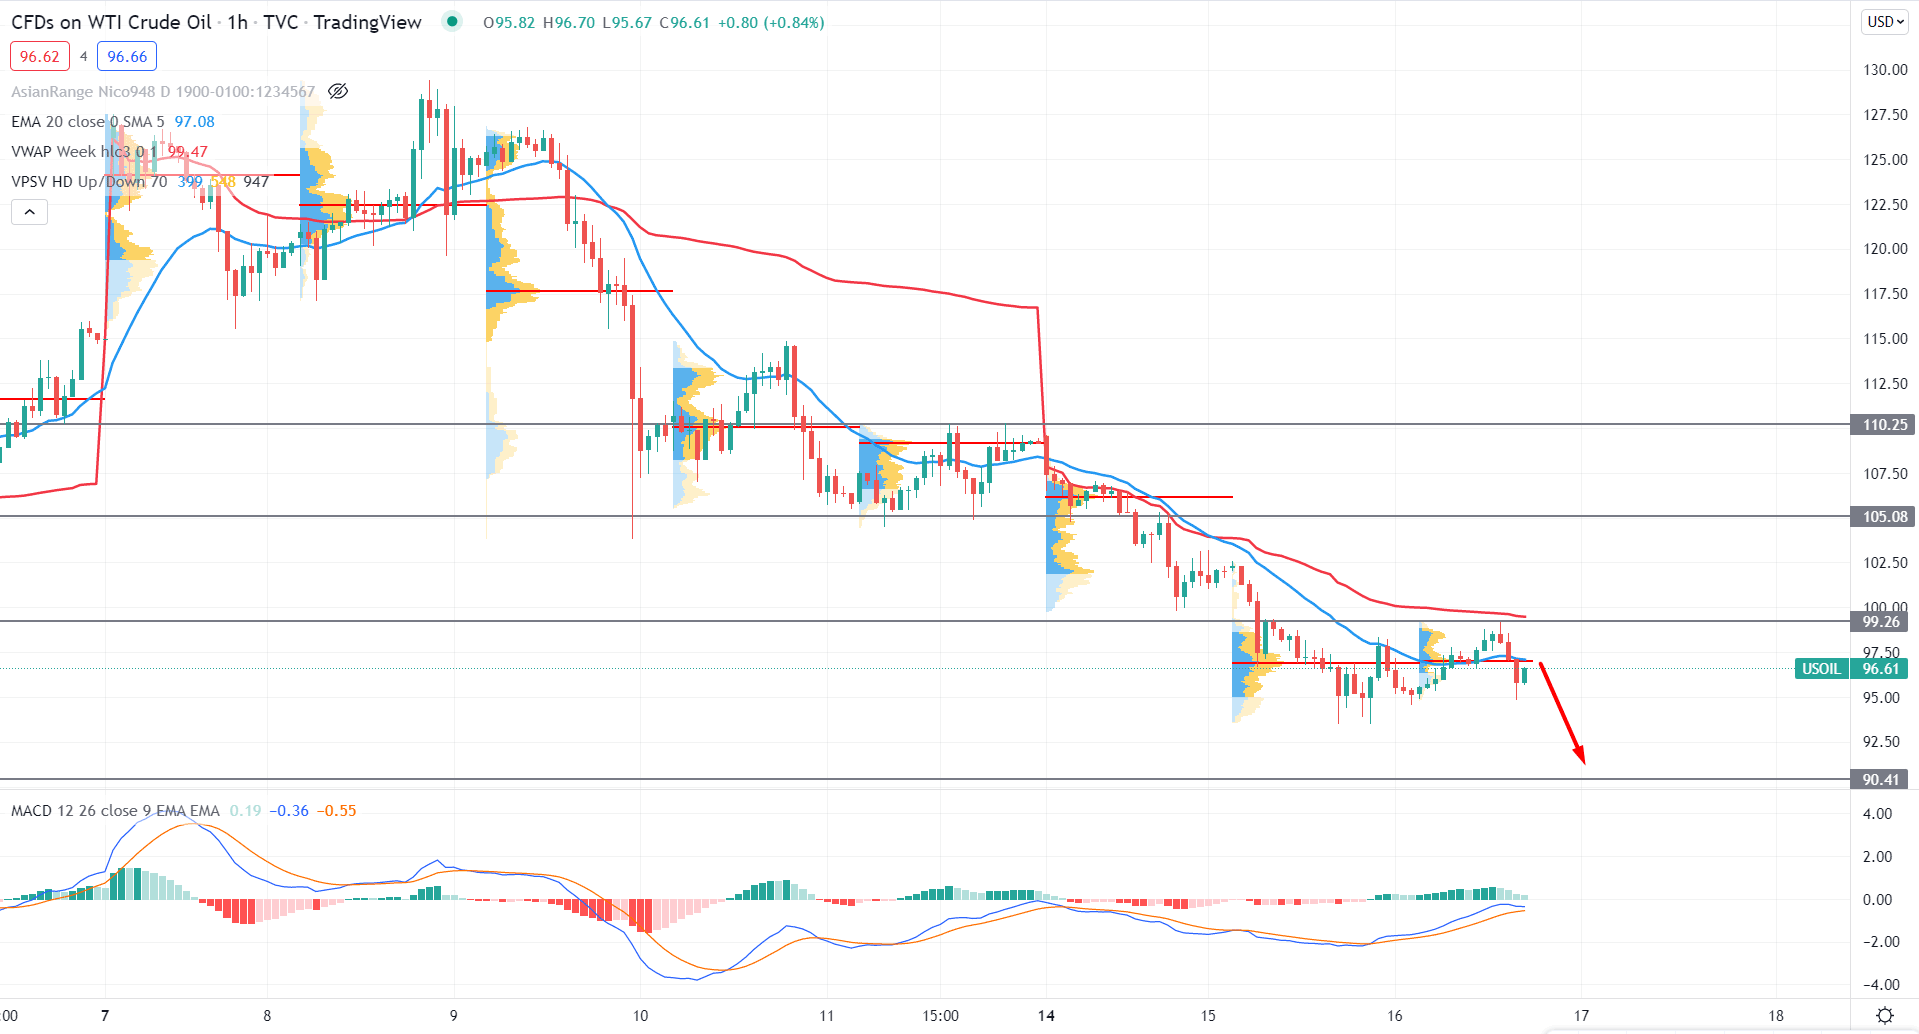
In the intraday chart, the Crude oil price is trending lower with a strong selling momentum that made consecutive lower lows in the intraday high volume level. Moreover, the bearish pressure below the 100.00 psychological level made bears overcome the dynamic 20 EMA level with a bearish H1 close.
The above image shows how the MACD Histogram is losing its bullish momentum where the MACD Line became corrective at the neutral zone. Meanwhile, the dynamic Weekly VWAP is above the price and confluence resistance to the bearish momentum.
In that case, investors should find a bearish rejection candle formation from 96.00 to 100.00 to anticipate the price towards the 90.00 level. On the other hand, any buying pressure above the 100.00 level might alter the current market structure and open rooms for testing the 110.25 level.
Based on the current multi-timeframe analysis, Crude oil will likely extend the recent selling pressure towards the 90.00 support level in the coming days. Moreover, the daily close below the 90.00 level might increase bear activity to test the 100 SMA support at the 80.00 area. In that case, the psychological 100.00 level would be the main barrier for bulls, where a bullish daily candle above the 100.00 level would open rooms for testing the 120.00 level.


