
Published: November 9th, 2023
Oil prices rebounded propelled by investors' cautious profit-taking and apprehensions regarding supply disruptions in the midst of escalating tensions between Israel and Palestine.
The escalating Israeli-Palestinian conflict has increased concerns regarding the availability of oil, which has resulted in sustained declines in prices and the potential for regional instability and disruptions along oil transportation routes.
Palestinian Foreign Minister Riyad al-Maliki, as reported by the official news agency of Palestine, stated in official correspondence on Wednesday that the prevailing sentiment in Israel against Palestinians is consistent with the perceived nuclear threat.
Notwithstanding these geopolitical considerations, Lisa Cook, a member of the board of governors of the US Federal Reserve, issued a warning on Wednesday that the intensifying tensions might have an additional adverse effect on the stagnant growth rates observed in Europe and China. Consequently, this may exert an impact on the course of the United States economy and hinder further escalations in crude costs.
Furthermore, data indicating a 0.2% monthly decline and a 2.7% year-over-year decline in China's Price Index for October reignited deflationary concerns. This development allayed oil market concerns.
In contrast to the 300,000-barrel decline that was anticipated, the American Petroleum Institute (API) unexpectedly disclosed on Tuesday an approximate escalation of 11.9 million barrels in crude oil inventories within the United States. This development indicated a reduction in the oil consumption of the most oil-consuming country globally, thereby constraining the growth of price pressures.
Let’s see the upcoming price direction from the WTI Crude Oil technical analysis:
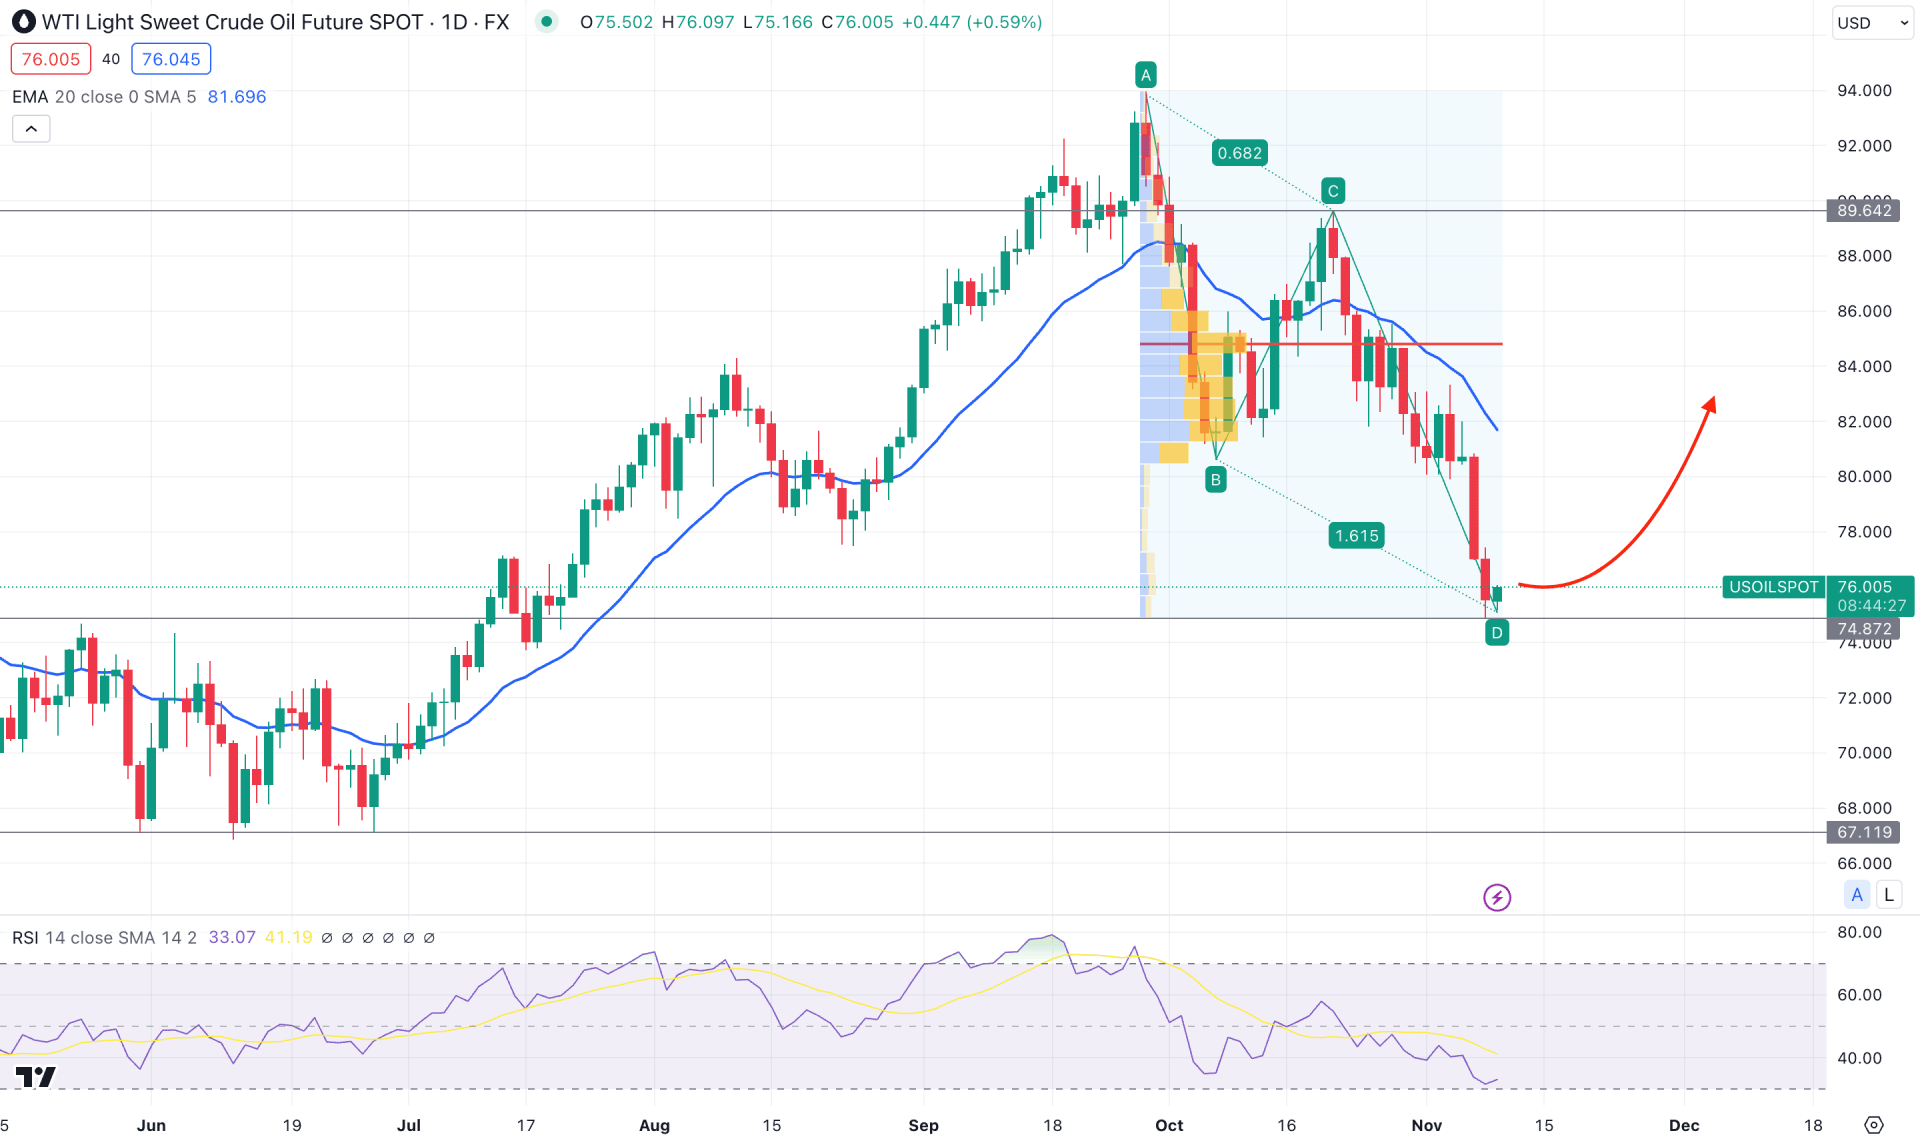
In the daily chart of WTI Crude Oil, the existing bullish momentum from the June 2023 low is questionable from the deeper discount. However, the recent price action suggests that bears might find a bottom from where an existing trend continuation could come.
In the higher timeframe, the monthly candle suggests a bearish trend continuation after an engulfing candle in October. However, the weekly candle suggests the existence of a congestion area, from where a minor upward correction could come.
In the volume structure, the most active level since the October 2023 high is at 84.92 level, which is 11% above the current price. Moreover, the dynamic 20 EMA formed a bearish crossover from the static high volume level, suggesting ongoing selling pressure.
In the Relative Strength Index (RSI), the current level hovers at the 30.00 area, which is a sign of aggressive selling pressure in the main price.
Based on this structure, investors should wait for a valid bullish candlestick formation from the ABCD correction. In that case, an upward pressure might come, where the primary aim is to test the 84.92 high volume level.
However, the bearish possibility needs a trend continuation by forming a candlestick below the 74.87 support level. In that case, the downside momentum might extend towards the 67.11 support area.
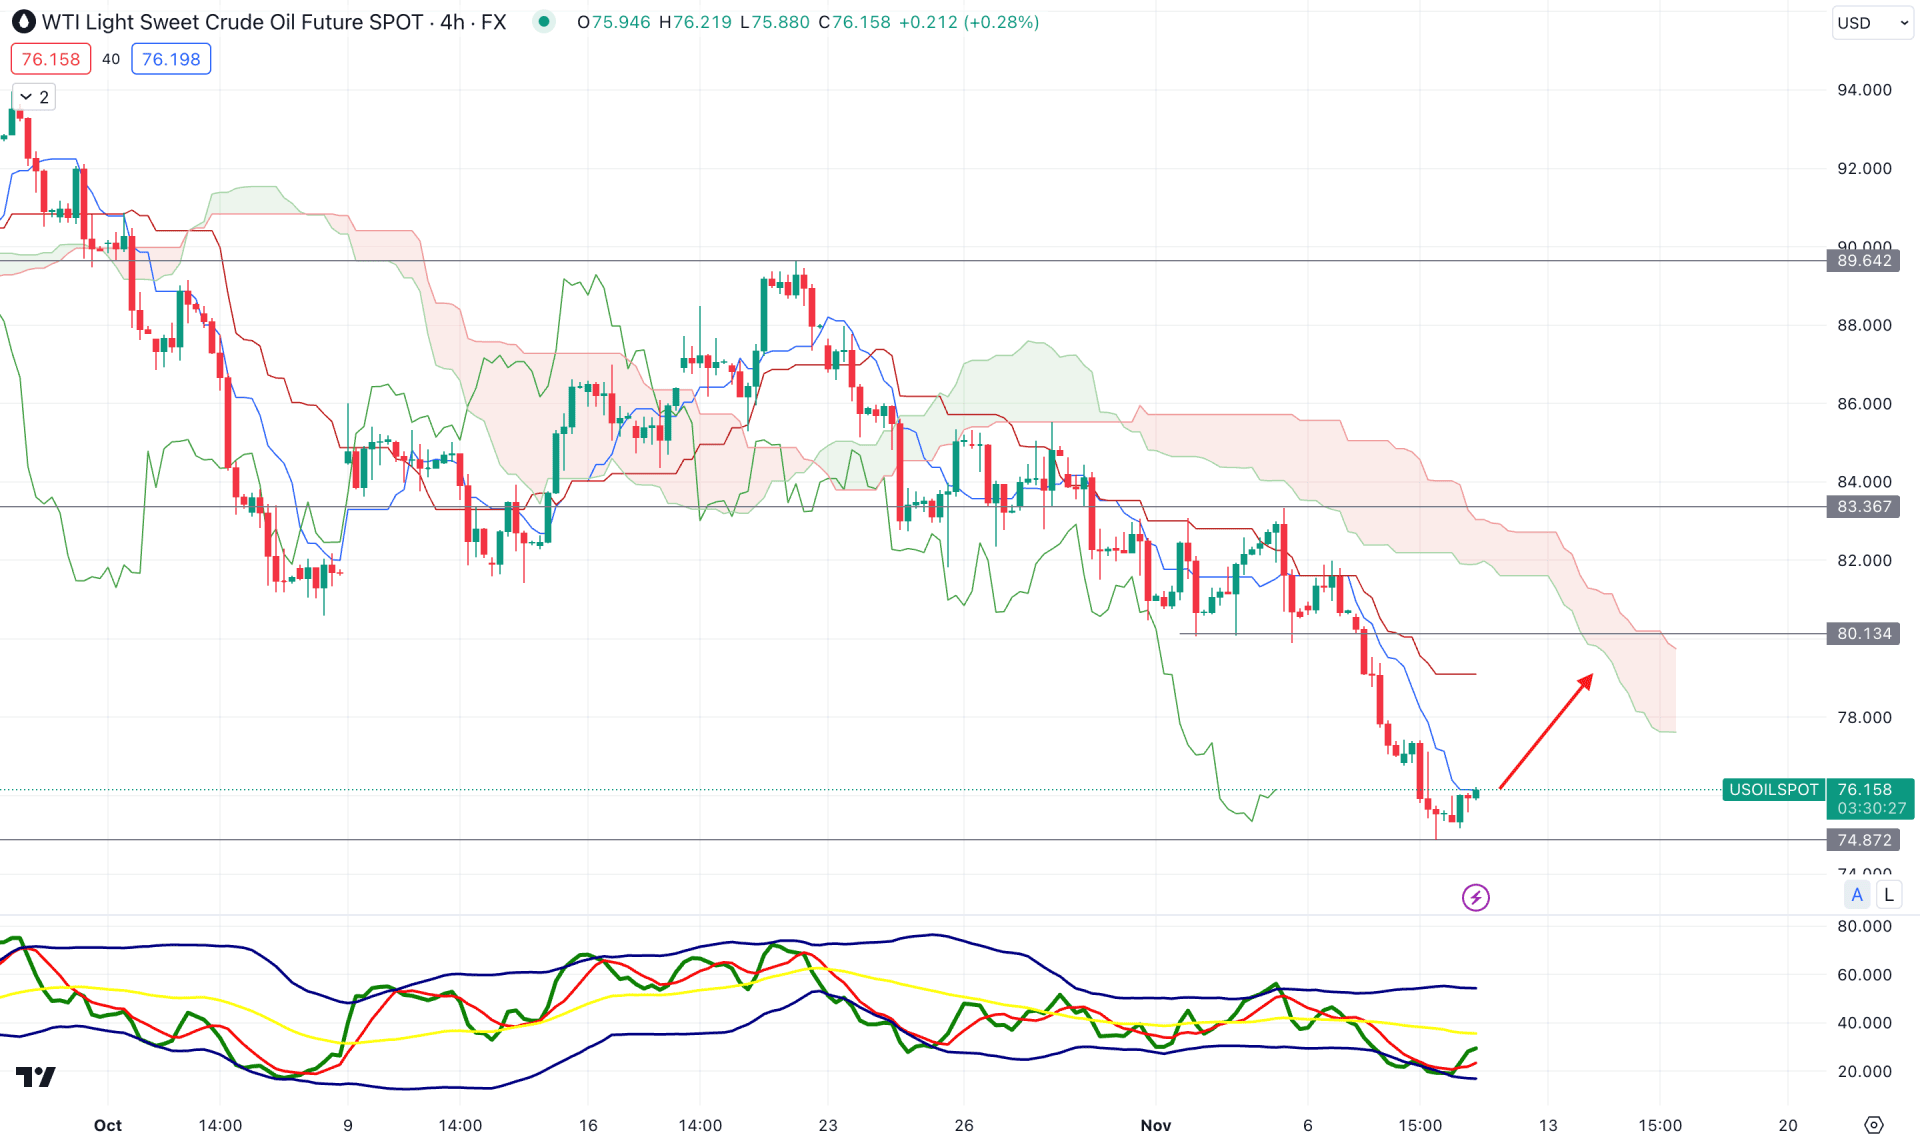
In the H4 chart, the current bearish momentum is strong as it trades below the dynamic Ichimoku Cloud resistance. Moreover, the future cloud suggests a bearish trend continuation as both lines show a downward slope.
In the indicator window, the Traders Dynamic Index (TDI) shows a bullish possibility as it shows a rebound from the lower band area.
Based on this structure, a bullish correction and a bearish rejection from the 80.13 to 83.36 zone could be a short opportunity, targeting the 72.00 level.
On the other hand, a bullish continuation and a stable price above the 84.00 level could eliminate the bearish possibility. In that case, the upside pressure could extend toward the 89.64 resistance level.
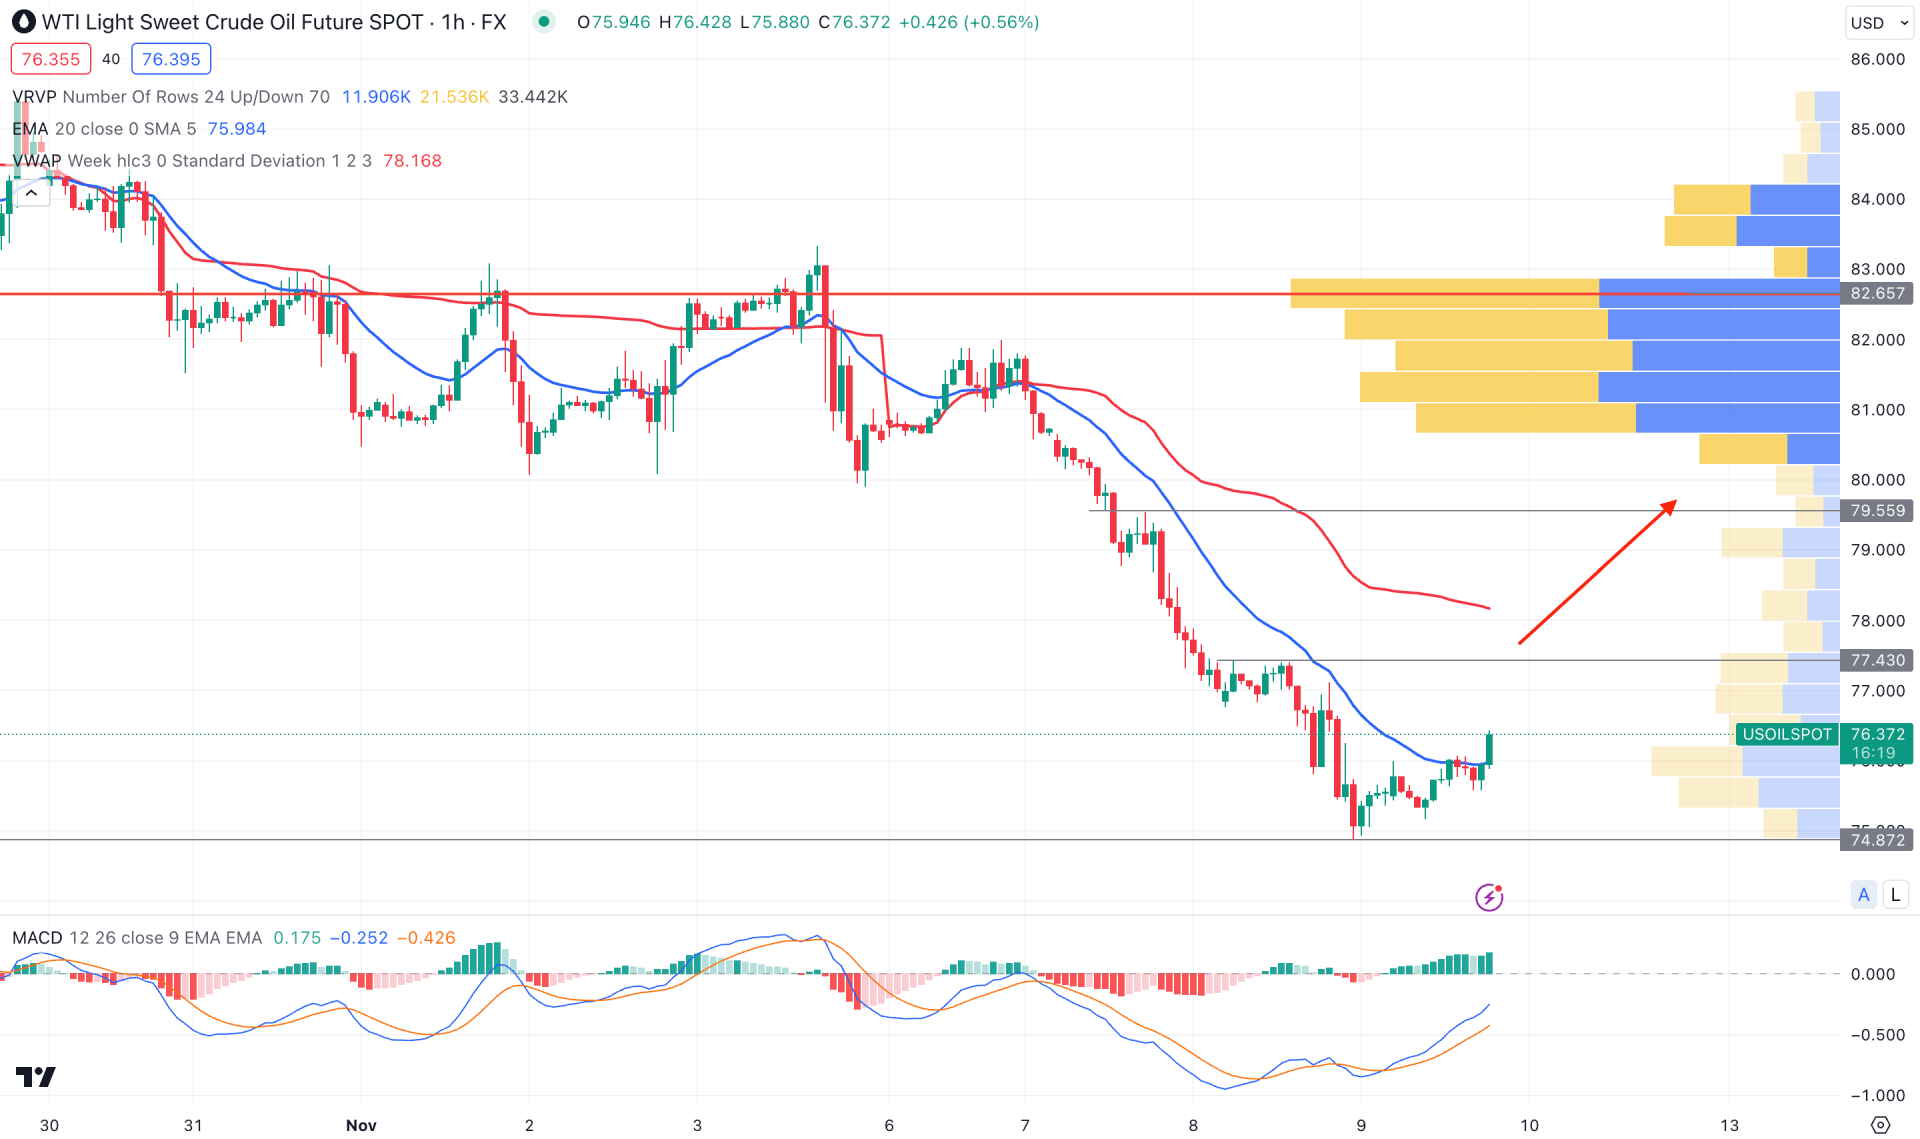
In the hourly chart of WTI, a bearish overextension is seen as the current price trades way below the visible range high volume level.
The price shows no significant buying pressure after tapping the 74.87 Fibonacci Extension level but recovered the loss above the dynamic 20 EMA.
The indicator window suggests a bullish possibility as the MACD Signal line formed a bullish crossover, supported by a PNP formation in the Histogram.
Based on this outlook, a bullish correction could extend towards the 79.56 resistance level from where bears may regain momentum. However, the bullish reversal needs a new high-volume formation at the bottom with a bullish H1 candle above the 80.00 psychological level.
Based on the current market structure, WTI Crude oil has a higher possibility of moving downside followed by the ongoing tension in the Middle East. However, a valid buying pressure from the ABCD bottom would be the primary signal of a buying pressure for the coming days.


