
Published: August 9th, 2023
On Wednesday, oil prices increased due to supply reductions headed by Saudi Arabia and Russia. These reductions helped alleviate concerns about sluggish demand from China, the world's biggest crude importer, and rising crude inventories in the United States.
As reported by state media on Tuesday, the Saudi Arabian cabinet reaffirmed its support for the precautionary measures implemented by the Organisation of the Petroleum Exporting Countries and its allies (OPEC+) to stabilise the market.
The market anticipates no further interest rate increases in the near future, with a possible reduction in the Fed funds target rate by the middle of next year.
However, the enthusiasm surrounding a more relaxed Fed policy was somewhat subdued in the days leading up to Tuesday's session, as several Fed speakers reaffirmed the commitment to a "higher for longer" approach.
In addition, Federal Reserve Governor Michelle Bowman opined that additional rate hikes may be necessary to bring inflation down to the Federal Open Market Committee's (FOMC) target level. To gauge the tightness of the crude oil market in the coming week, market participants will attentively monitor API and EIA inventory reports.
Let’s see the complete price outlook from the WTI Crude Oil technical analysis:

In the daily price of WTI, the current buying pressure is backed by a solid fundamental outlook. Moreover, the recent trend line resistance breakout with a solid bullish continuation pattern could result in a valid trend change.
As per the current volume structure, the current high volume level from April 2023 is at 71.61 level, which is below the current price. Moreover, multiple bullish rejection candlestick formations are seen in the bullish rally, indicating a trend continuation.
In the higher timeframe price action, A V-shape recovery is seen in the monthly candle while the current price is trading above the July 2023 high. In the weekly candle, the bullish continuation pattern is clear as the price increases for six consecutive trading weeks.
A bullish crossover is visible in the daily price as the 20 EMA crosses the 100-day SMA, while both lines are below the current price. Also, the sell-side liquidity sweep at the 67.00 support level supports the existing buying pressure, which could work as a confluence of support to bulls.
In the secondary window, the current Relative Strength Index (RSI) shows extreme buying pressure as the current reading is at the 70.00 overbought level. It is a sign that the current buying pressure has already shown a significant movement, which needs a valid correction to resume.
Based on the daily price outlook, the bullish trend continuation pattern could increase the price towards the 93.72 resistance level in the coming days. However, a downside correction is possible, offering an additional buying opportunity from the 77.00 to 72.50 zone.
However, a bearish pressure with a daily candle below the 67.00 level could lower the price in the coming days. The downside momentum could extend towards the 50.00 psychological level in that case.
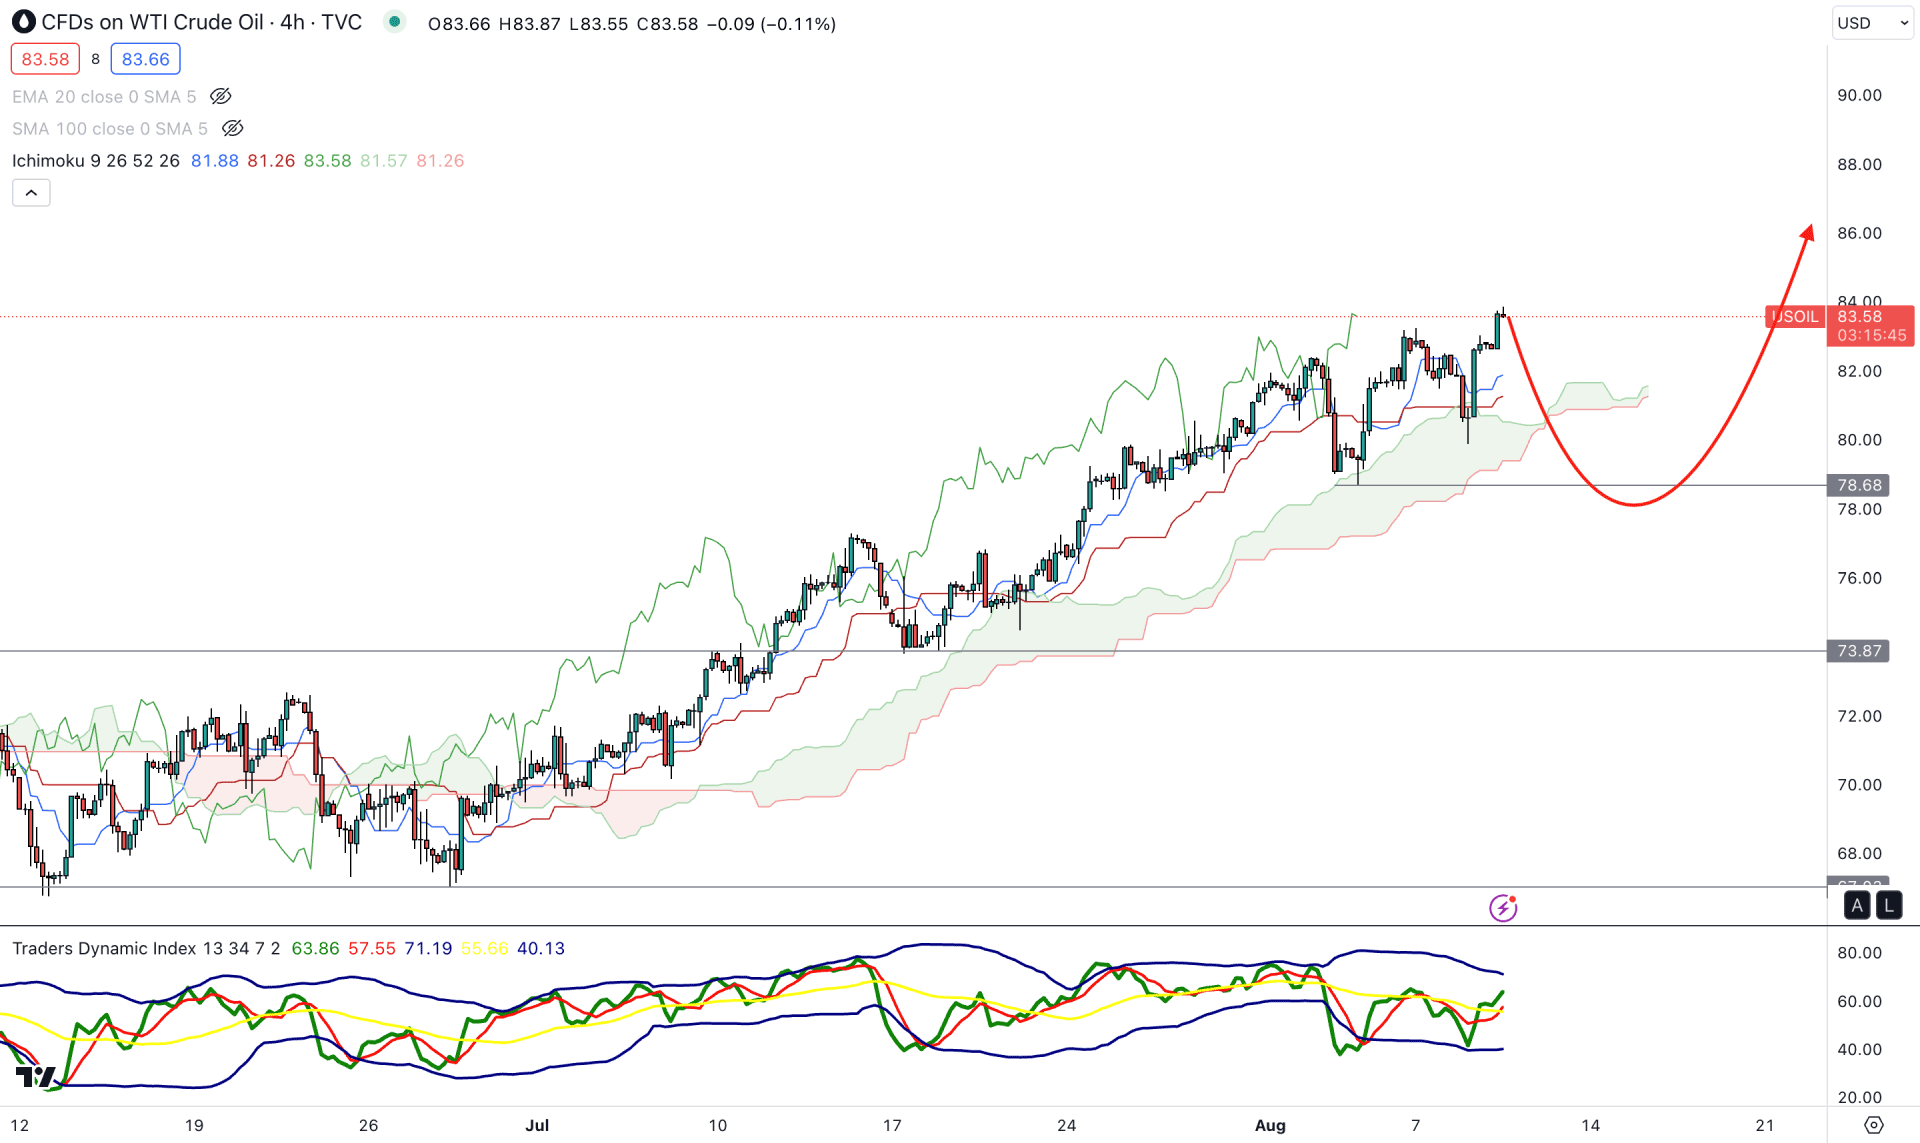
In the H4 timeframe, the current price shows an upward pressure as it trades above the Ichimoku Kumo Cloud zone. Moreover, multiple bullish rejections are seen above the cloud area, signaling a strong trend continuation opportunity.
The current TDI line showed a bullish reversal in the indicator window with a stable momentum above the 50.00 line. The future cloud shows buying pressure as the Senkou Span A and B showed an upward slope.
Based on the current Ichimoku Cloud outlook, a bullish trend continuation opportunity needs a valid sell-side liquidity sweep before offering a long opportunity. A downside momentum and a bullish rejection from the 80.60 to 77.00 area could offer a long opportunity, targeting the 90.00 level.
On the other hand, a bearish pressure with an H4 candle below the 76.00 level could lower the price towards the 67.00 area.
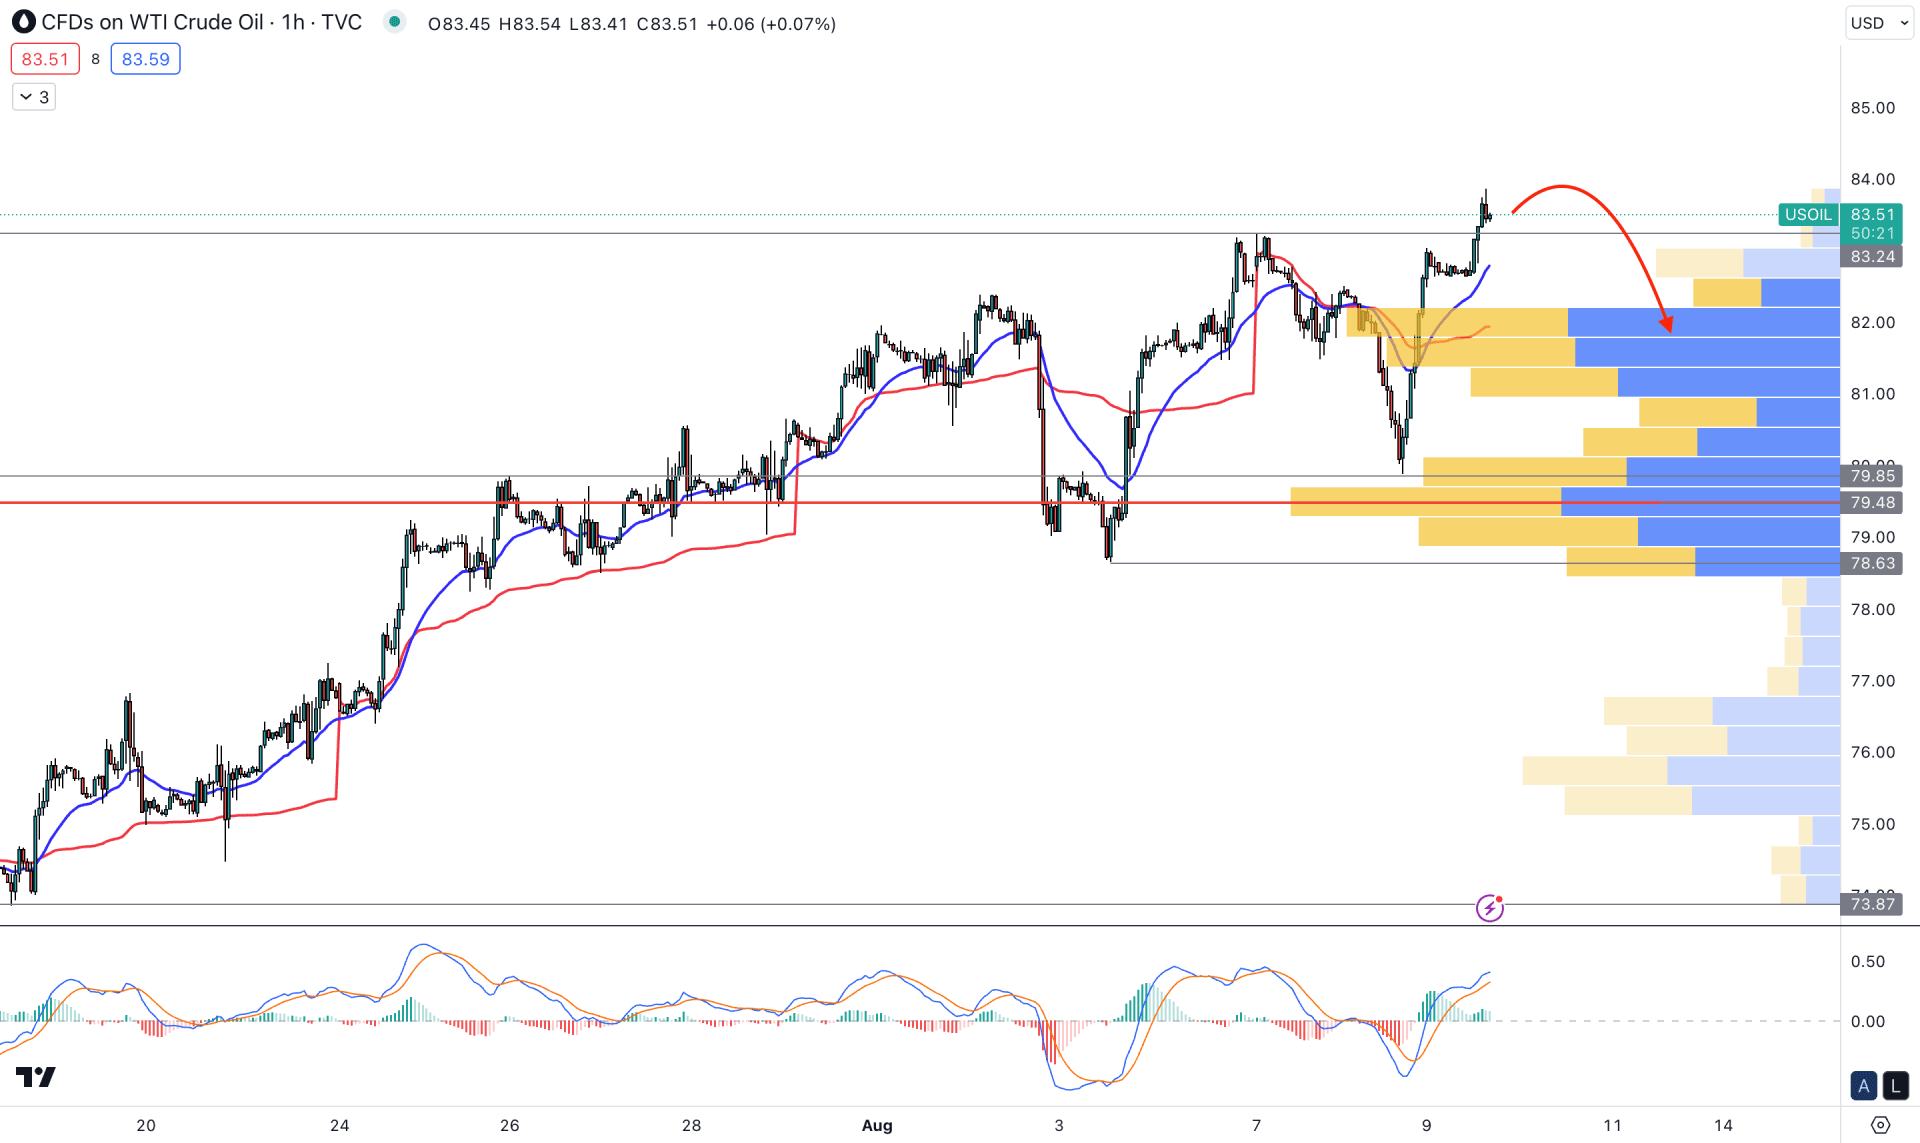
In the intraday price, WTI is trading within a buying pressure, but the current bullish rally above the 83.24 resistance level has faded with a bearish H1 candle.
As per the visible range high volume level, the current highest activity level is spotted at the 79.48 level, which is 4.86% lower than the current price. Moreover, another static support level is at the 79.85 level, which is above the high volume level. As the current price is way above the high volume level, we may expect a downside correction as a mean reversion.
The indicator window shows an overbought condition as the current MACD EMA levels are at the upper limit zone, while the current MACD Histogram is bullish.
Based on this outlook, we may expect a downside correction in the WTI H1 price, where a bearish H1 candle, 82.50 level, could lower the price towards the 81.00 level.
Based on the current market outlook, a sufficient downside correction is pending in the intraday chart. However, the broader outlook is still bullish and any bullish recovery from the intraday support area could resume the trend.


