
Published: September 7th, 2022
A group of the world's top oil producers agreed to cut the output from next month, which surprised the energy market at the time of economic turmoil.
OPEC and its non-OPEC partners formed OPEC+, which decided to cut oil production by 100,000 barrels per day from October 2022. This decision comes after an agreement to increase the oil production by 100,000 barrels a day in the previous month. The decision came after US president Joe Biden visited Saudi Arabia, where the main aim was to discuss bringing the global energy price down.
The Oil prices moved lower sharply from the Monday session, while the international benchmark Brent Crude futures is 4.38% down from the weekly high. The US West Texas Intermediate futures is also 4.08% down from the weekly high, facing critical support at the 85.60 level.
In the broader context, oil prices have been around 25% down since early June, after reaching the multi-year high. The selling pressure was boosted by the ongoing concern of higher interest rates and Covid-driven restrictions in China that could slow economic growth.
Let’s see the future price direction of US Oil from the WTI Crude Oil Technical Analysis:
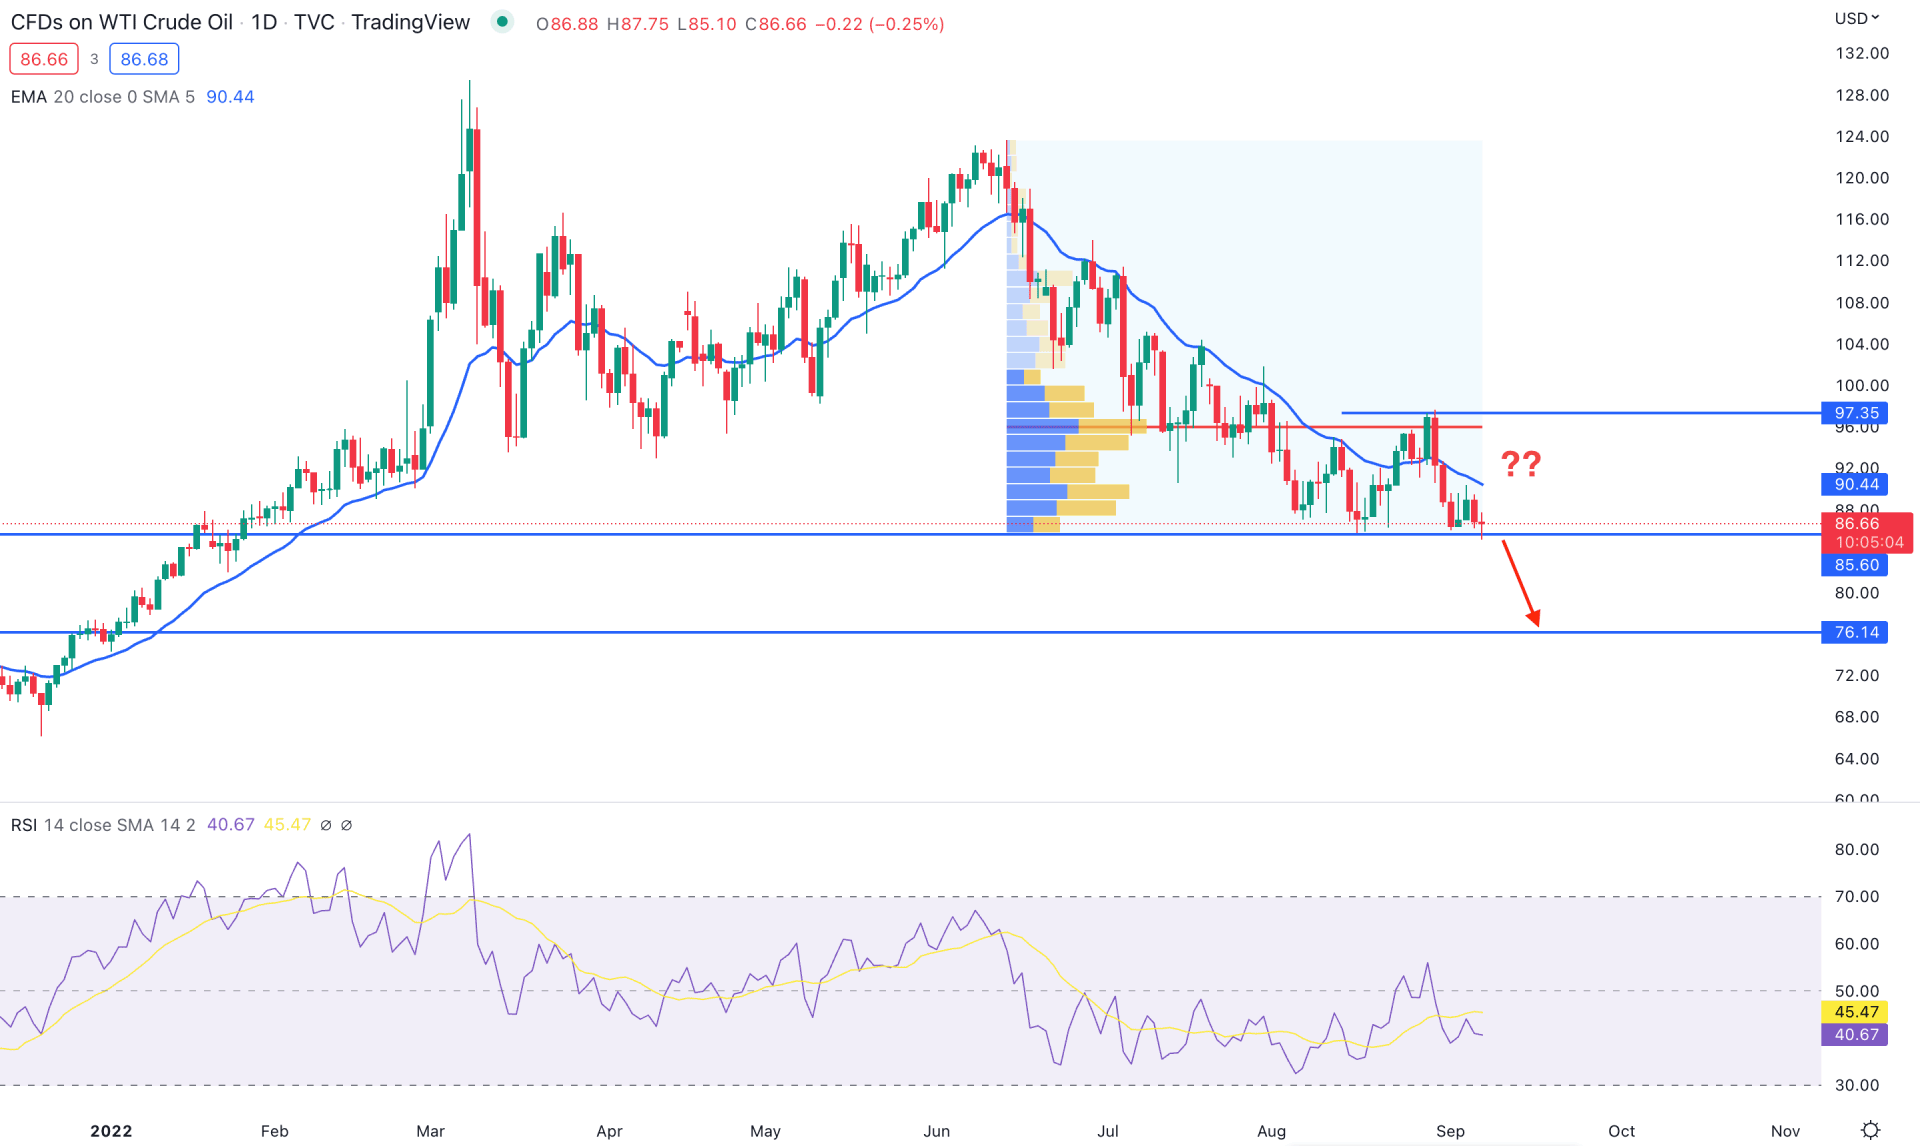
In the WTI Crude daily chart, the selling pressure from June 2022 high to the August 2022 low came with a counter-impulsive momentum. However, the selling pressure did not come with enough volume support until a bullish false breakout appeared at the 97.35 level.
Bears took the price lower towards the 85.60 level from where bulls tried to recover, but an immediate rebound from the 97.35 level with the massive high volume level at 96.02 area increased the bearish possibility. As a result, as long as the price trades below the 96.02 level, the selling pressure might extend, and the ultimate target would be the 76.14 support level.
The dynamic 20-day Exponential moving average is acting as an immediate resistance to the price, while the current RSI level is more likely to reach the oversold 30 level.
Based on the daily stricture, investors should closely monitor how the price trades at the 85.60 support level, from where a bearish break would open room for testing the 76.14 support level.
On the other hand, the alternative approach is to find a strong bullish rejection candle on the daily chart above the dynamic 20 EMA, increasing the possibility of reaching the 97.35 level.
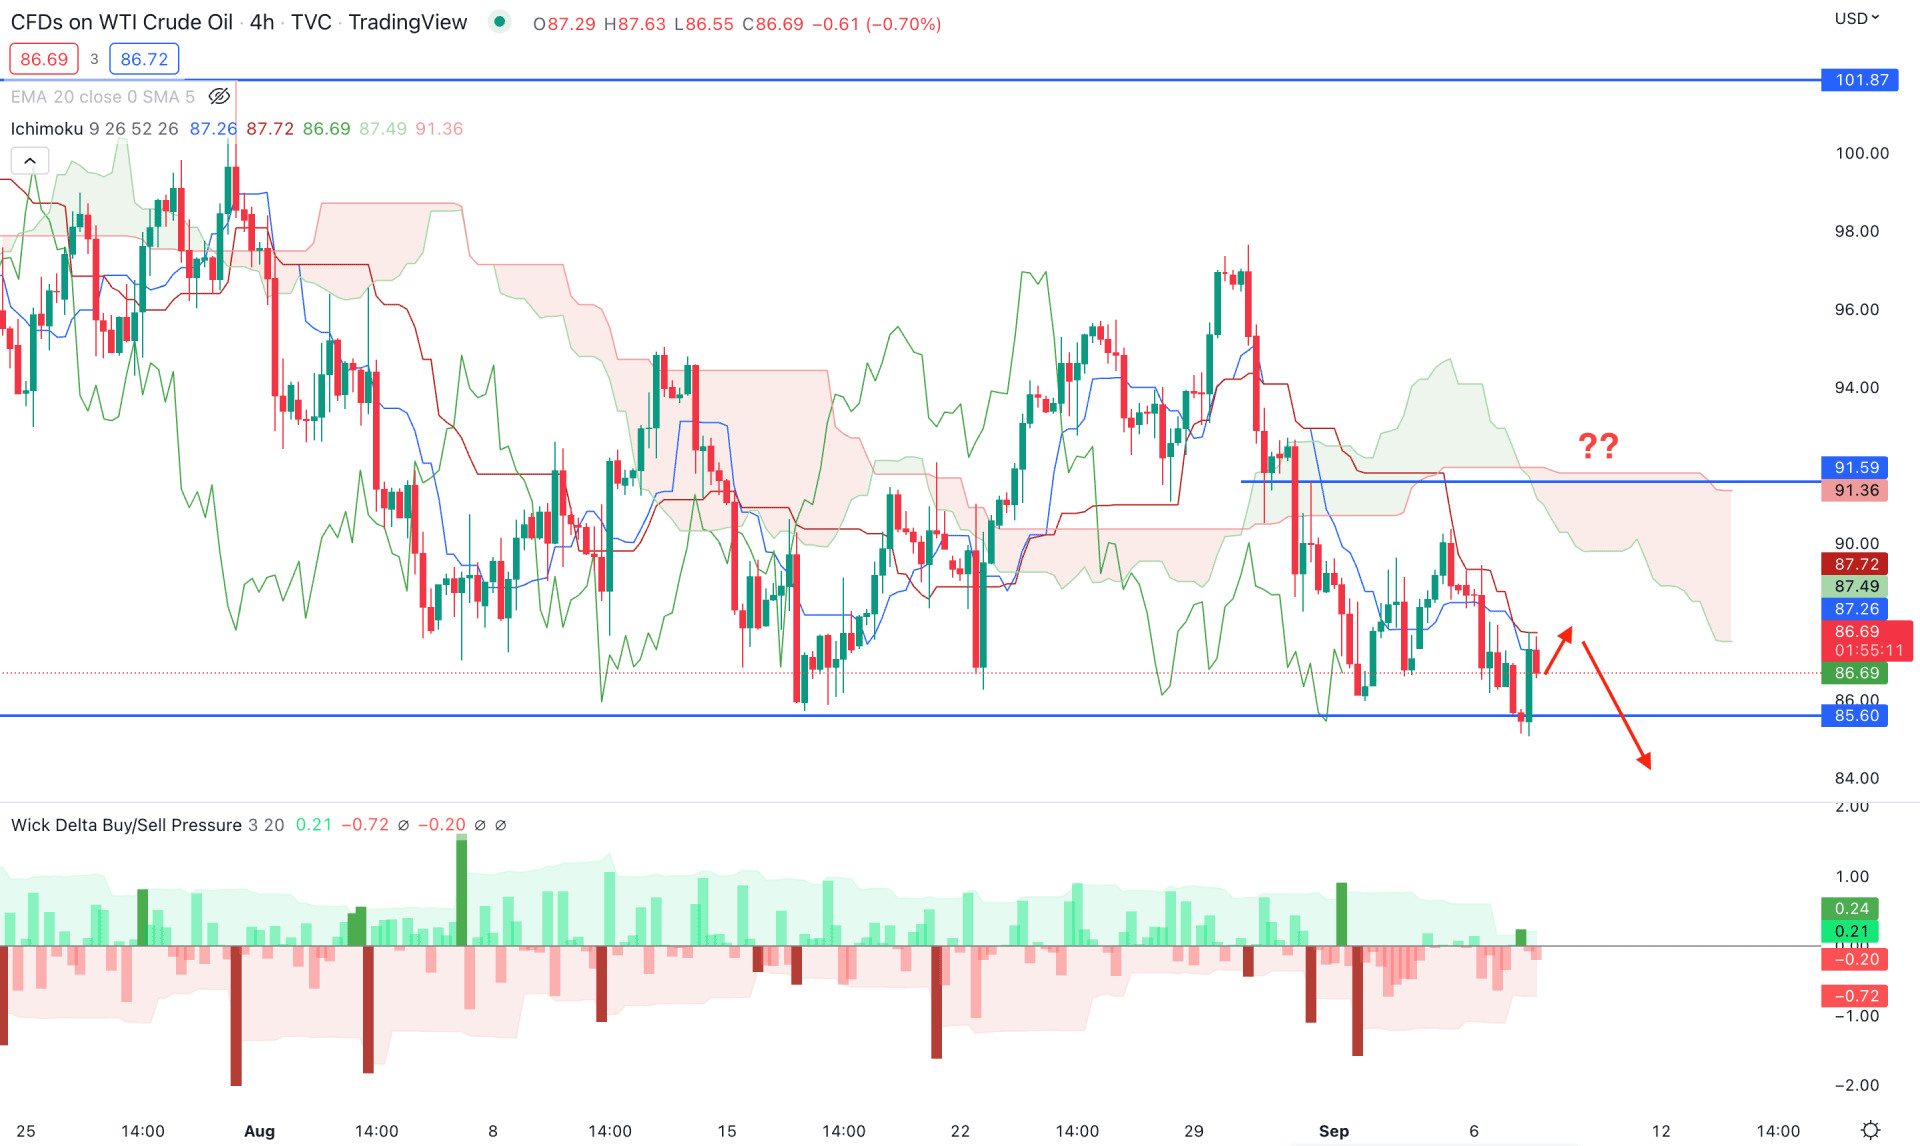
WTI Crude Oil H4 chart shows a strong sellers’ presence in the market, coming from the massive bullish pressure in August, above the Kumo Cloud with an immediate rebound. As a result, the stable selling pressure below the cloud resistance might grab sellers' interest by breaking down the 85.60 support level.
In the current H4 chart, the Senkou Span A is below the B in the future cloud with a strong gap, indicating a strong bears’ presence in the market. The Lagging Span is within the price, increasing the possibility of a bearish breakdown.
In the indicator window, buying and selling pressure remained calm since 1 September, indicating that investors are looking for a strong reason before setting a direction.
Based on the H4 context, a bearish pressure below the 85.60 level would increase the selling possibility in this pair towards the target of the 80.00 level. On the other hand, a strong buying pressure above 87.20 is needed to see the price at the 100.00 psychological level.
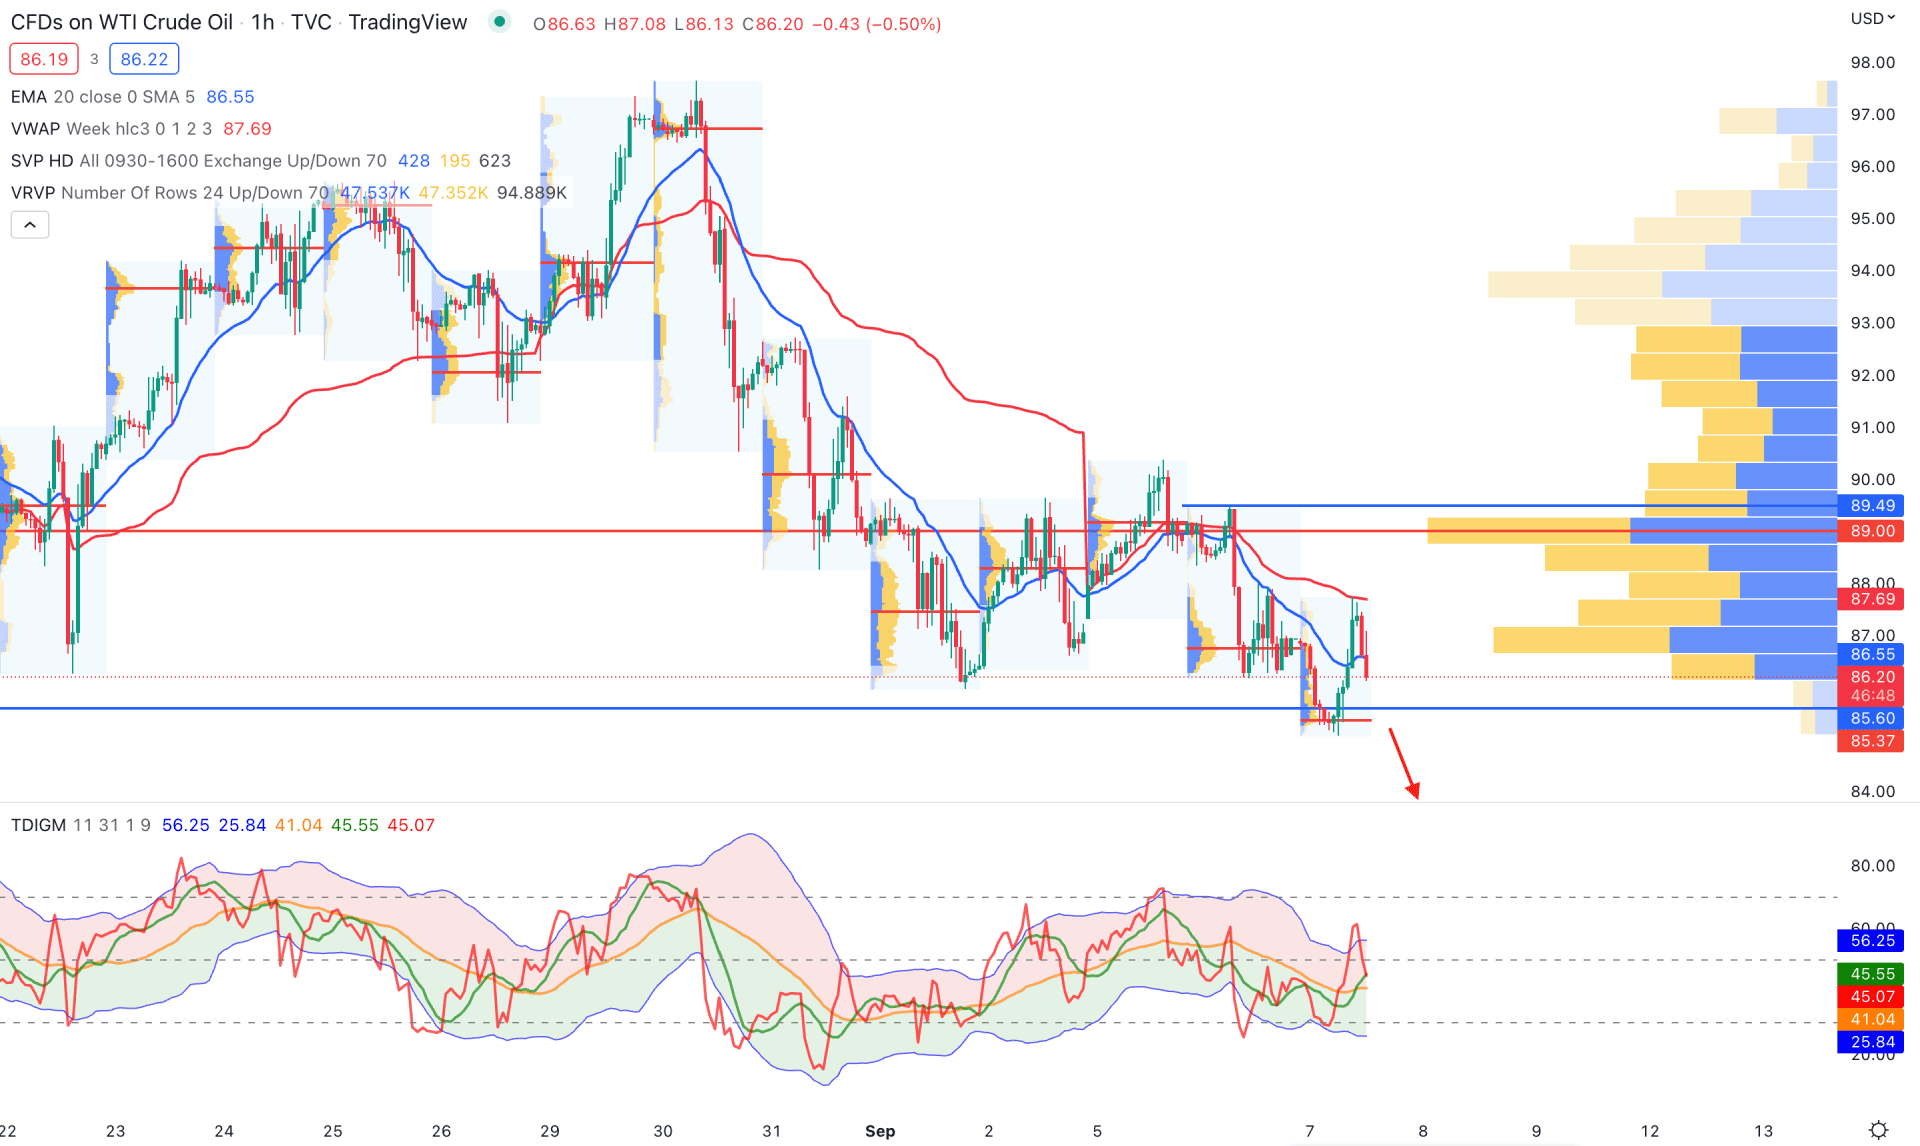
In the WTI Crude Oil H1 chart, the current price trades within an extreme selling pressure supported by dynamic levels and volume structure.
According to the visible range high volume level, the highest trading volume since 22 August is at 89.00 level from where the most recent selling pressure came. Moreover, the dynamic 20 EMA and weekly VWAP are above the current price, working as immediate resistance.
Based on the Traders dynamic index, the current TDI level rebounded from the upper band and is likely to drop below 40%.
In this case, any bearish H1 candle below the 85.60 level would lower the price towards the 80.00 level in the coming hours.
Based on the current multi-timeframe analysis, WTI Crude Oil is likely to lose its value in the coming days, where the 85.60 level would be the most important price level to look at. Any selling pressure with a daily close below this level would be a decent bearish opportunity in this instrument.


