Published: May 30th, 2024
As markets anticipated data on U.S. crude oil stockpiles, oil prices have remained relatively stable recently. Nevertheless, robust economic activity in the United States indicated that borrowing expenses could remain high for a prolonged duration, potentially impeding demand.
Wednesday's market reports cited American Petroleum Institute data indicating that U.S. crude oil and petrol inventories decreased last week while distillate inventories increased. For the week ending May 24, the API reported that crude stocks decreased by 6.49 million barrels, petrol inventories rose by 452,000, and distillates inventories rose by 2.045 million barrels.
Analysts had anticipated that U.S. crude stocks would decline by 1.9 million barrels, while petrol inventories would increase by 1 million barrels and distillates by 0.4 million barrels, respectively. Later on Thursday, information from the U.S. Energy Information Administration (EIA) is anticipated.
Delegates and analysts from OPEC+ suggest that increasing worldwide oil stocks in April due to sluggish fuel demand could bolster the argument for OPEC+ members. Therefore, Russia and the Organisation of the Petroleum Exporting Countries (OPEC) are more likely to maintain supply cuts at their June 2 summit.
Oil markets have been under pressure due to expectations that the Federal Reserve will maintain elevated interest rates for an extended period of time. According to a Federal Reserve survey, U.S. economic activity continued to expand from early April to mid-May. However, businesses became more pessimistic about the future, and inflation rose moderately.
In general, increased financing expenses limit funds and consumption, which hurts crude demand and prices. The Federal Reserve is now anticipated to initiate rate cuts no later than September, as opposed to the June start date that markets had previously projected.
Let's see the upcoming price direction of the WTI Crude Oil from the WTI technical analysis:

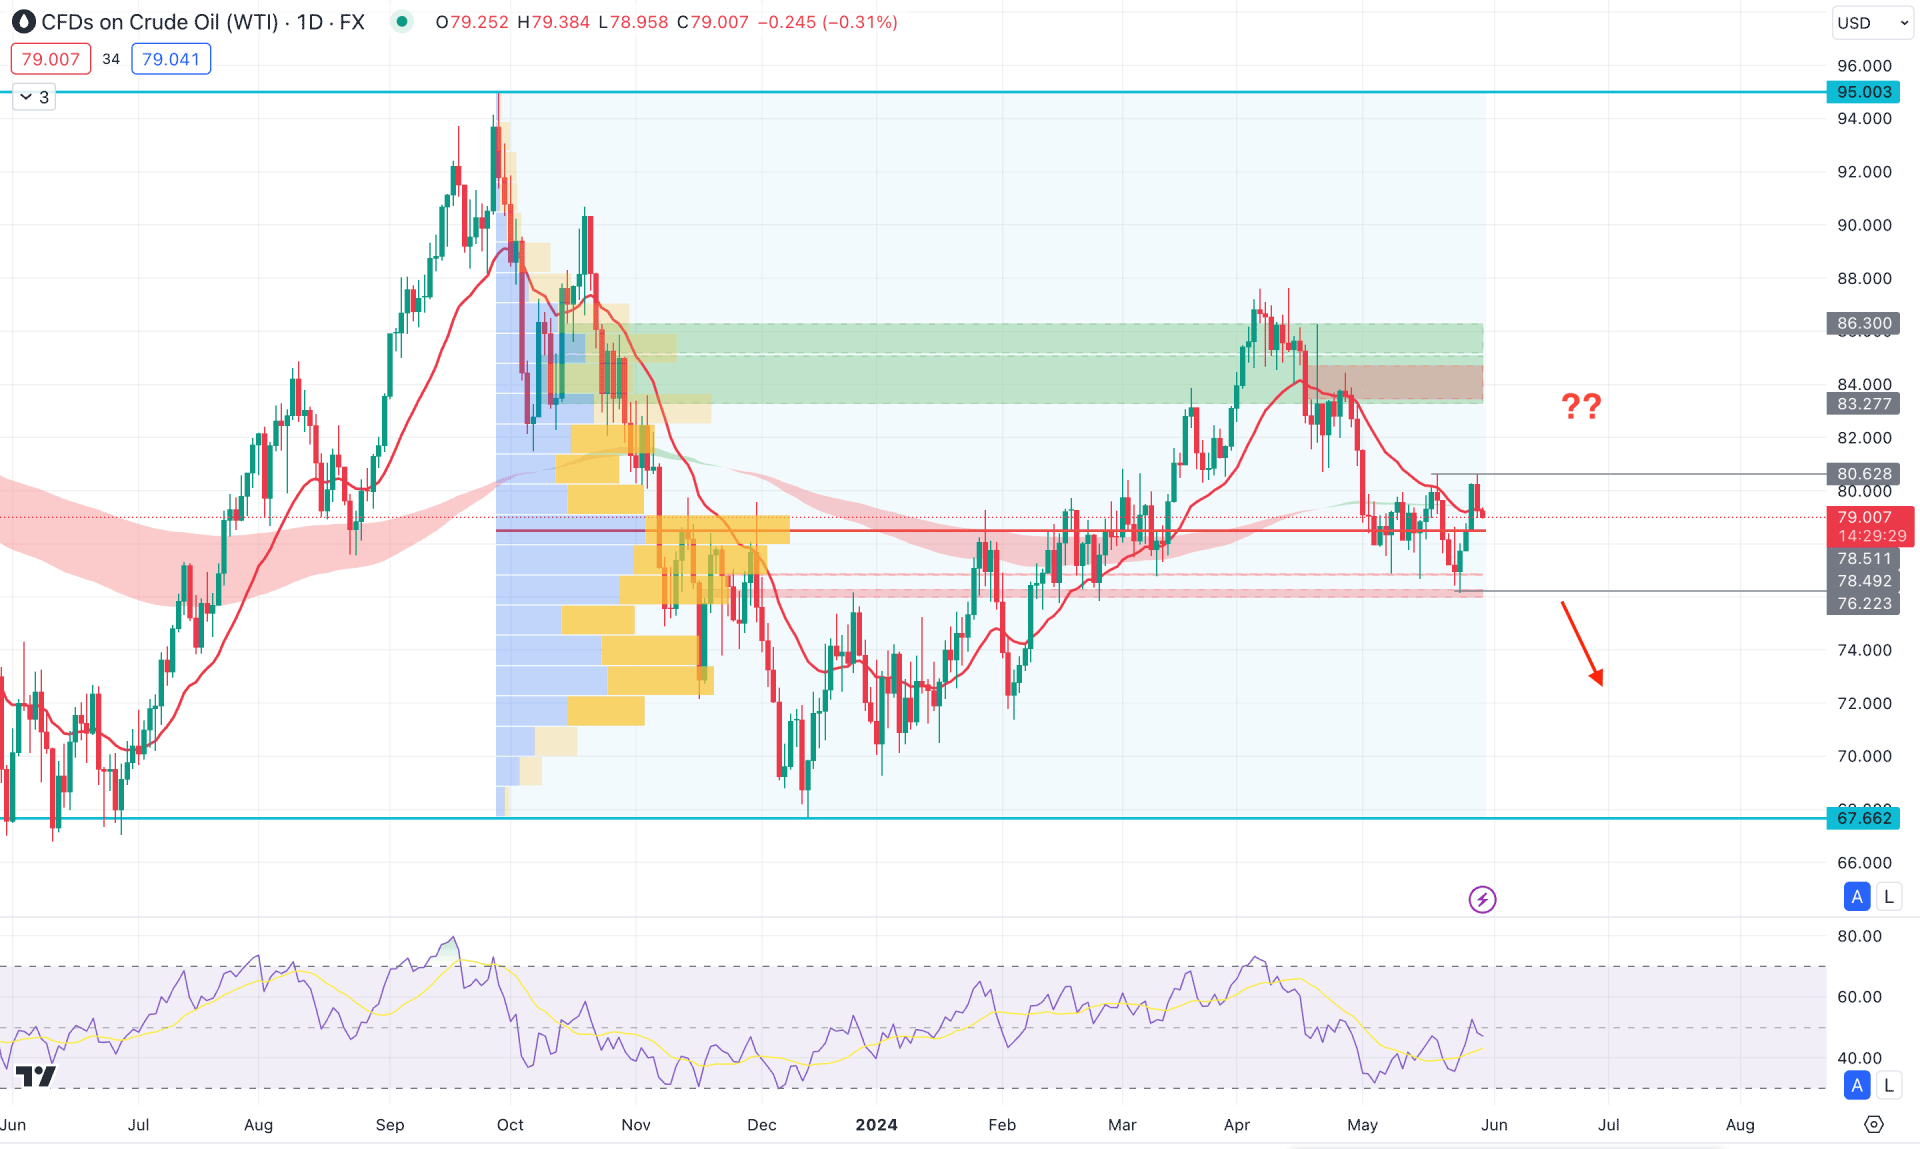
In the daily chart of WTI Crude Oil, a corrective price action is seen as the most recent price was sideways within a rectangle pattern. In this context, the primary aim of this instrument is to look for a potential breakout before forming an impulse.
Looking at the broader context, the bottom formation at the 67.66 level created a 29.28% gain to the 87.51 level before moving bearish with a corrective pressure. However, the recent price failed to show a clear momentum as the MA wave remained flat for more than two months. However, the current price still trades above the 50% Fibonacci Retracement level of the existing bullish wave, so we may expect buying pressure soon after having a solid price action.
In the volume structure, the largest activity level since October 2023 is at 78.51 level, which is just below the current price. Moreover, the dynamic 20 day EMA is in line with the current price, which is acting as an immediate resistance.
In the secondary indicator window, the current Relative Strength Index (RSI) suggests a corrective pressure as the current level hovers at the 50.00 neutral line.
Based on the daily market outlook of WTI Crude Oil, the recent downside pressure from the 80.62 double-top pattern indicates a bearish pressure. In that case, a downside continuation with a daily candle below the 76.22 low could be a bearish opportunity, targeting the 70.00 psychological level.
On the other hand, a bullish continuation needs proper validation by having daily cable above the immediate double-top high. In that case, bulls might extend the momentum and find resistance at the 86.30 to 83.27 imbalance. A successful break above this zone could initiate a long-term bull run toward the 95.00 high.

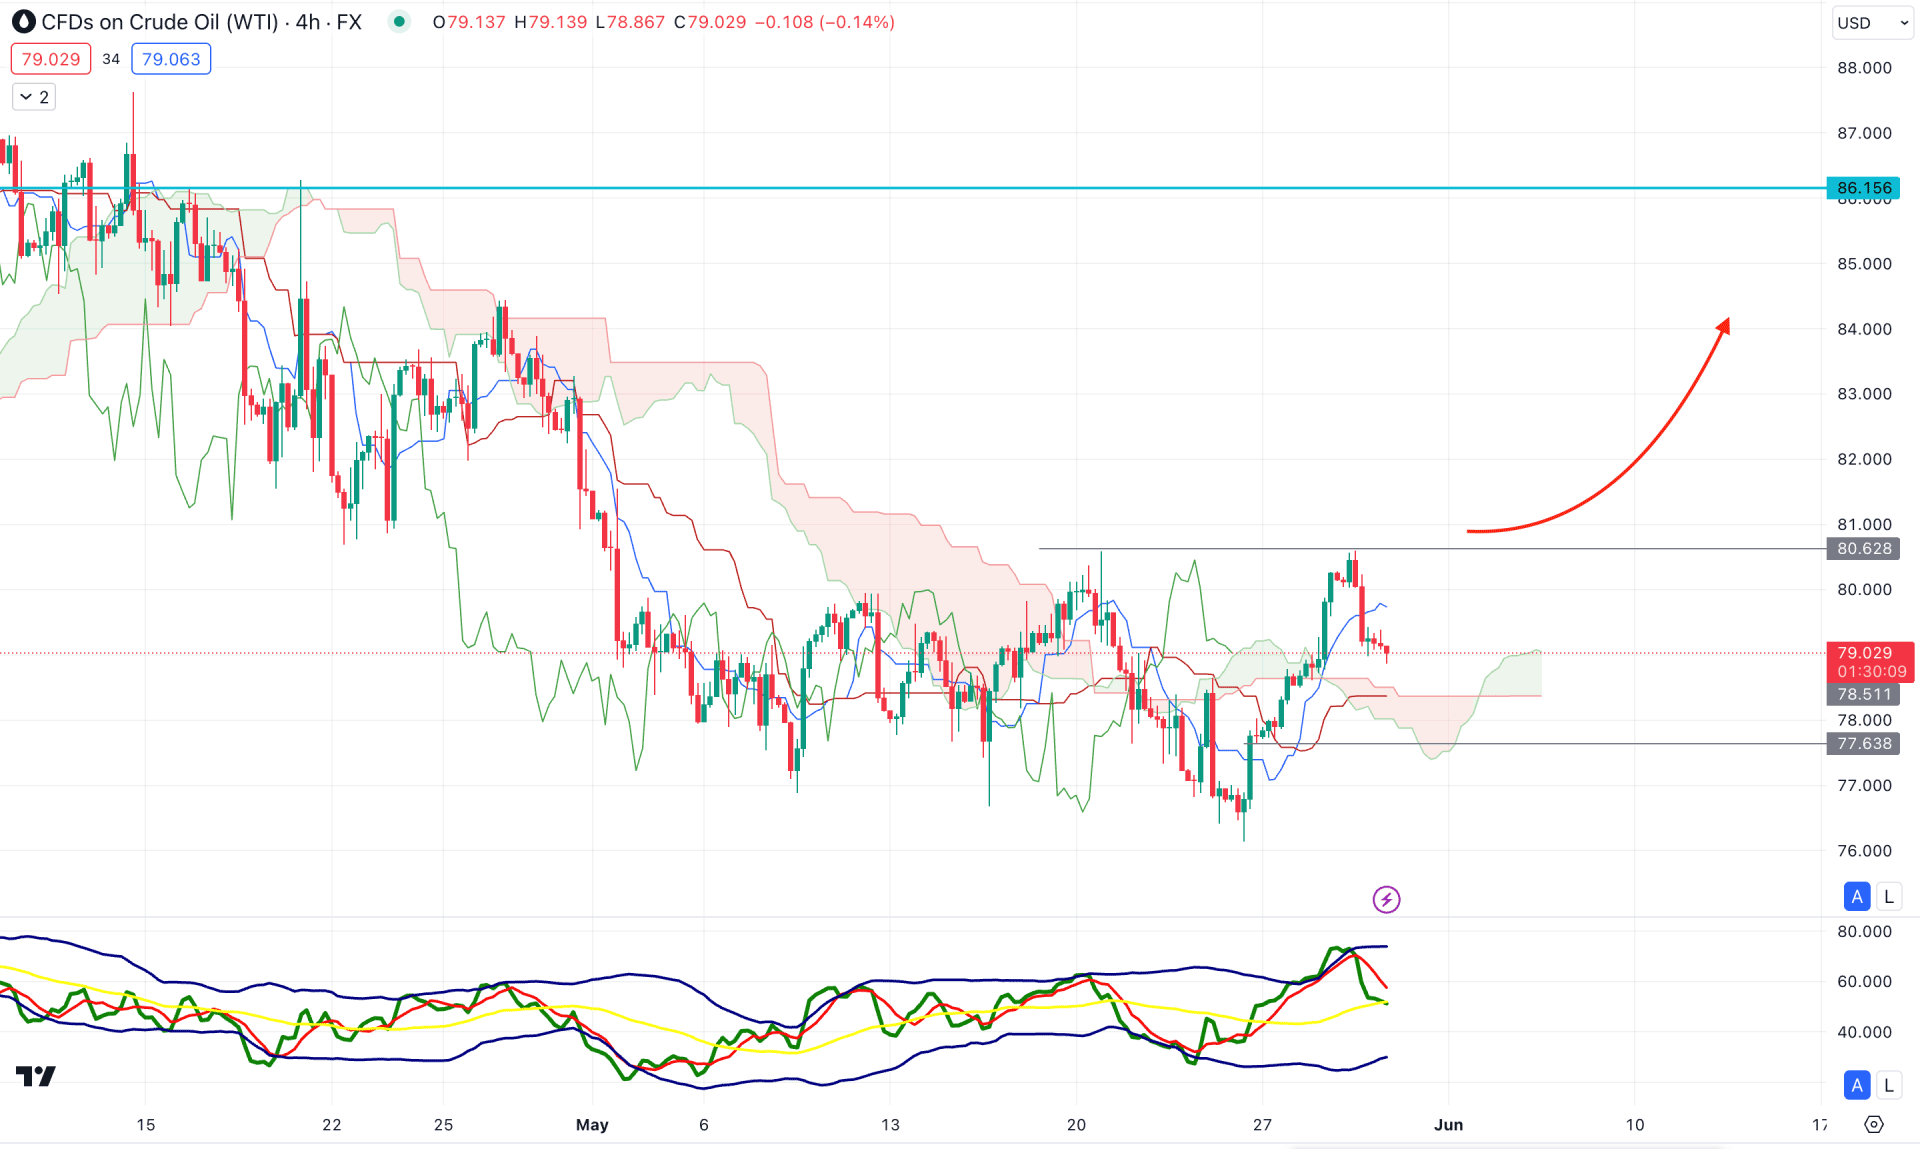
In the H4 timeframe, the recent price formed a sell-side liquidity sweep at the 76.66 low from where a bullish counter-impulse has come. However, the recent price failed to break above the 80.62 high and showed a downside correction from this line.
According to the Ichimoku Cloud structure, the recent downside pressure took the price below the dynamic Tenkan Sen line, which is a primary barrier to bulls. Moreover, the Senkou Span B remains flat in the future cloud, which suggests a neutral momentum from medium term traders.
In the secondary window, the Traders Dynamic Index (TDI) found a peak at the upper band's area, which still remains above the 50.00 neutral point.
Based on the H4 market structure, a bullish trend might extend after having a stable H4 candle above the 80.62 resistance level, before targeting the 86.15 level.
On the other hand, a downside continuation with a bearish pressure below the Ichimoku Cloud low could extend the loss towards the 75.00 psychological line.

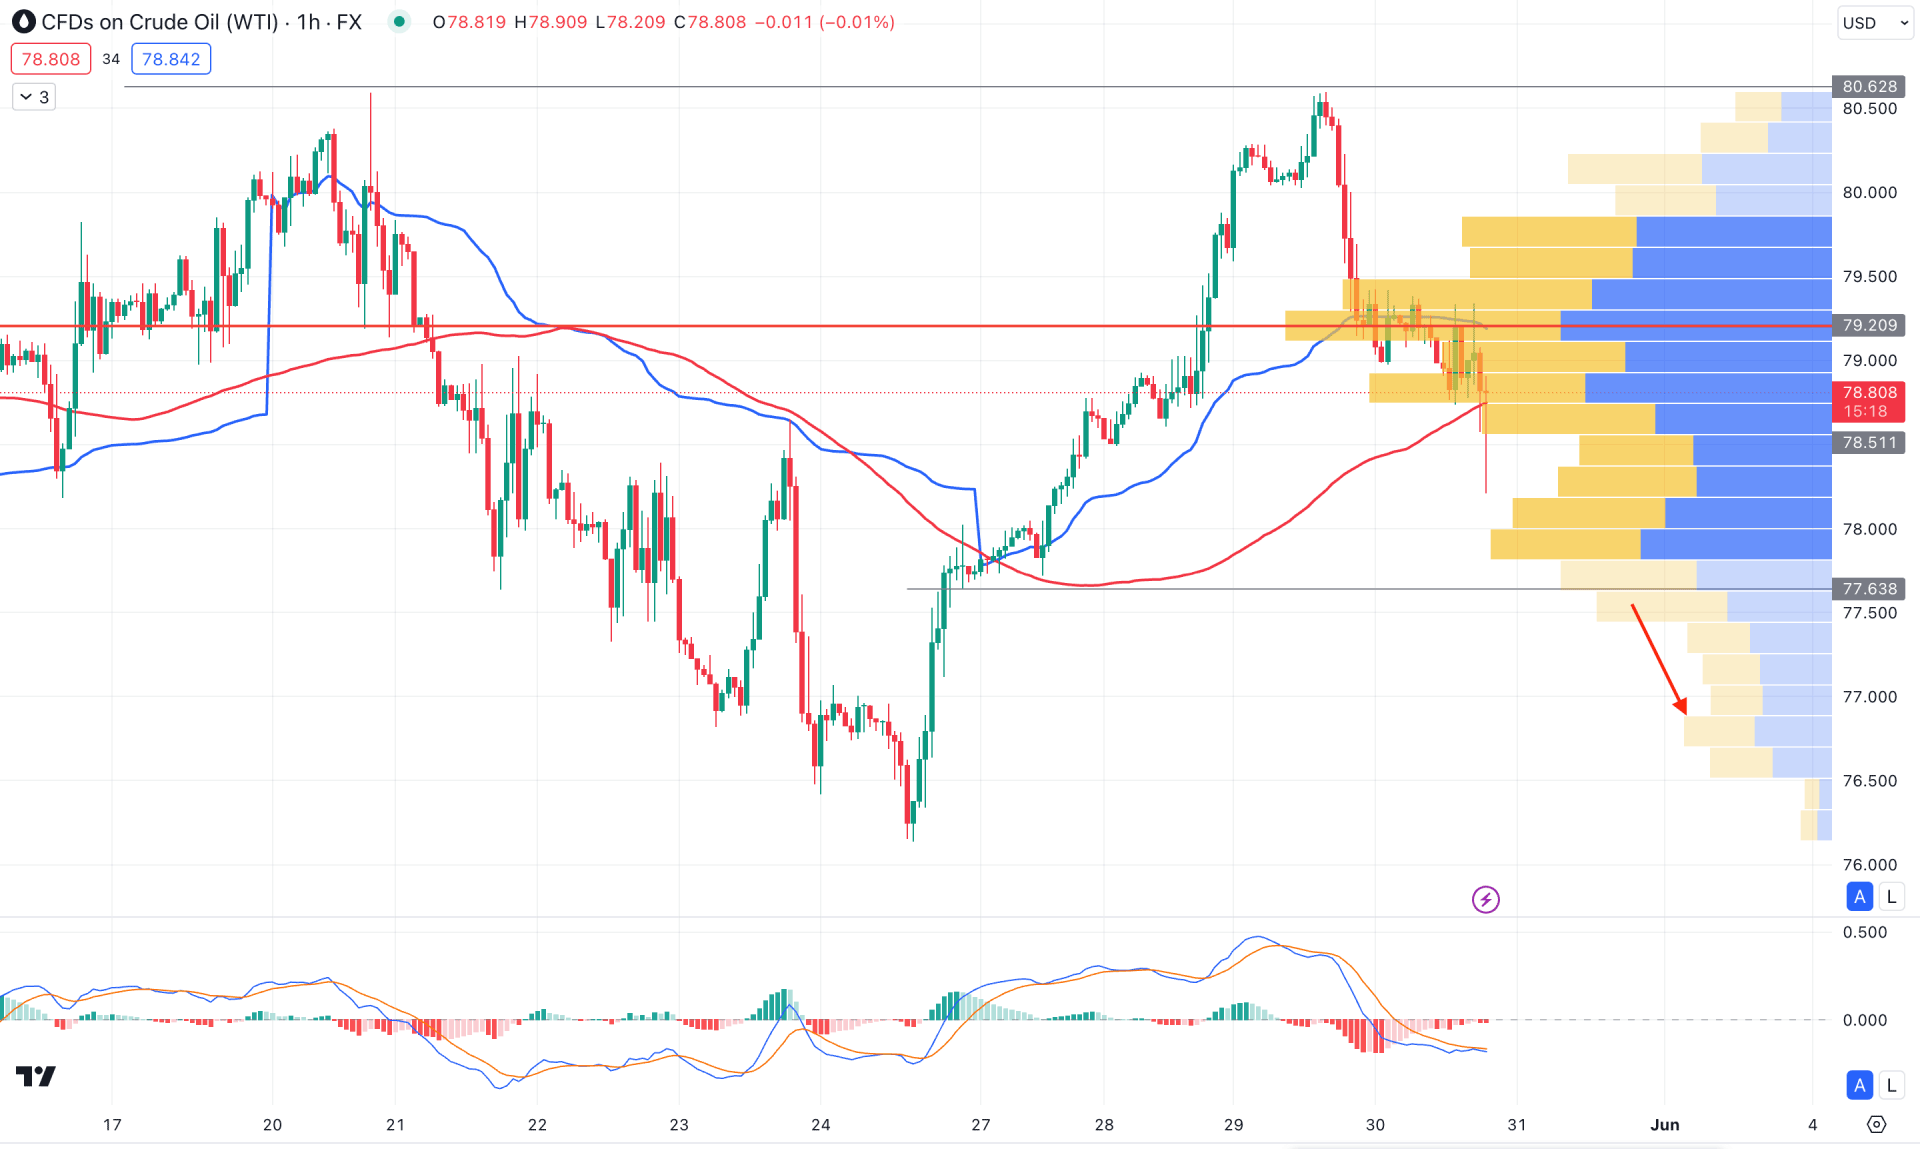
In the hourly time frame, the ongoing market momentum is corrective, which could extend lower as the visible range high volume line is above the current price. Moreover, the 100-hour SMA is acting as resistance, where the current price hovers sideways below this line.
In the indicator window, the MACD Histogram reached the neutral point after creating a selling pressure, which suggests a potential buyers activity in the market. However, no divergence is seen in the Signal line, which suggests that more clues are needed before anticipating a buy signal.
Based on the hourly price action, a bullish H1 candle above the 79.00 high volume line could be a highly probable long signal, targeting the 80.62 high. However, a downside continuation from the current market price is highly possible in case the high volume line fails.
Based on the current market structure, WTI Crude Oil is more likely to extend the buying pressure in the coming days. The daily double-top high could be a challenging factor for bulls before aiming for the near-term demand zone.