
Published: June 9th, 2026
Worldcoin active addresses increased to 1,309, and fresh wallet creation reached 379, which was also the biggest network-growth statistic of the year.
The fact that the movement was not limited to a single participant type made its scope noteworthy. When whale transactions, active addresses, and the creation of new wallets all increase together, it typically indicates that both big investors and lesser traders are becoming more involved in a project.
There was also a more tangible short-term stimulus at work. Oku Trade's incorporation into the World App increased trading volume by 266% to $768 million. The function created new transactional needs within the ecosystem by offering weekly awards of up to 100 WLD to users who participated in token exchanges through a leaderboard system.
Investor attention is being piqued by a structural shift in $WLD tokenomics that goes beyond the current price action. Worldcoin will drop its daily token unlock rate by 43% starting on July 24, 2026, with a 50% reduction in community token unlocks, and a 32% reduction in team and investor token unlocks. On that day, the daily total of new WLD tokens going into circulation will decrease from 5.1 million to about 2.9 million.
Let's see the further outlook from the WLD/USDT technical analysis:
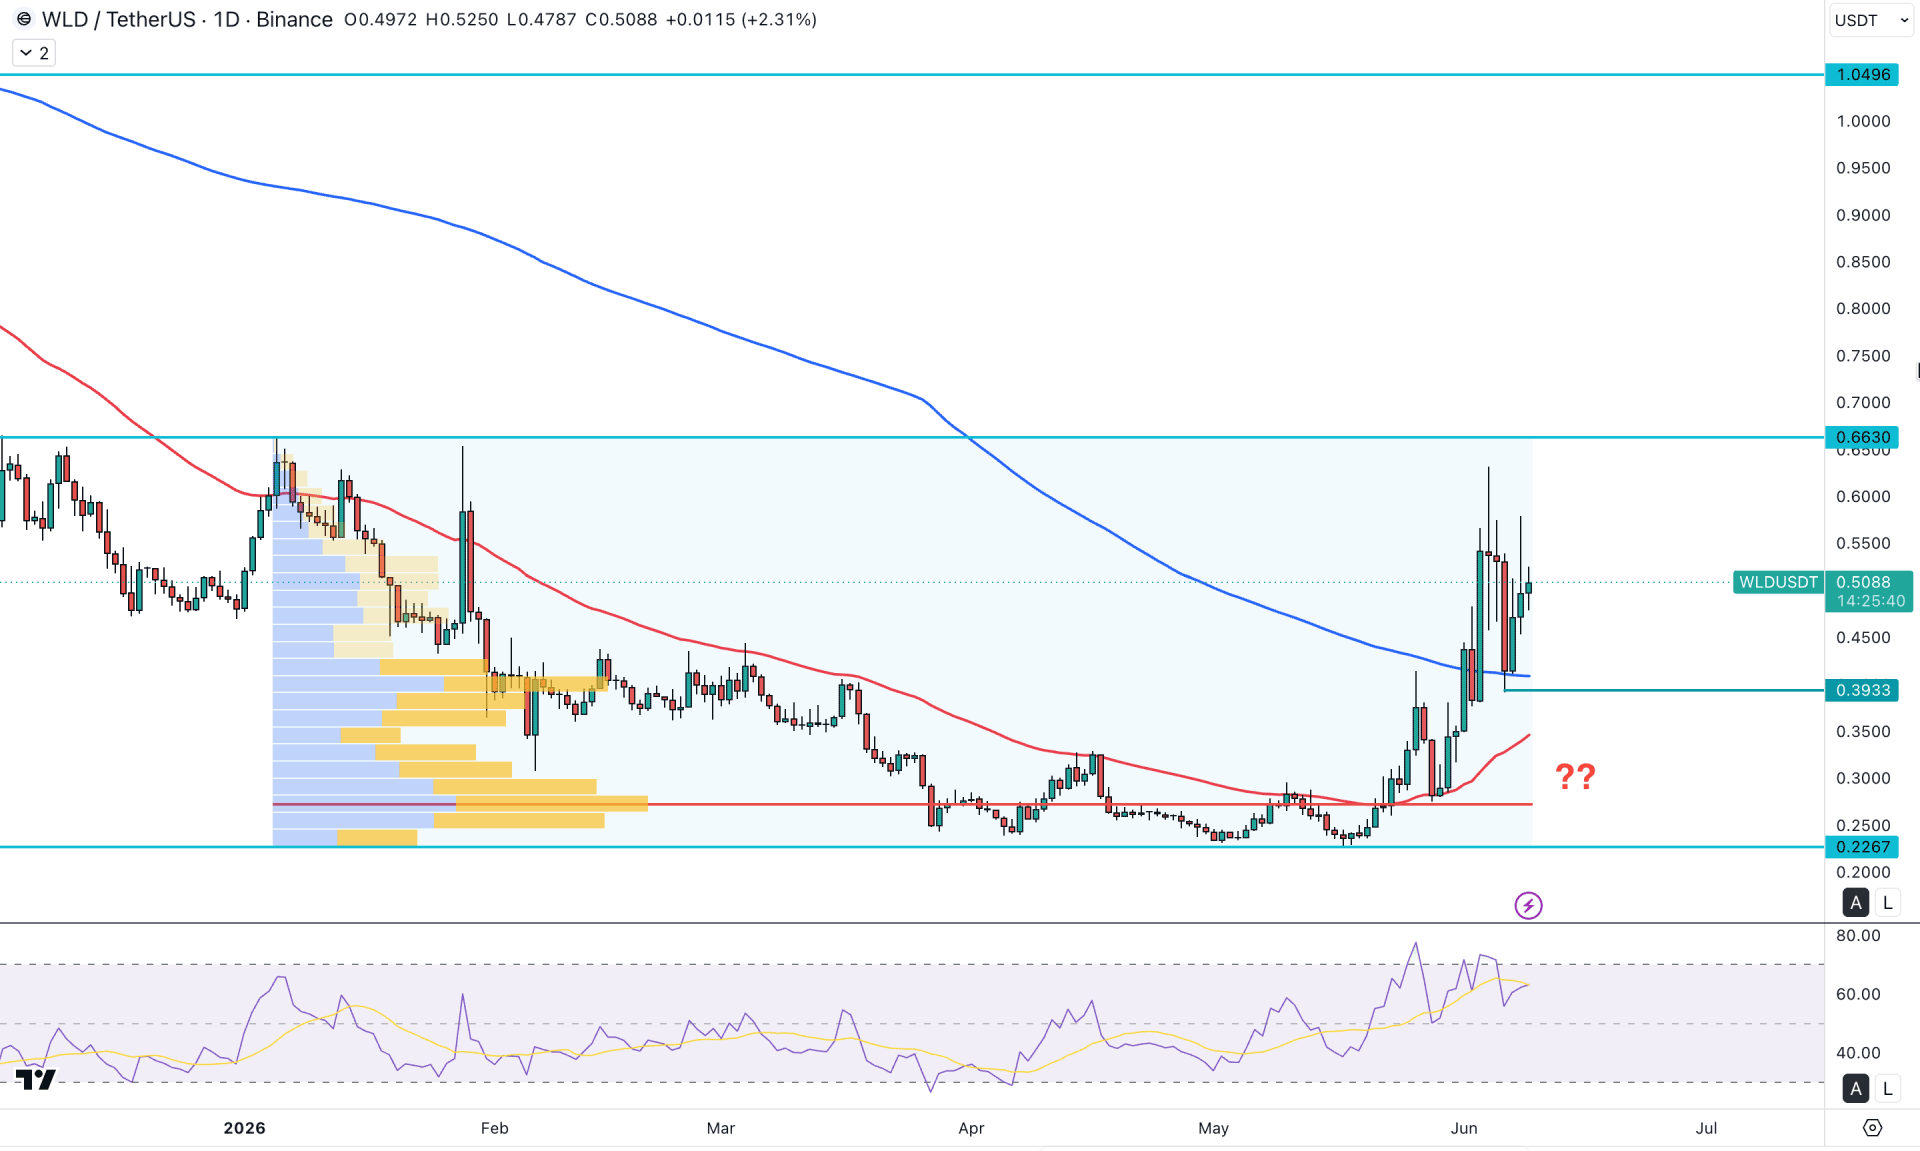
In the daily chart of WLD/USDT, the recent price shows a massive bullish recovery from the historic low, creating a long-term upward continuation opportunity. However, a potential pump and dump could form, creating a challenge to buyers. In that case, closer attention to the price action could provide a decent investment opportunity in this instrument.
In terms of the higher timeframe, the price reached the historic low after creating a top in 2024. As per the monthly candle, a bullish continuation is visible from an engulfing pattern, where the current price is trading above the crucial May 2026 high. As long as the price holds buying pressure above the existing monthly high, the primary anticipation would be to look at long trades. Also, the most recent buying pressure has come after a long-term bearish trend, from which a potential bullish recovery is highly possible. The weekly trend continues pushing higher with consecutive positive candlesticks, which is another sign of buying pressure from the bottom.
Looking at the volume structure, the ongoing buying pressure is above the high volume line, which is at the 0.2723 level. As the price is trending by creating multiple higher highs, the potential bullish continuation signal is intact.
In the daily price action, three consecutive higher highs are seen after testing the 0.2267 bottom, which is a proper validation of a bullish rebound. Moreover, the price moved higher above the 200 SMA, which is a significant achievement for buyers.
Currently, the 200-day SMA and 50-day EMA are below the current price and have an upward slope, which signals a strong bullish opportunity.
In terms of the oscillator, the RSI remains above the 50.00 neutral point, where the current ADX line is above the 40.00 level.
Based on the overall market structure, investors should closely monitor how the price trades above the 0.3933 crucial support level. As long as this support line holds, the buying pressure has a higher possibility to overcome the 0.6000 psychological line and test the 0.6630 key resistance level.
On the other hand, a deeper discount is also possible, where a valid false break from the 0.3933 support level with a rebound above the 50-day EMA could offer another long opportunity targeting the 0.8000 level.
The alternative trading approach is to find a failure to overcome the 0.6000 psychological line and form a bearish daily candlestick with exhaustion. In that case, a bearish recovery below the 200-day SMA could increase the possibility of testing the 0.2267 key support level.
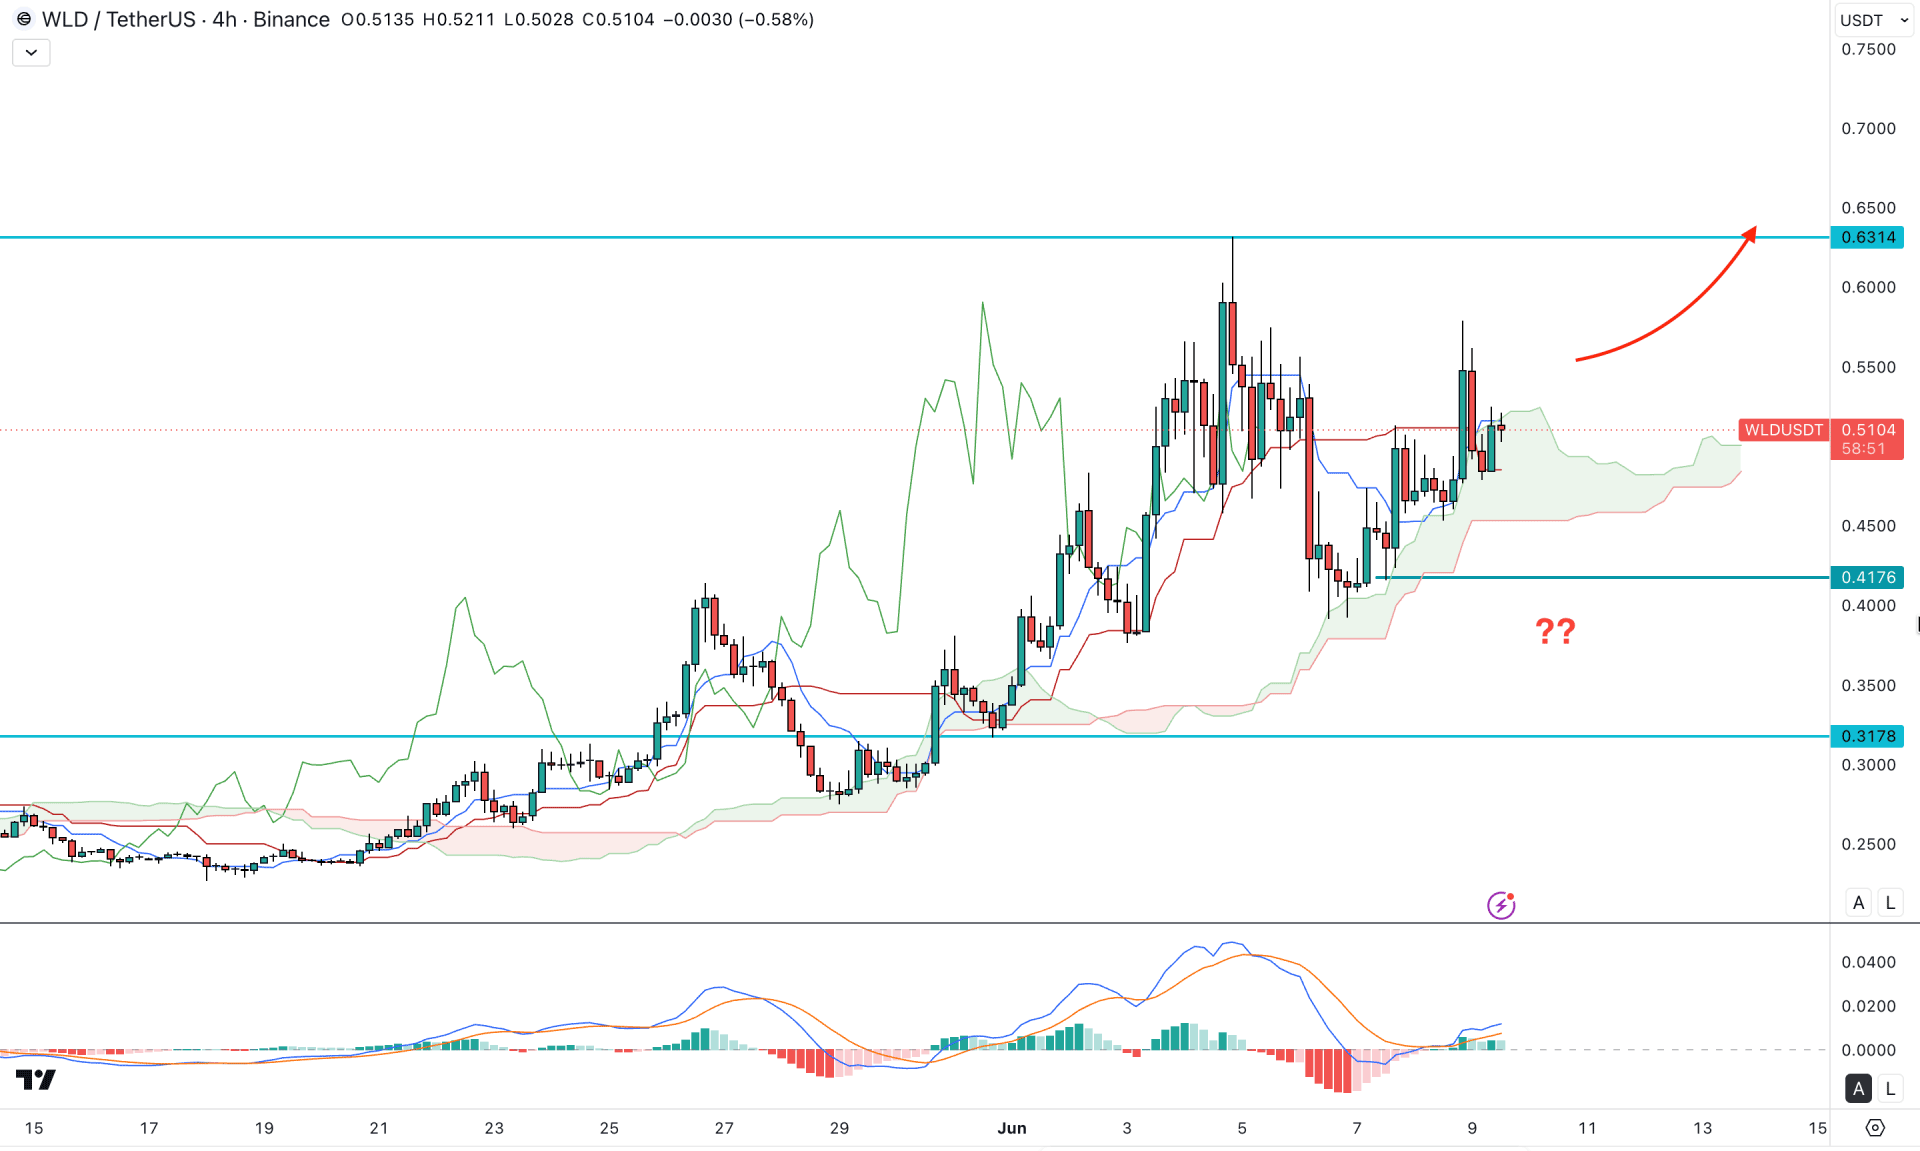
In the H4 timeframe, WLD/USDT is trading within a bullish pressure wave. The recent price shows an extended downside correction with a bullish recovery from the cloud support. As the ongoing price action is closer to the Kumo Cloud with a bullish reversal candlestick, it is a sign of trend continuation.
In the indicator window, the MACD histogram has rebounded from bearish to bullish, and the current line is closer to the neutral point. Moreover, a valid bullish recovery is seen in the signal lines for both EMAs in the positive area.
Based on this outlook, the price has a higher possibility of extending the buying pressure and testing the 0.6316 resistance level. However, a minor downside correction could appear, where the limit to the buying pressure is set at the 0.4176 level. Below this line, an extended down correction is possible, targeting the 0.3000 psychological level.
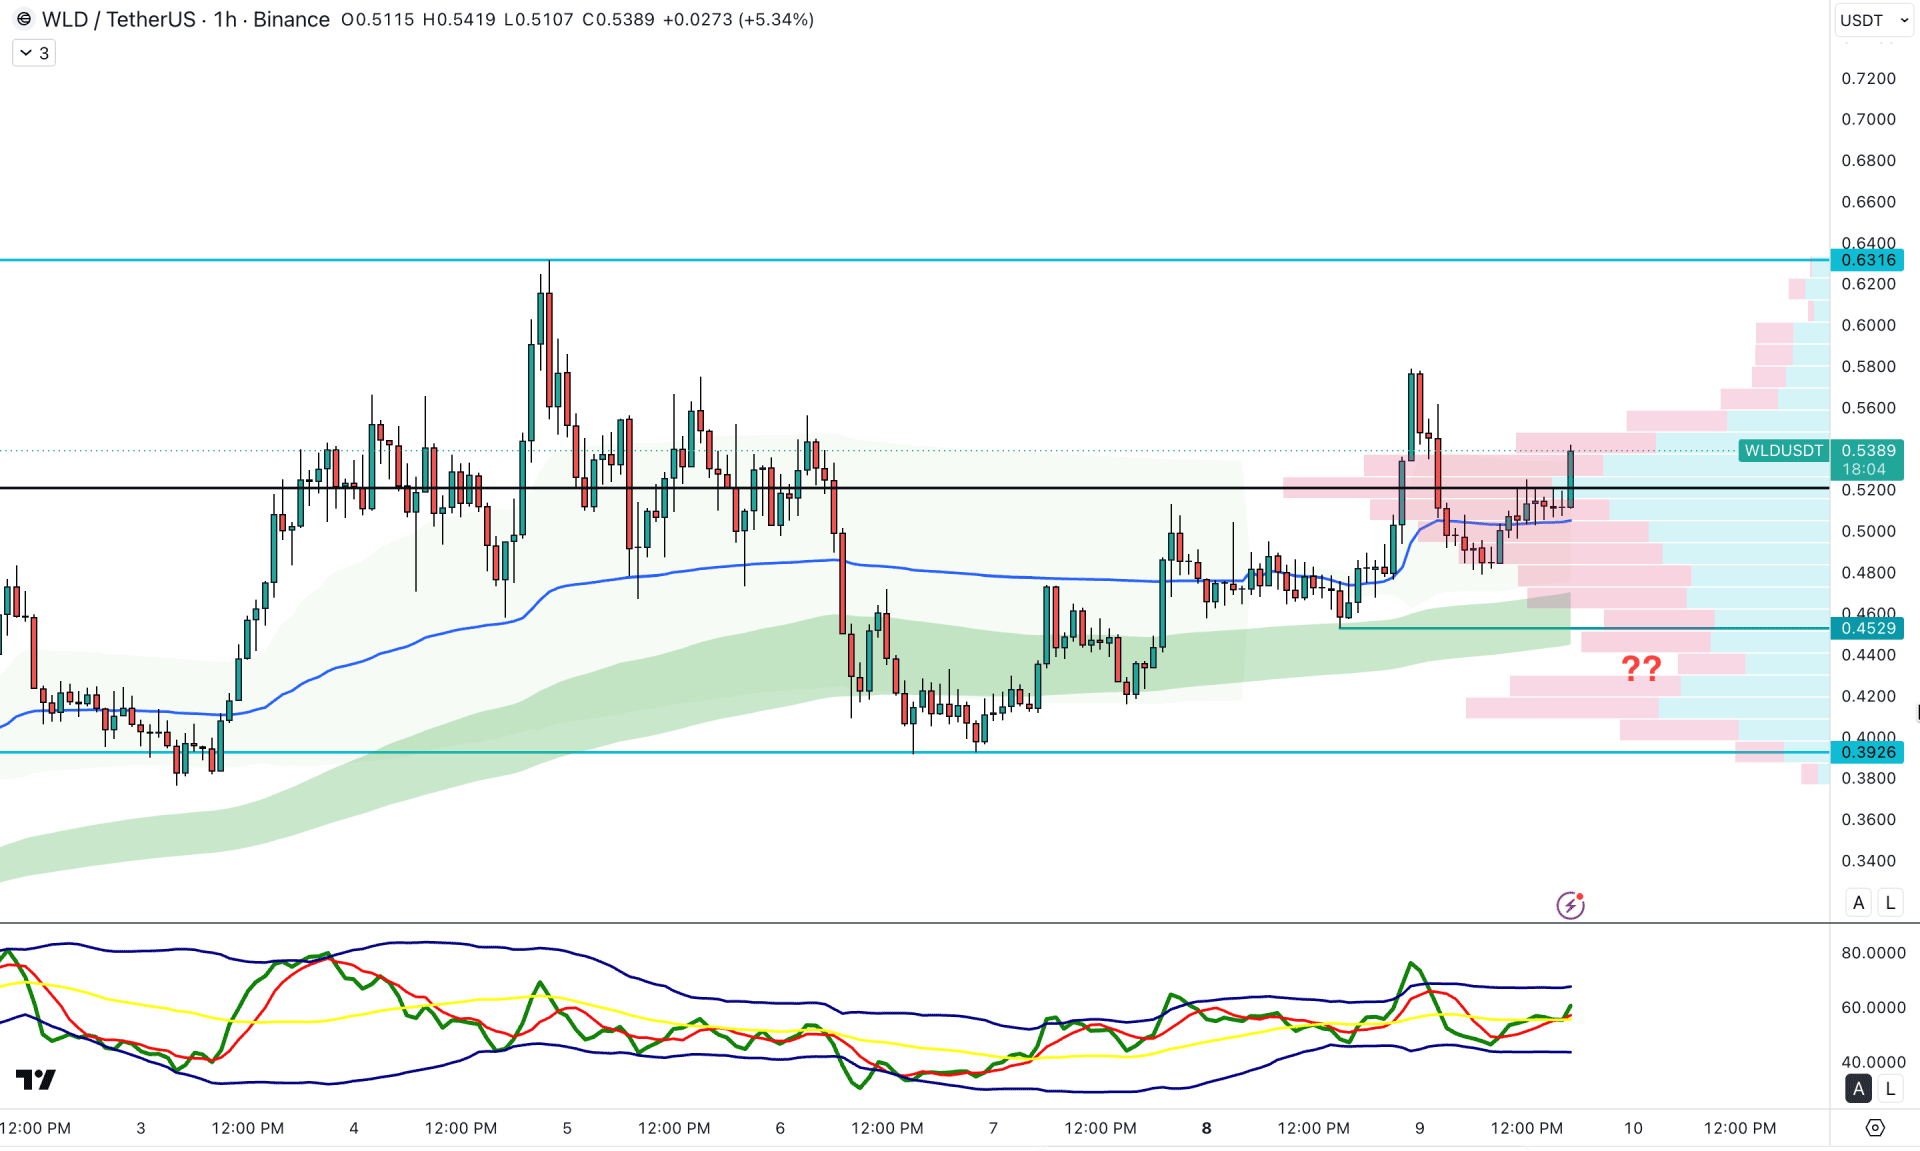
In the hourly timeframe, the current price is trading within a bullish trend, as the price keeps rising, supported by a trendline. Moreover, the high volume line is just below the current price, followed by a range breakout, which signals valid buying pressure.
In the main price chart, the weekly VWAP line is below the current price with a bullish slope, supported by a rising EMA wave. The Traders Dynamic Index shows a similar story, where the current line is heading upward above the 50.00 neutral level.
Based on the overall hourly market structure, WLD/USDT is trading within a bullish wave and is likely to rise above the existing swing high of the 0.5776 level. The first resistance level to look at is the 0.6316 level before heading towards the 0.7000 level.
On the other hand, a trendline support is present at the current price area, where the immediate static support is at 0.4529. Below this level, the next support level to look at is the 0.3926 level.
Overall, WLD/USDT is trading at a deeper discounted price area, from where a rebound is highly possible. The higher timeframe and price action already show a buyer presence in the market. From here, any dip in the intraday price action with a downside liquidity grab could be a long opportunity.


