
Published: November 25th, 2025
World Liberty Financial (WLFI) experienced an upgrade in response to a pre-launch security problem that impacted a limited number of user wallets. The company affirmed that there was no vulnerability in WLFI's platform or smart contracts, but rather that attackers gained access to these accounts
Following the discovery of the problem, WLFI froze affected wallets, confirmed ownership, and started creating new on-chain algorithms to securely return user funds.
Simultaneously, engineers created and evaluated a new intelligent contract framework intended to safely manage large-scale reallocations. Although the procedure took longer than anticipated, WLFI stated that putting user protection first was more crucial than rushing the solution.
Let's see the upcoming price action for this coin from the WLFI/USDT technical analysis:
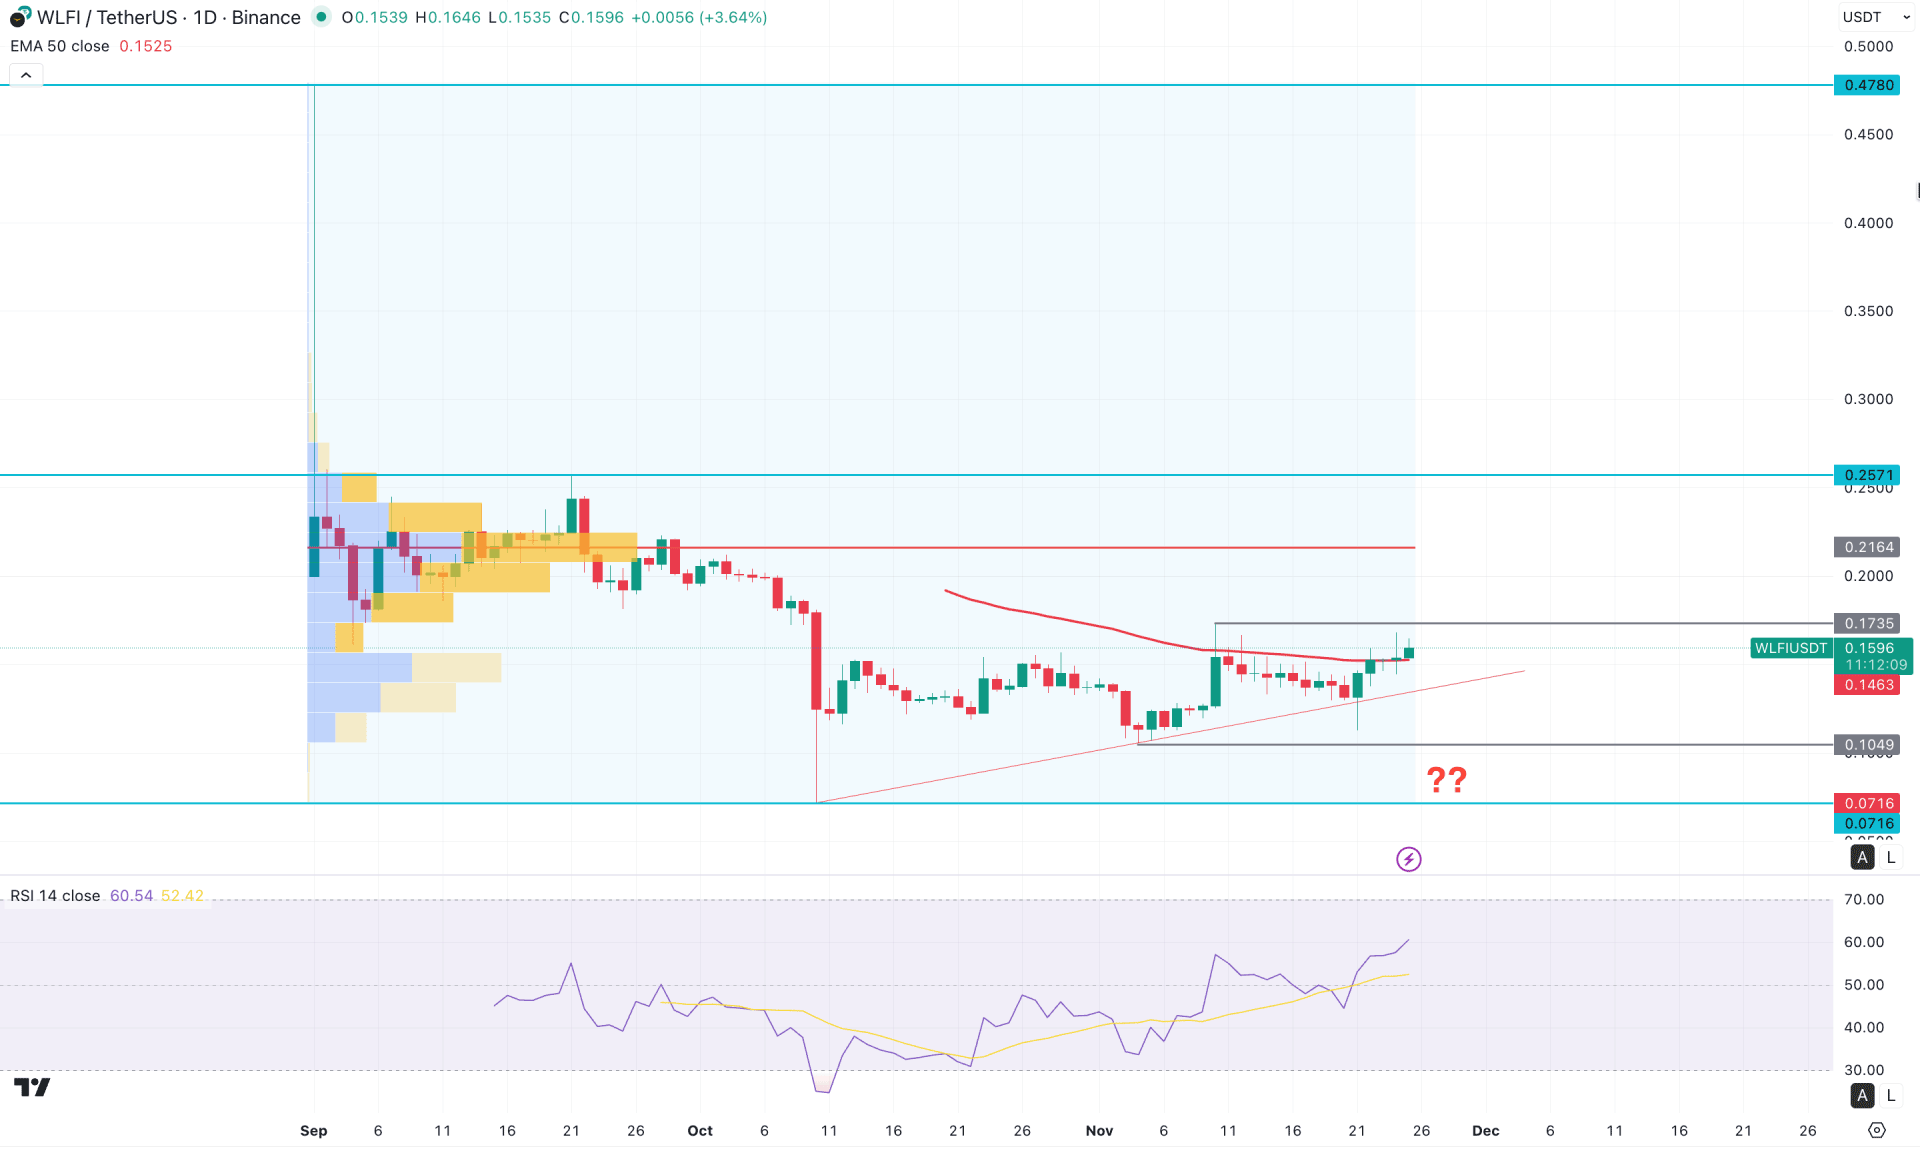
In the daily chart of WLFI/USDT, the recent price shows a bullish recovery after exhausting lower at the 0.0716 level. Moreover, a rising trendline supports the buying pressure, and a strong liquidity sweep appeared on 21 November 2025. As long as the rising trendline supports the bullish momentum, investors may expect an upward continuation soon.
In the weekly timeframe, the bullish structure remains intact as the current price is hovering around the six-week high, followed by a bullish engulfing breakout. Since no significant selling pressure is visible at the 0.1566 weekly high, investors might anticipate further upside.
Even though the higher-timeframe price action shows no selling pressure at the top, a large amount of investor activity is present around the 0.2164 level. In this case, investors should closely monitor how the price reacts after reaching the 0.2164 high-volume line.
In the main chart, a bullish breakout is visible above the 50-day Exponential Moving Average, supported by a rising static trendline. As long as the price remains above this trendline support, the bullish continuation scenario remains valid.
In the secondary indicators, the Relative Strength Index (RSI) rebounded higher and moved above the 50.00 neutral line, signalling a shift toward bullish momentum with the potential to test the 70.00 overbought level. Moreover, a constructive market tone is visible from the Average Directional Index (ADX), which is currently at 16.82 with a flat structure.
Based on the overall market outlook, WLFI/USDT has a high probability of facing resistance at the 0.1735 swing high. However, a breakout above this level could pave the way for a move toward the 0.2164 high-volume line before extending further toward the 0.2571 resistance level.
On the other hand, failure to break above the 0.1735 level with an immediate drop below the 50-day EMA could extend the downside correction toward the 0.1049 support level.
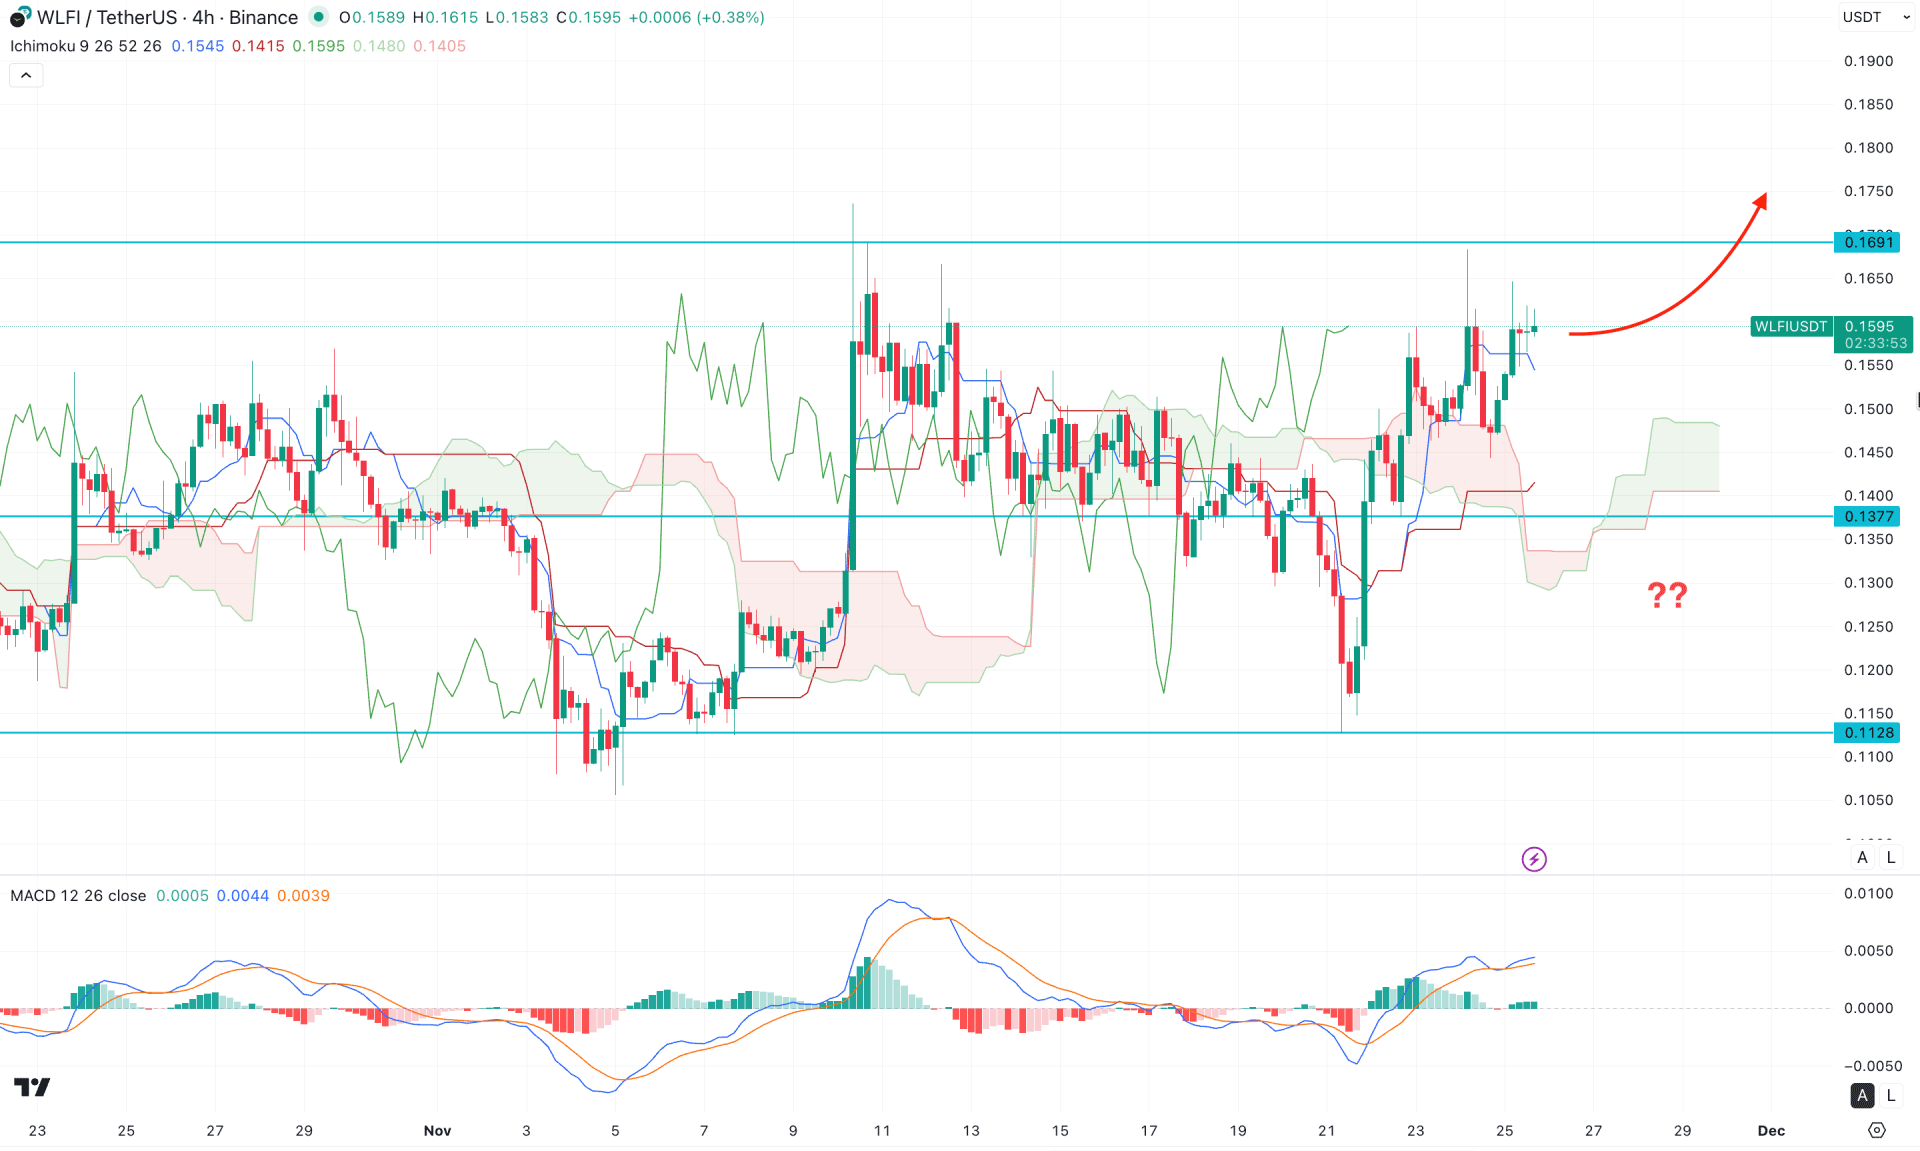
In the H4 chart of WLFI/USDT, a strong bullish reversal is visible, taking the price above the cloud area with a counter-impulsive momentum. As the current price is hovering above the cloud with a consolidation, investors may expect further upward pressure soon.
In the future cloud, both lines are sloping upward, although a flat structure is present, suggesting corrective pressure. However, the dynamic cloud region is still below the current price, indicating a bullish flow.
In the secondary indicator window, ongoing buying pressure is evident from the MACD histogram, which has remained above the neutral line for a considerable period. Moreover, the signal line has failed to form a bearish crossover and continues to stay above the neutral level.
Based on the current market structure, a bullish continuation is likely as long as the price remains above the cloud support. A strong static support is located at the 0.1377 level, which could validate the continuation of the bullish momentum.
On the other hand, a break below 0.1377 with a bearish H4 candle could send the price toward the liquidity zone, potentially testing the 0.1128 support level.
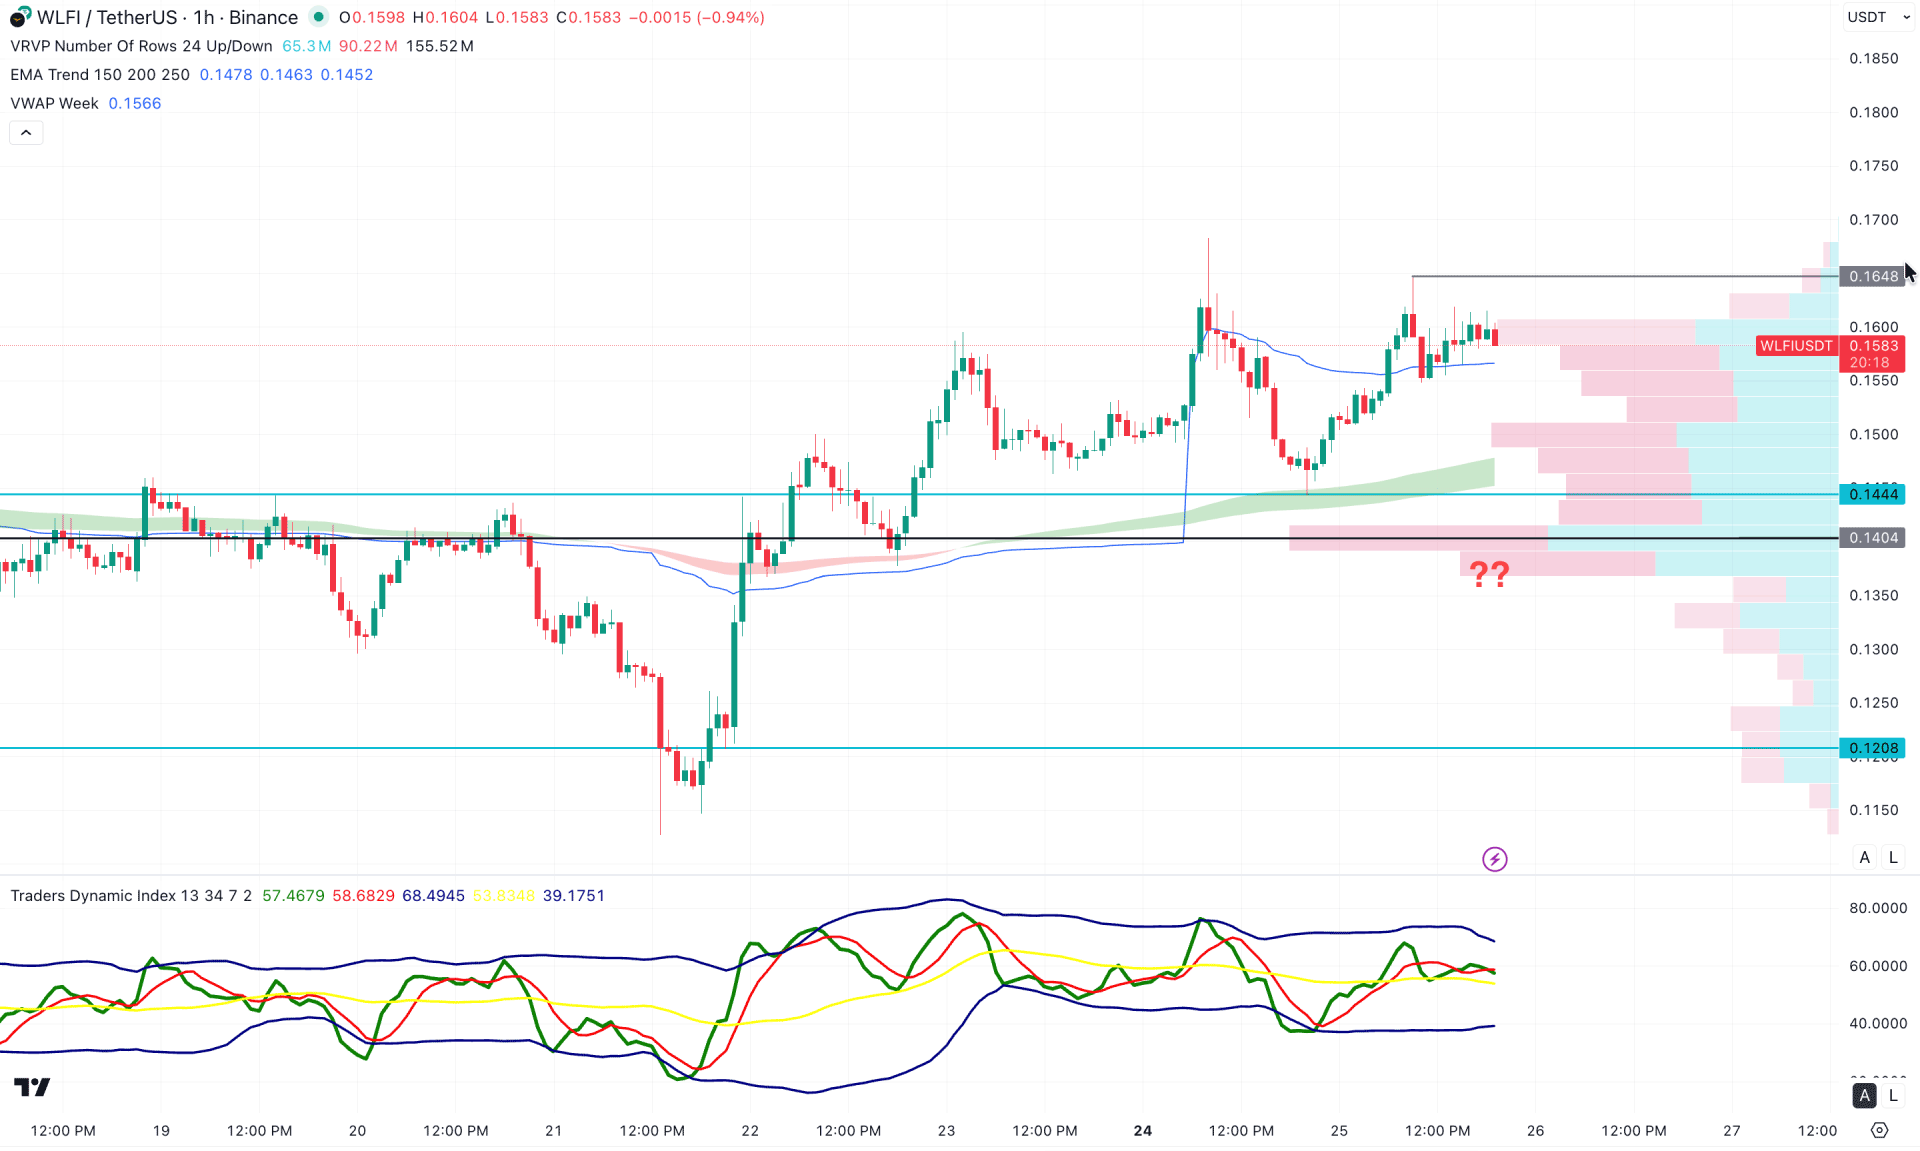
In the hourly timeframe, a corrective bullish trend is visible as the recent price is trading higher toward the intraday high. However, the weekly VWAP and the moving average wave remain below the current price, supporting the ongoing bullish momentum.
On the other hand, the gap between the high-volume line and the current price has widened, suggesting a potential bearish recovery as a mean reversion.
In the secondary indicator window, the Traders Dynamic Index (TDI) is hovering above the 50.00 line, indicating a clear bullish momentum.
Based on this outlook, a bearish correction is pending, and the price is likely to find support from the EMA wave. In that case, any bullish reversal from the 0.1500 – to 0.1404 area could offer a potential long opportunity, with the ultimate target being a retest of 0.1800.
On the other hand, if immediate buying pressure fails to keep the price above the 0.1648 high, the bearish probability may increase. A deeper reversal would require a stable price below the 0.1400 level to aim for the 0.1208 support zone.
Based on the broader market structure, WLFI/USDT is more likely to extend the corrective momentum, where further clues are needed before anticipating a bullish breakout. As the intraday price is trading at the top, sufficient selling pressure could come before offering a long approach.


