
Published: November 17th, 2020
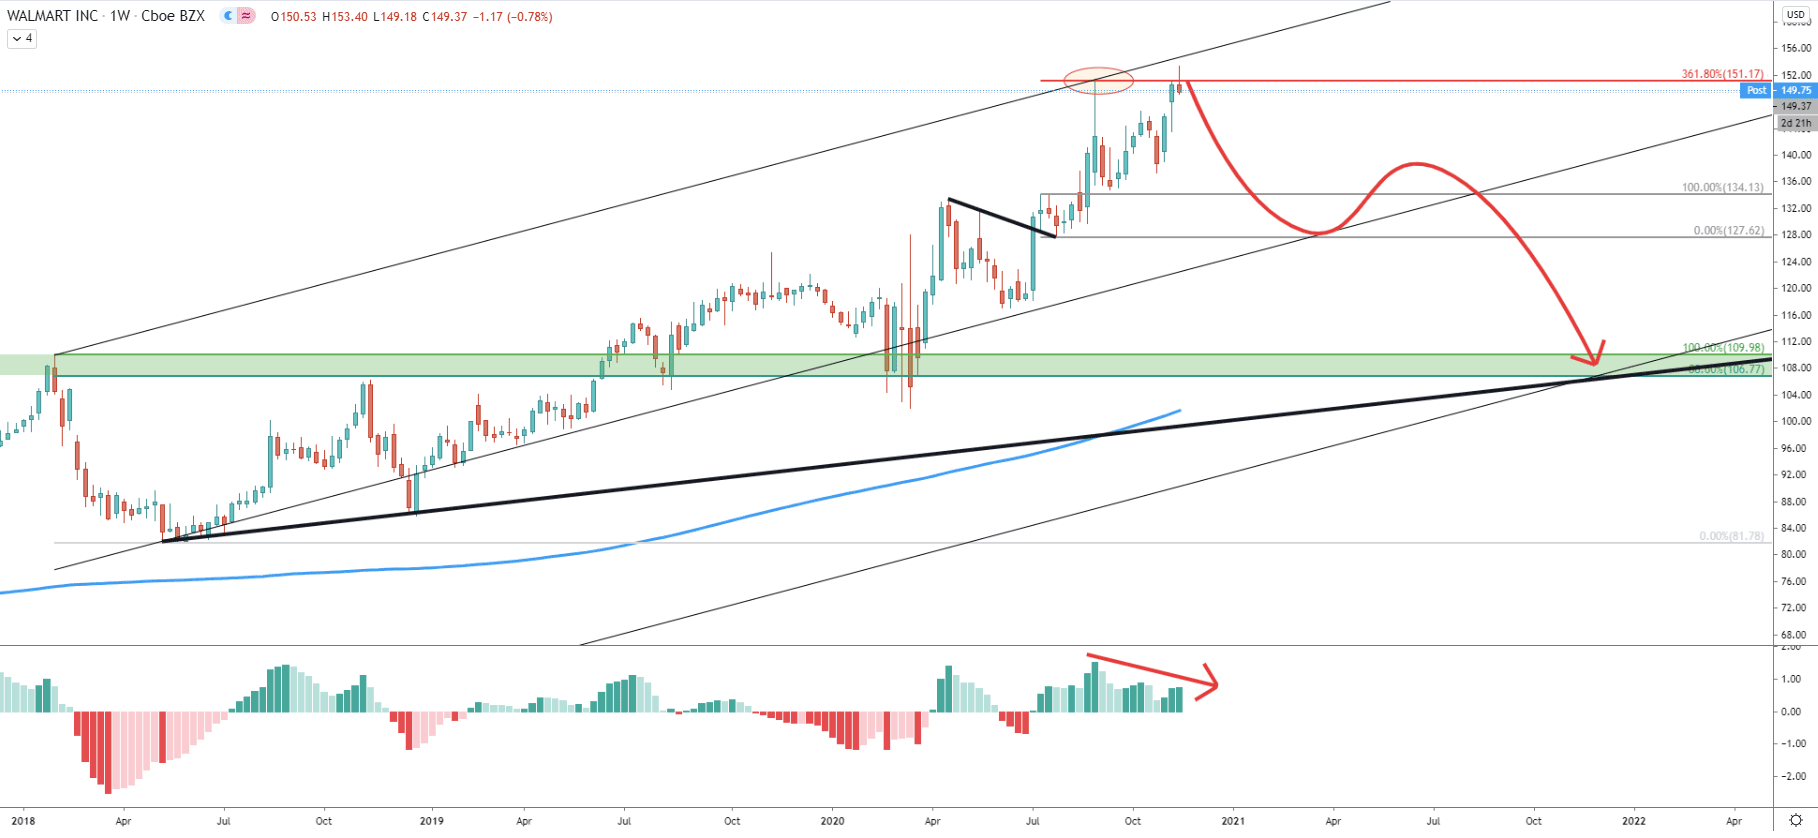
Walmart stock remained heavily bullish as the price continued to produce higher highs and higher lows up until September. On September 2, the price has reached and cleanly rejected the 361.8% Fibonacci resistance level at $151.17, as can be seen on the chart. This week Walmart is attempting to break above this resistance, but there is a strong probability that the weekly close will remain below. This is because the MACD oscillator is already forming a bearish divergence, suggesting an increased selling pressure in the long term.
Therefore, if this weeks’ closing price will manage to stay below $151.17, Walmart might initiate a strong downside correction and even a long-term trend reversal. Based on the previously established supply/demand zone, the price might drop down to the $106.77 area, which is also confirmed by the 88.6% Fibonacci retracement level. This support also corresponds to the lower trendline of the extended descending channel, suggesting the price drop will end only at the end of 2020.
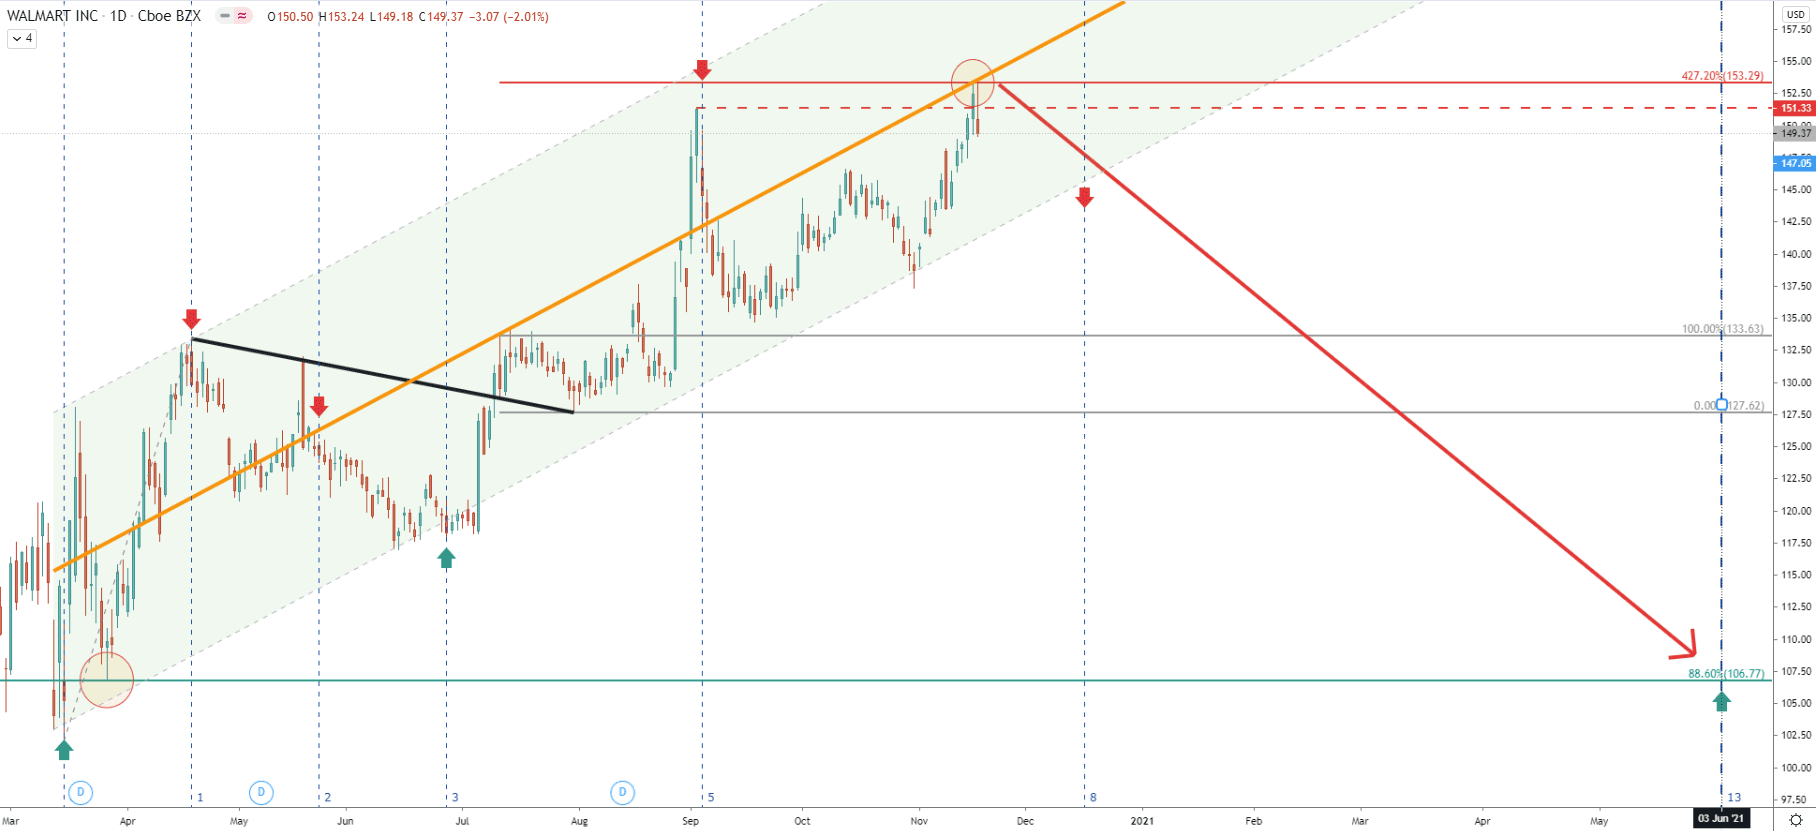
Today Walmart has printed a high at $153.29, where it cleanly rejected the middle trendline of the ascending channel. Fibonacci, applied to the corrective move down after price broke above the downtrend trendline, shows that 427.2% Fibs has been rejected along with the trendline.
This makes 153.29 potentially a key resistance level to watch during the next 30 days. Because based on the Fibonacci cycles, in 30 days new cycle should start. If by this time Walmart will remain below the $153.29, and most importantly if it will be able to break below the ascending channel, the beginning of the downtrend should be expected. Based on the following Fib cycle, the price can go through an extremely fast decline and could be reached the $106.7 support as soon as mid-2021. To be precise, it is June 3.
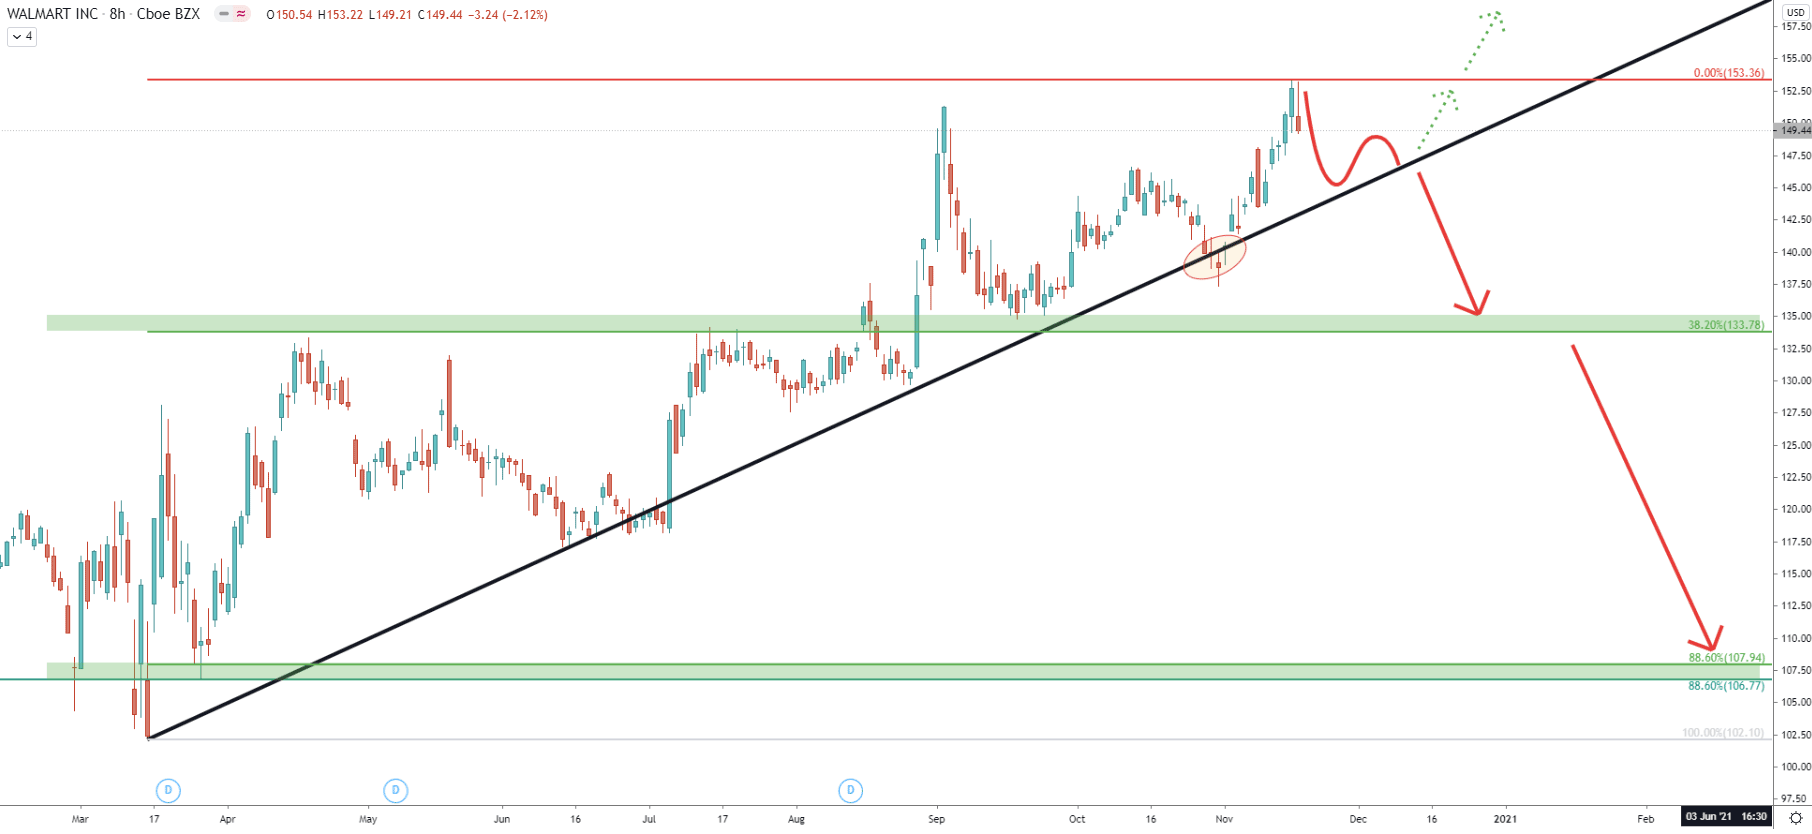
On the 8-chart the expected price action scenario is presented. Obviously, it will remain valid if Walmart will remain below the $153.36, specifically, daily close must stay below. At the same time, it can be seen that the uptrend trendline has been rejected and currently price might be forming a triangle pattern prior to the next big move. Therefore, if the trendline will get rejected there is a possibility that after that uptrend will continue. Overall, it is extremely important for the price to break below the trendline in order to confirm bearish sentiment.
If/when the price will break below, a 50% decline might follow. The nearest support is located at $133.78, which is confirmed by 38.2% Fibs as well as the previous supply/demand zone. The final downside target on this chart is now confirmed by two Fibs, both of which are 88.6% retracement level.
Yesterday, the average-price uptrend trendline has been rejected, along with the Fibonacci retracement level as per the daily chart. And here we can spot yet another support level, which is located at $138.75 and confirmed by two Fibs, 78.6%, and 23.6%. At the same time, this support corresponds to the uptrend trendline as well as the 200 Exponential Moving Average.
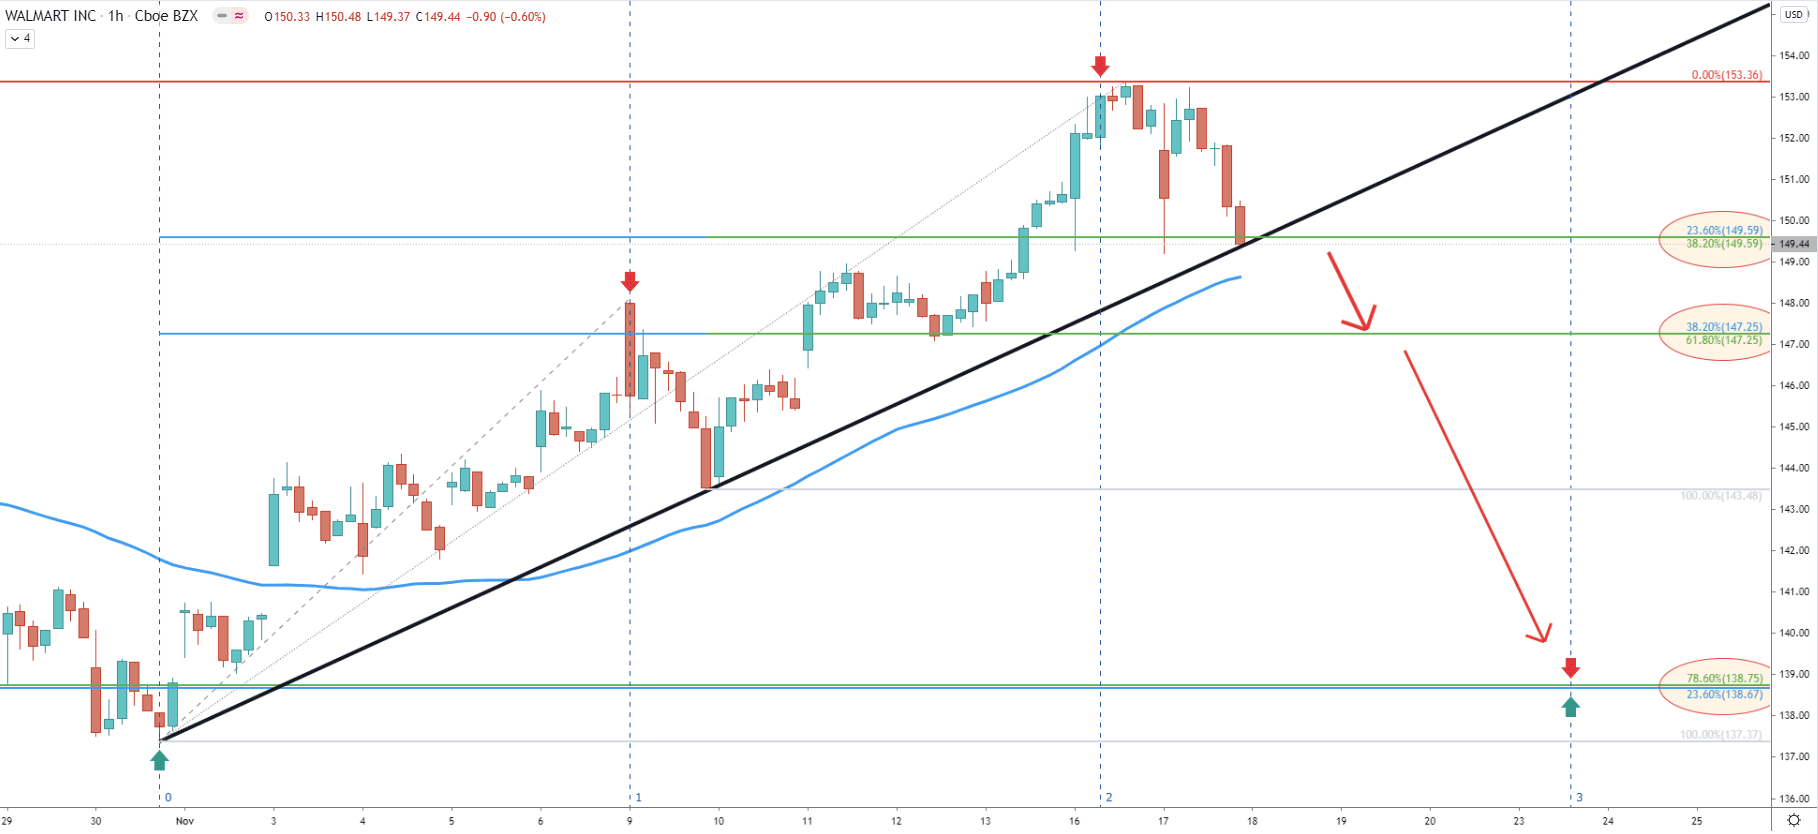
Currently, on the 1h timeframe, Walmart is facing the support which is confirmed by two Fibonacci levels, uptrend trendline, and 200 EMA. Perhaps this is the nearest and the key support, which must be broken in order for the sellers to step it. Although after that, $147.25 support must also be broken, before/if a strong downtrend will get completely confirmed.
Walmart could have reached the top of the long-term uptrend, as price cleanly rejected multiple resistance indicators. As a result, the price might drop by a huge 50% in the next 12 months.
As per the weekly and 4-hour chart, there are two key support levels to watch. The first is $138.75 and the second is 106.77. Both of them are confirmed by two Fibonacci retracement levels.
A weekly close above 151.17 as well as a daily close above 153.36, will immediately invalidate expected downside correction and the long-term uptrend, in this case, is likely to continue.
Support: 149.59, 147.25, 138.75, 133.78, 106.77
Resistance: 151.17, 153.36


