
Published: August 13th, 2025
World Coin (WLD) is currently down 12.5% in one week and 28% in a fortnight. Although the altcoin had a slight 5% rise every month, it additionally experienced a 45% decline in the last year.
These are depressing numbers, but OpenAI is expected to release its most recent LLM model, GPT-5, shortly, so things may improve for Worldcoin. Given that Sam Altman is the co-owner of World Coin and OpenAI, the release of GPT-5 may increase interest in the token.
Even though OpenAI and Worldcoin are two different companies, this is not the first time that news about OpenAI has raised the price of WLD.
The price of Worldcoin jumped from $1.89 to $2.27 in a matter of days during January of this year, following the announcement of a $500 billion AI investment push by freshly elected US President Donald Trump. In a similar vein, the coin had a 15% increase in value in April following OpenAI's announcement that it was going to be collaborating with veteran Apple developer Jonny Ive.
As a result, there's a good probability that Worldcoin will climb sharply once more as soon as ChatGPT 5 launches, which may happen any day now based on the latest tweets from Sam Altman.
Unlike several other top-100 currencies, it failed to recover significantly during the July end-of-year rally and has since dropped to its lowest points of the year.
Let's see the further outlook of this coin from the WLD/USDT technical analysis:
In Worldcoin, a pump-and-dump pattern was visible before the yearly opening, as the price created a valid bottom at the 0.571 level. Over the last four months, the price has attempted to make a new low, but each time it failed, leading to a solid bullish recovery. As the most recent price is supported by a trendline with a valid descending channel breakout, investors might expect the bullish continuation to extend.
Looking at the monthly timeframe, the price is trading at its lowest level in the last three years, while the past five months' price action shows signs of consolidation. Primarily, a consolidation at the bottom with a valid range breakout could offer a high-probability long opportunity from a discounted price. However, no solid bullish monthly candle is visible above the existing resistance at 1.40, which signals the need for more cautious movement. On the weekly chart, the price is trading within a strong bearish body, and further confirmation is needed by overcoming the 1.251 resistance level before validating the bullish possibility.
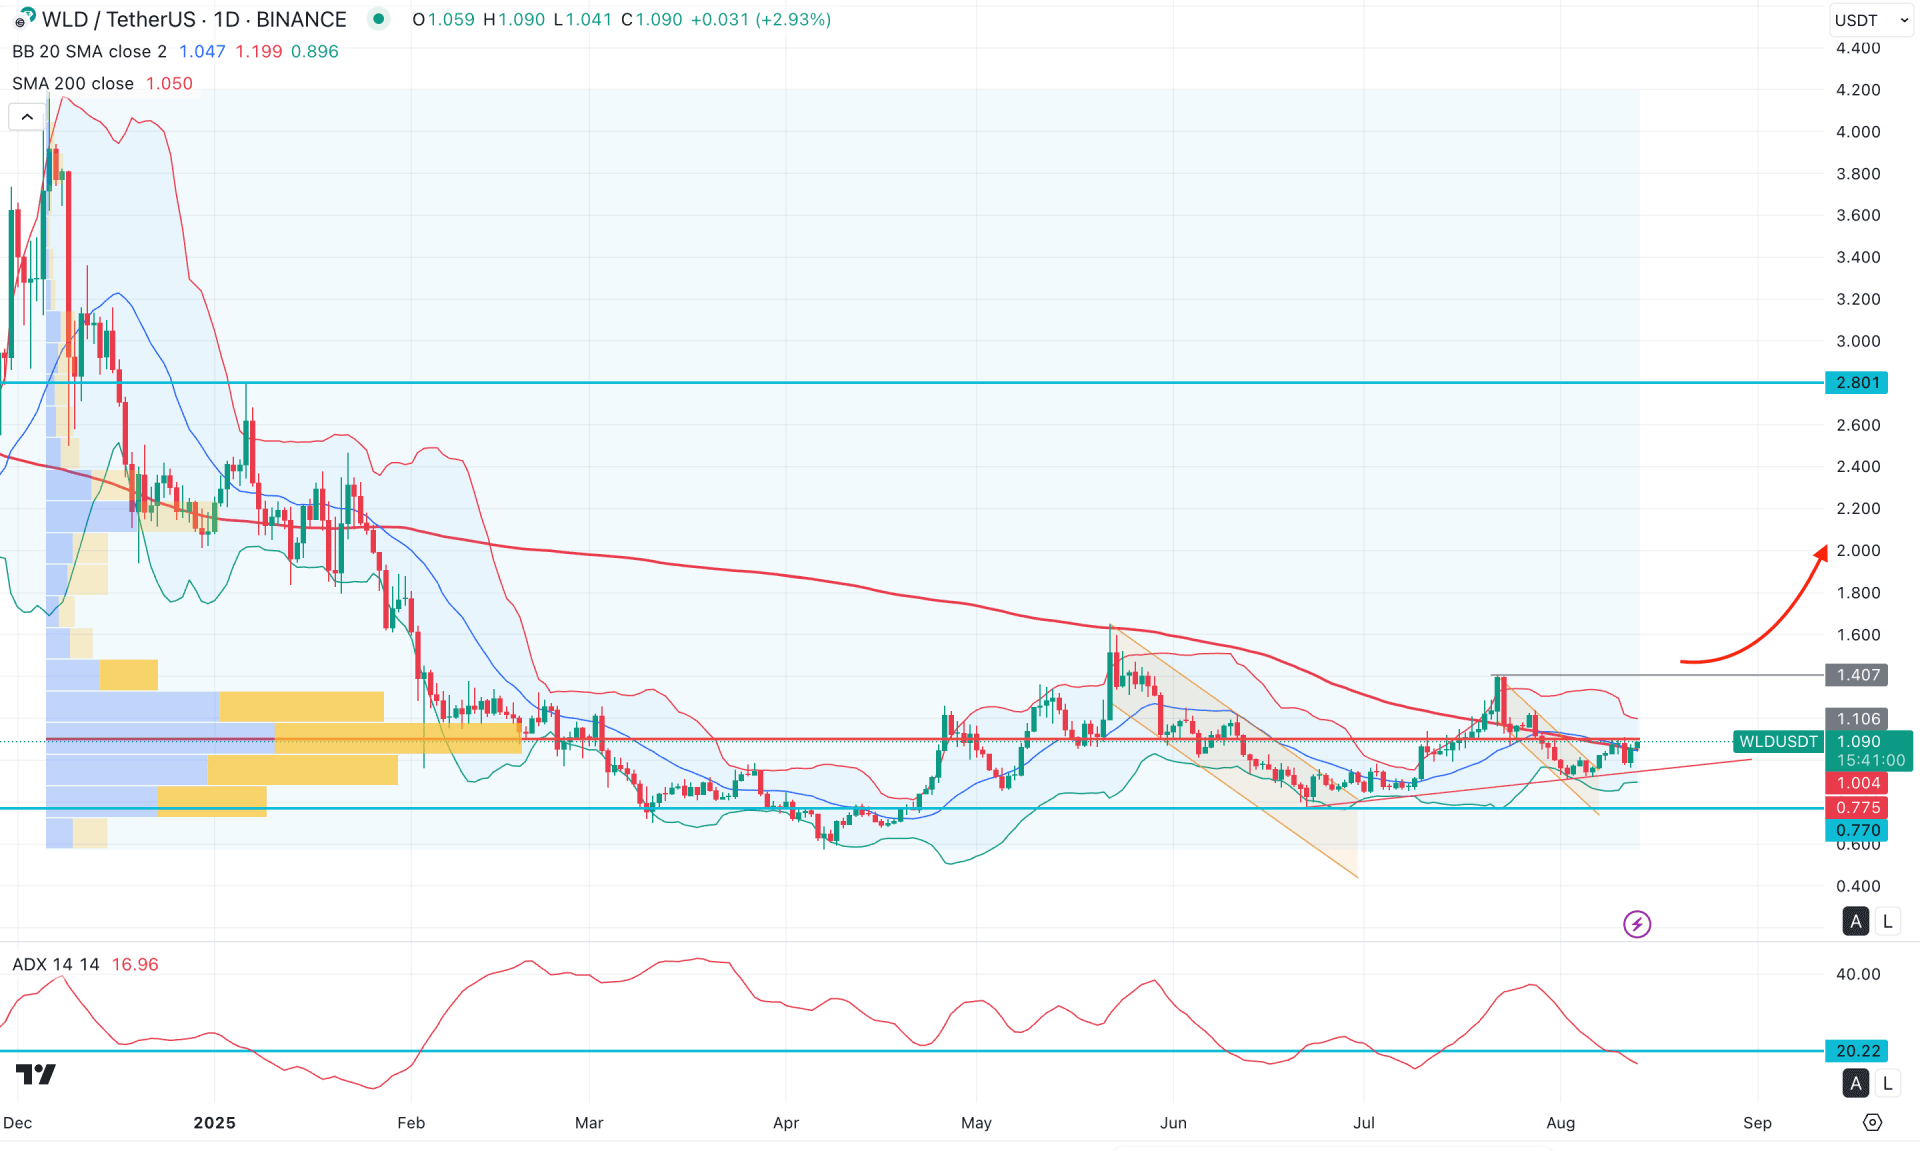
In terms of volume, the price is facing a crucial resistance at the 1.106 area. According to the high-volume line, the most active level since December 2024 has been at 1.106, which needs to be overcome with a valid daily candle close before anticipating strong bullish pressure.
On the daily chart, the price is trading in the discounted zone, as the broader price action remains below the mid-Bollinger Band level. However, after the strong bearish daily candle on 11 August 2025, the price failed to continue moving lower. Instead, it found a bullish reversal, and the most recent candle is attempting to overcome the high-volume resistance. In that case, investors should monitor how the price reacts at that level, as an early buying signal could be visible from a mid-Bollinger Band breakout.
From an indicator perspective, the Average Directional Index (ADX) is below the 20.00 threshold, signaling corrective pressure in the market trend. Moreover, the RSI has rebounded and made a bullish recovery above the 50.00 neutral line.
Based on the broader market outlook, a strong bullish continuation is possible as a rising trendline supports the current price. A bullish daily candle is also visible above the 200-period Simple Moving Average, along with the mid-Bollinger Band. In that case, a valid daily close above 1.106 could increase the bullish possibility, targeting the 1.407 level. However, the broader market is still bearish, and a bullish breakout with consolidation above the 1.407 level could invalidate the current structure and initiate a long-term rally toward the 4.00 psychological level.
On the other hand, the price is still struggling to overcome strong resistance, with dynamic levels close to the current price. In that case, an immediate reversal with a daily close below the trendline support could be an early sign of weakness for bulls. This scenario could push the price lower, potentially creating a new low below the 0.775 level.
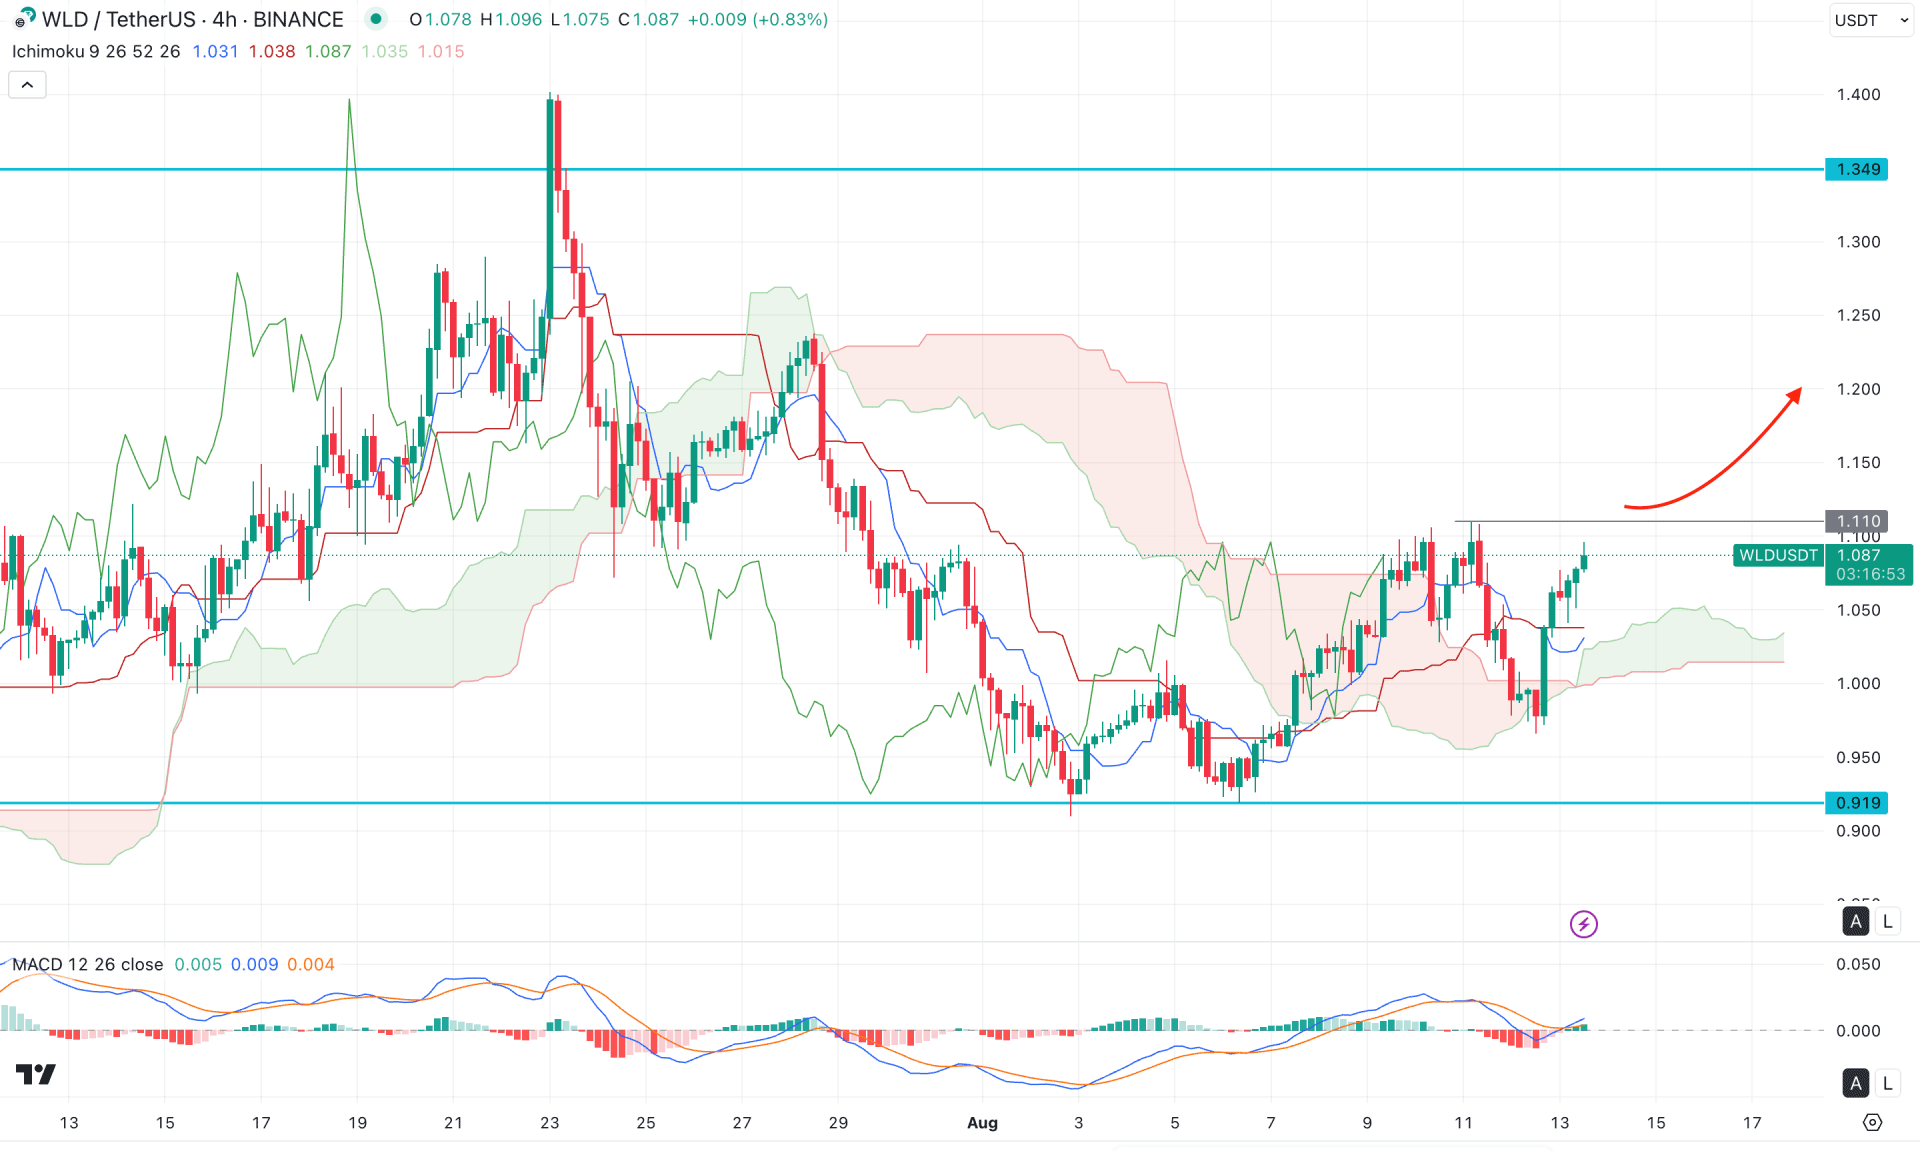
In the 4-hour timeframe, the recent price is trading within a consolidation as multiple violations are visible at the Ichimoku Kumo Cloud zone. However, a valid bullish cloud breakout is present, followed by a correction, which signals a potential bullish continuation signal.
In the secondary indicator window, the MACD Histogram has flipped the position and is hovering above the 0.0 neutral line. Moreover, the Signal line has formed a bullish crossover, suggesting a potential buying pressure.
Based on the overall outlook, the near-term resistance is visible at the 1.110, and investors should closely monitor how the price reacts at this level. A potential bullish breakout with a consolidation above this line could be a long opportunity, targeting the 1.349 level.
The alternative trading approach is to look for a short opportunity after having a bearish pressure below the cloud low. In that case, the price might extend the selling pressure and find support from the 0.900 psychological level.
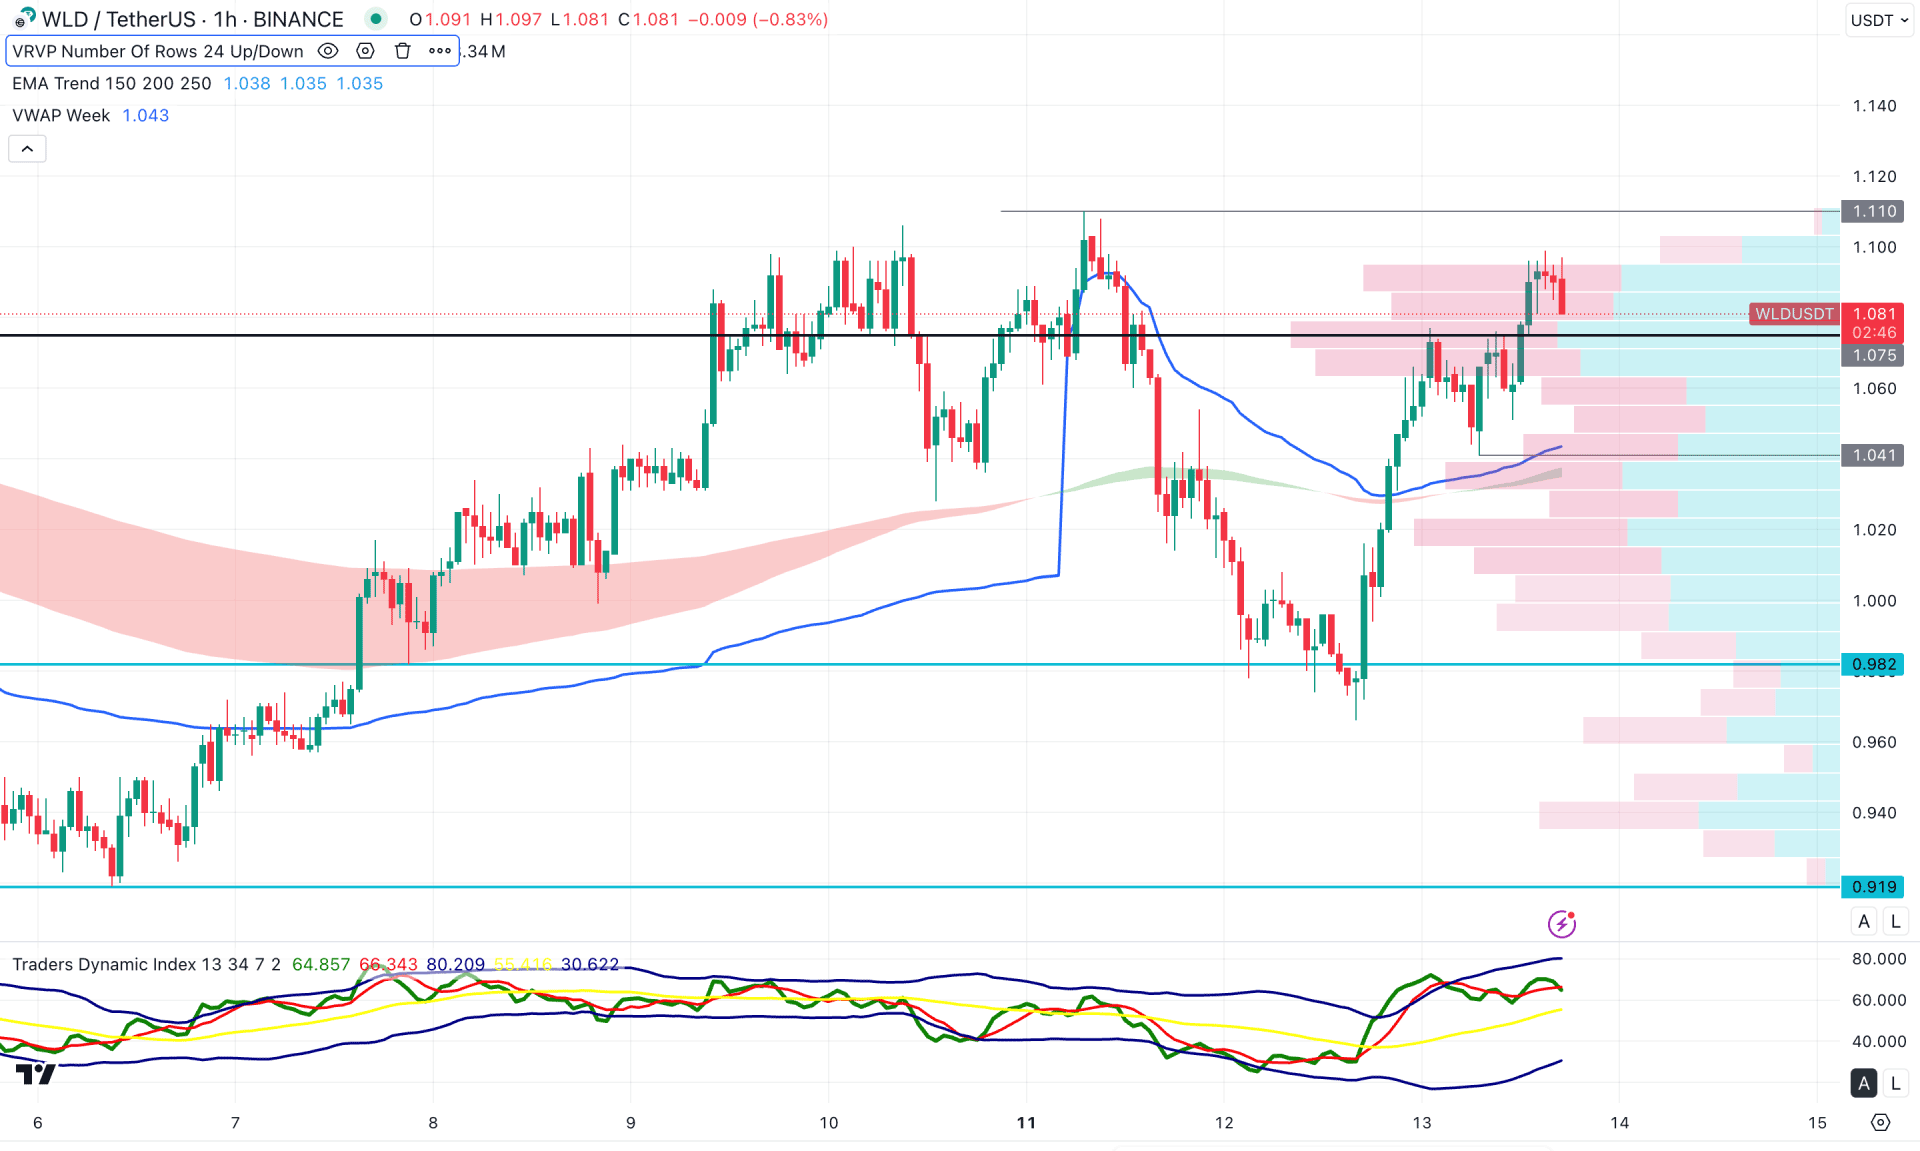
In the hourly timeframe, the price is struggling to overcome the 1.100 resistance level. Moreover, the price is in the premium zone, where sufficient confirmation is needed before opening a long position.
In the secondary indicator window, the Traders Dynamic Index is struggling to hold momentum above the 60.00 level. A drop below the 50.00 level could signal a valid top formation. On the other hand, the dynamic exponential moving average (EMA) wave is positioned below the current price and is acting as immediate support. However, the thickness of the EMA wave is not solid enough to anticipate a bullish continuation. The weekly VWFP level aligns with the EMA wave, providing confluence support at the 1.041 level.
Based on the overall market structure, investors should monitor how the price retraces lower. Sustained selling pressure below the 1.041 swing low could be an alarming sign for bulls, as it might extend downward pressure below the 1.000 psychological level.
Alternatively, the price may consolidate within the 1.075–1.040 area before offering a bullish continuation opportunity. In that case, a bullish reversal with an hourly close above the 1.100 level could validate a long entry, targeting the 1.500 level.
Based on the market structure, WLD/USDT is trading in a long-term discounted zone, with strong buying momentum visible. However, as the current price is testing the resistance area, it may fluctuate and form a new base to the downside. In this scenario, investors should watch how the price retraces lower and look for a bullish reversal pattern before aligning with the major market trend.


