
Published: June 17th, 2020
The EUR itself is getting weak across the board, and perhaps EUR will be the driver of the EUR/JPY downtrend continuation. Not only EUR/JPY could struggle, but many other major EUR currency pairs. In today’s’ analysis we will dive deep into the potential EUR/JPY price action in the coming days and will point out to the key support as well as resistance levels in the medium term.
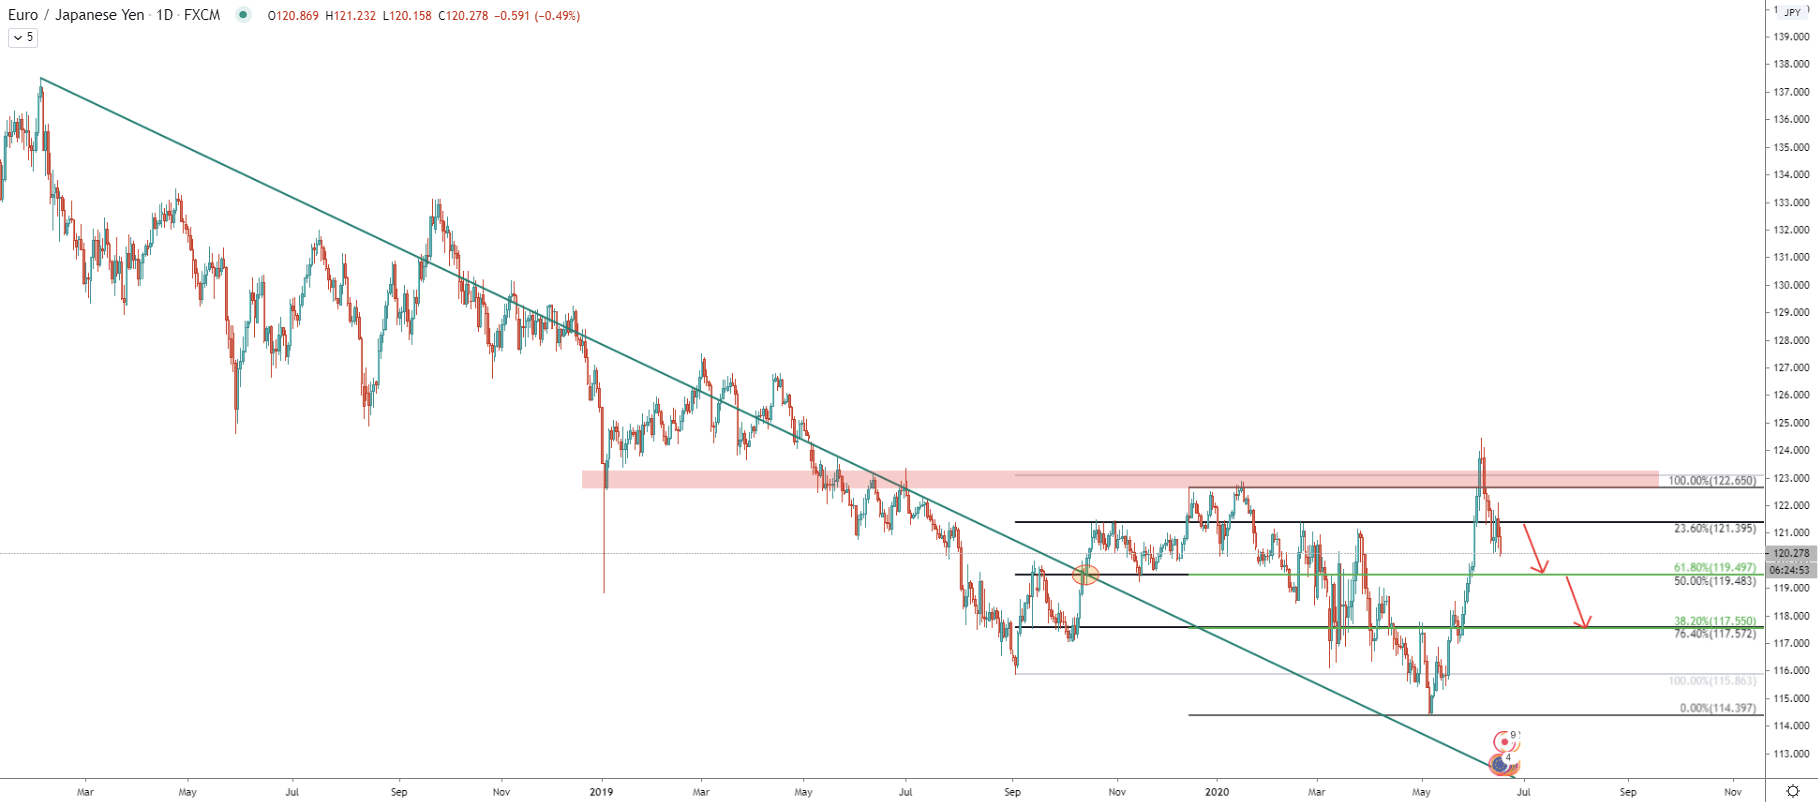
As always starting off with the Daily chart, where EUR/JPY is clearly heading south. There was strong support and then the resistance area near 123.00, which seems to be broken. Although the Monthly closing price still remains below this resistance. This makes the overall downtrend still valid and while the price might not produce a new lower low, it can be expected to at least correct further down.
We have used a downtrend trendline breakout point to apply the Fibonacci indicator, where 50% is placed at the breakout level above the trendline. It shows that 76.4% retracement at 117.55 corresponds to the 38.2% Fibs applied to the December 13, 2019 - May 6, 2020 wave down. What is also important is that 50% Fibs applied to the trendline break also corresponds to the 61.8% retracement level of the last wave down. This goes to show that there are two key support levels to watch. First is at 119.50, while the second is at 117.55, both of which, as you can see, correspond to two Fibonacci retracement levels.
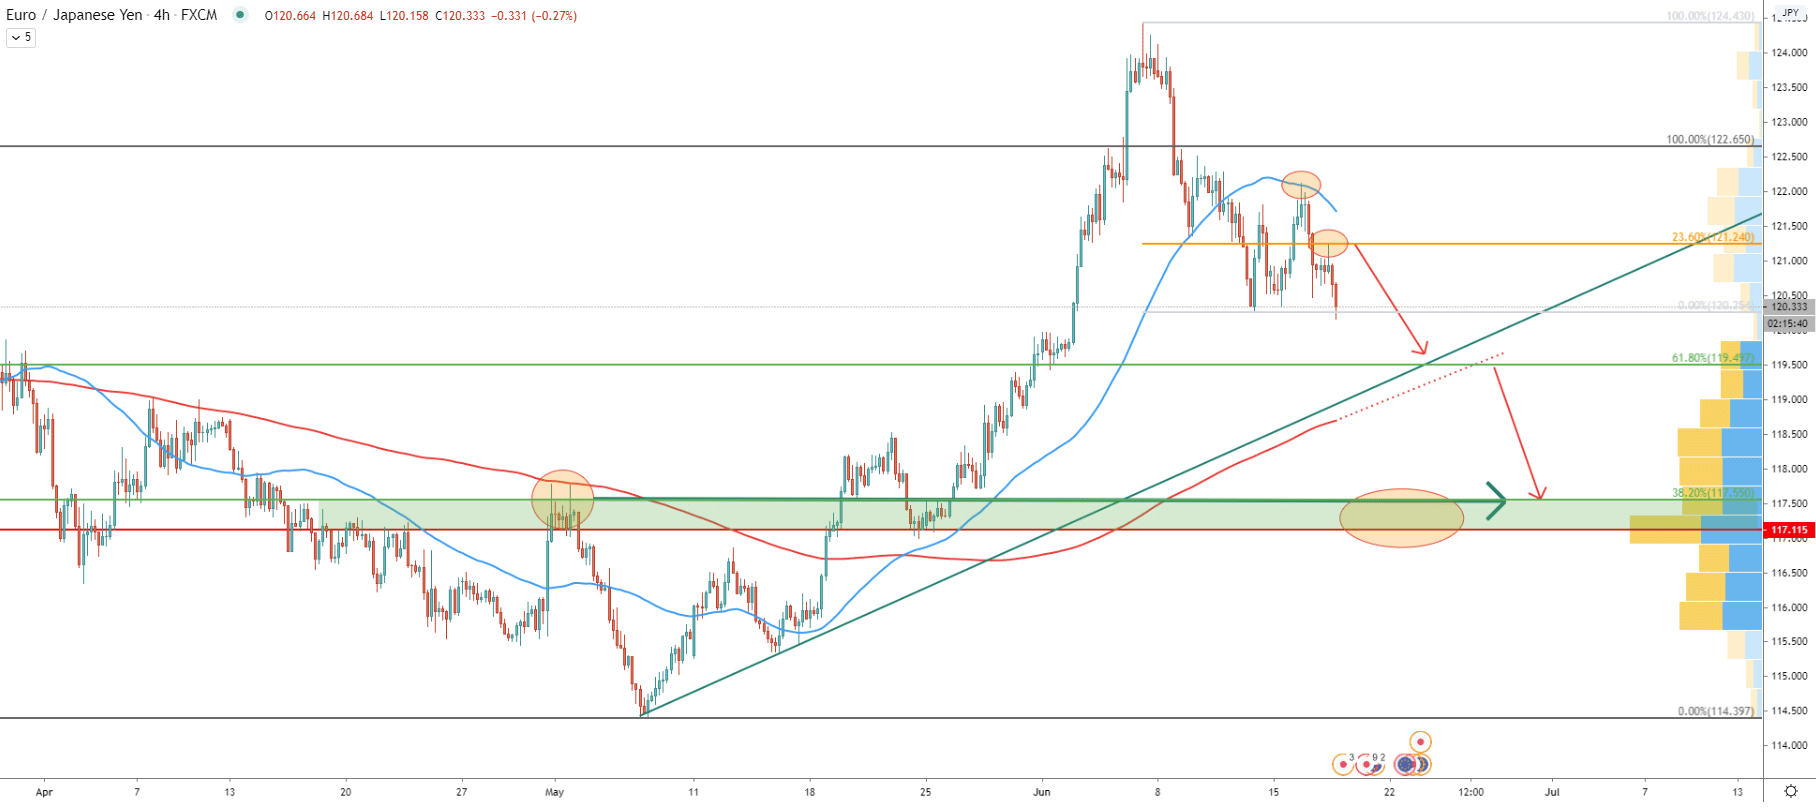
Moving to the 4-hour chart where we can see the 124.43 high, tested on June 5. After the producing the top, the price went down sharply and broke below the 50 Simple Moving Average. On the correction up, the 50 SMA was rejected, followed by the rejection oft he 23.6% Fibonacci retracement level. Following the very clean bounce off the Fibs, EUR/JPY produced yet another lower low, confirming the potential correction to the downside.
In regards to the downside targets, the 61.8% Fibs at 119.50 corresponds to the uptrend trendline as well as the 200 Exponential Moving Average, making it a first key support level for EUR/JPY. The second support at 38.2% Fibs, which is 117.55, goes in line with the Volume Profile indicator, which shows the 117.11 level. Perhaps the 117.10 - 117.55 will be the key support area in the long run.
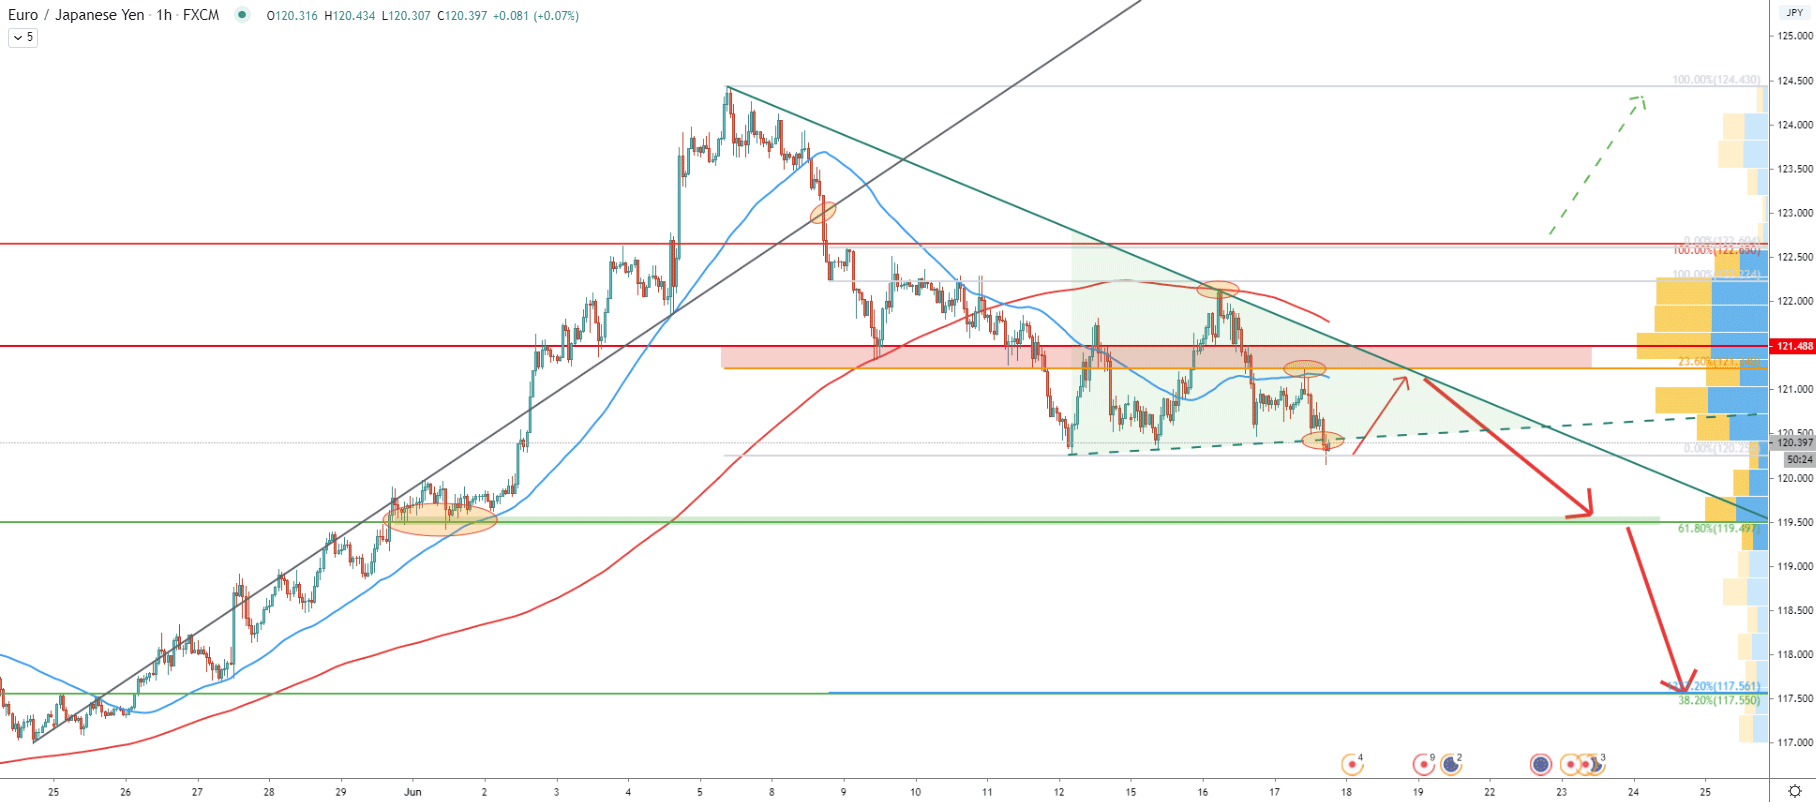
The 1-hour chart also shows the rejection of the Moving Average, this time it is 200 EMA. Following the rejection price went down and broke below the uptrend trendline, confirming a strong bearish sentiment. However, there is a possibility of a correctional move up, which might bring the price up to the 121.25 - 121.50 price area, which is confirmed by 23.6% Fibs and the Volume Profile indicator. At the same time, it corresponds to the downtrend trendline and could be the perfect selling spot, in case the triangle pattern will be formed.
The key resistance on this chart is located at 122.65, which is a previous level of resistance as per the daily chart, and if the price will break above, the correctional move to the downside should be invalidated. For now, it seems that there is too much selling pressure, and Fibonacci applied to the very small corrective wave up, after breaking the uptrend trendline and 50 SMA, shows that the final downside target at 117.55 now corresponds to two Fibonacci retracement levels, 38.2%, and 1372.2% Fibs.
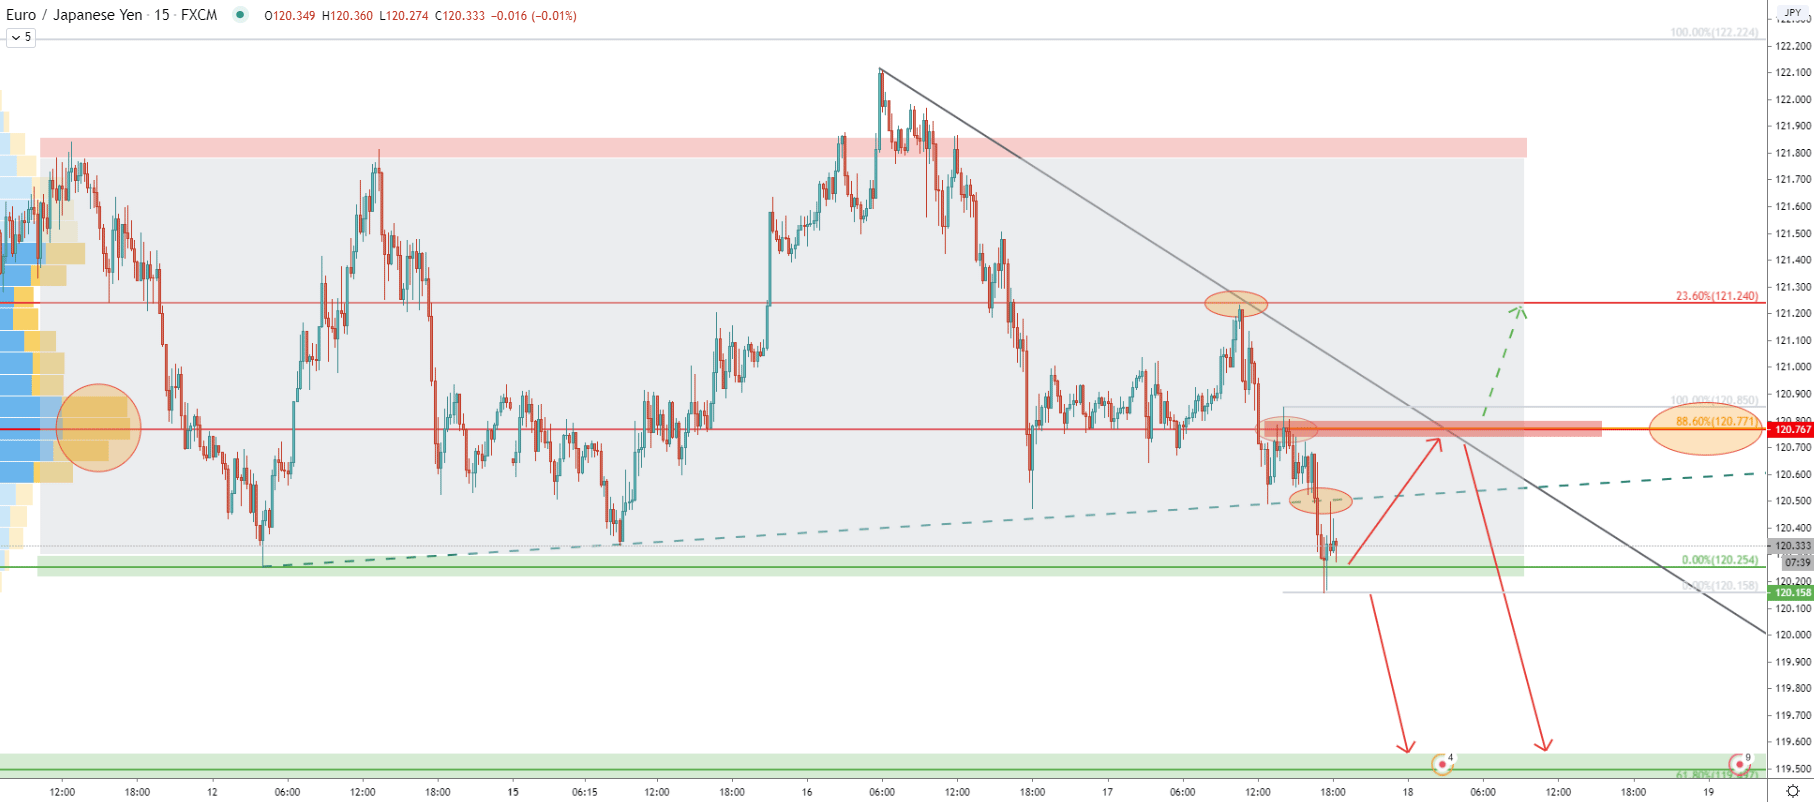
The final chart is based on the 15-minute timeframe, where EUR/JPY is seen to be consolidation. The resistance has been formed near 121.80 area, and the support near 120.25, where currently is the price. While the uptrend trendline was broken, the support area still holds, which might result in a pullback. The price can retrace either to the uptrend trendline towards the 120.50, or the 120.75 resistance area. Perhaps the best selling opportunity will be presented between 120.50 -120.75, but at the same time, the 121.00 psychological resistance could also be very attractive for sellers.
On the upside, 4h break and close above the 120.85 could trigger yet another upside wave, where the price is likely to hit 121.25 previous resistance. For this reason, it is important to watch either a rejection of the downtrend or a break above.
Considering multiple factors in this analysis, EUR/JPY is about to continue the long term downtrend, although a small pullback up should be expected. The ideal entry price for sellers is seen between 120.75 and 121.00 phonological resistance. Nevertheless, price might starting move lower without any sort of upside correction.
As per the daily and the 1-hour chart, there are two support levels which are the potential downside targets, The first is at 61.8% Fibs, which is the 119.50 level. The second, and the most important one, is located at 117.55, which is confirmed by two fibs, 38.2% as per the daily chart, and 1327.2% Fibs as per the 1h chart.
As always there is a probability that price will go up. But we need multiple confirmations for this scenario. First of all, price must break above the 121.50 resistance, which will be the first confirmation. Secondly, price must break above the 122.12, which might trigger further growth towards the 122.65 resistance. But the final confirmation would be the daily break and close above the 122.65, which will completely invalidate bearish outlook and EUR/JPY should be expected to move much higher.
Support: 120.25, 119.50, 117.55
Resistance: 121.25, 121.50, 122.65