
Published: November 11th, 2020
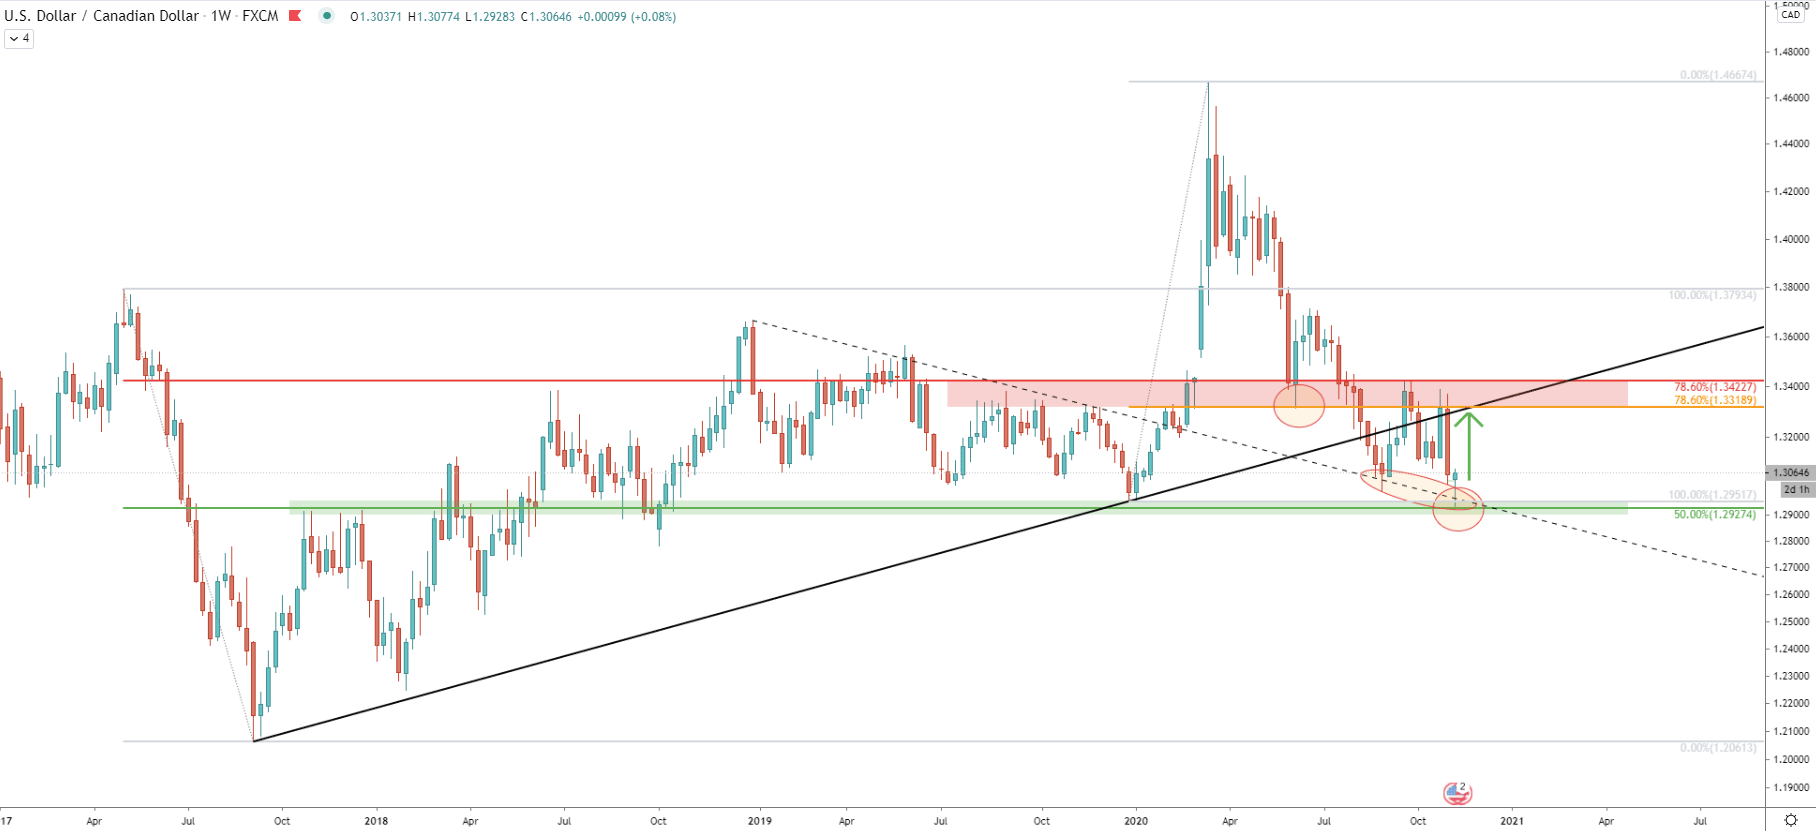
On the weekly chart, the USD/CAD sentiment remains unclear. This is because higher highs are being produced, suggesting the validity of an uptrend, but on the other hand, the price has tested and rejected an important support level at 1.2927. This support is confirmed by a 50% Fibonacci retracement level and has been rejected along with the average-price downtrend trendline.
At the same time, the resistance has been formed between 1.3318 and 1.3422, where two Fibonacci retracement levels are located. Previously there was already a clear rejection of the 1.3422 which goes to show that right now, USD/CAD is stuck between the support and resistance levels.
While the price remains at the bottom of the range, and the support is being respected, there is a high probability that the pair will start climbing up, potentially testing 1.3318 resistance, which corresponds to the uptrend trendline as can be seen on the chart.
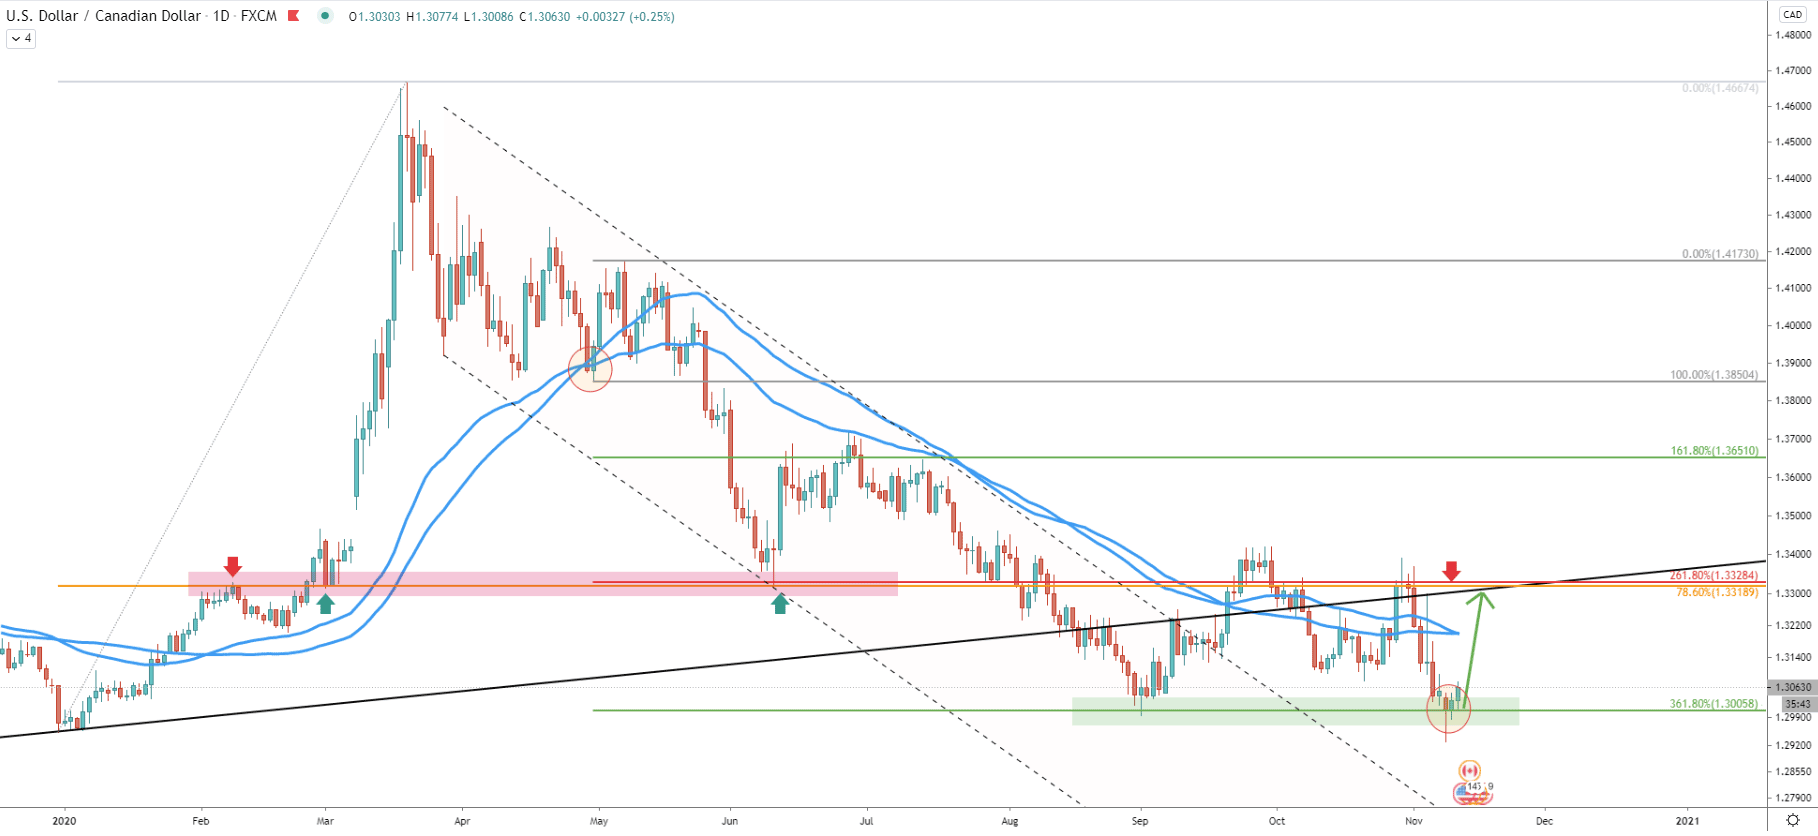
The daily chart shows, that double bottom has or being formed right now at 1.3000, which is obviously key psychological support. This support is also confirmed technically, by 361.8% Fibs, applied to the corrective wave up after price broke below 50 Simple and Exponential Moving Average.
It can be seen, that in September, USD/CAD tested 1.3000 support for the first time, which has resulted in price breaking above the descending channel as well as 50 EMA and SMA. It goes to show that resistance is being broken, suggesting a lack of selling pressure. Therefore, chances of a corrective move up remain high, and on this chart, the resistance is also confirmed by a 261.8% retracement level.
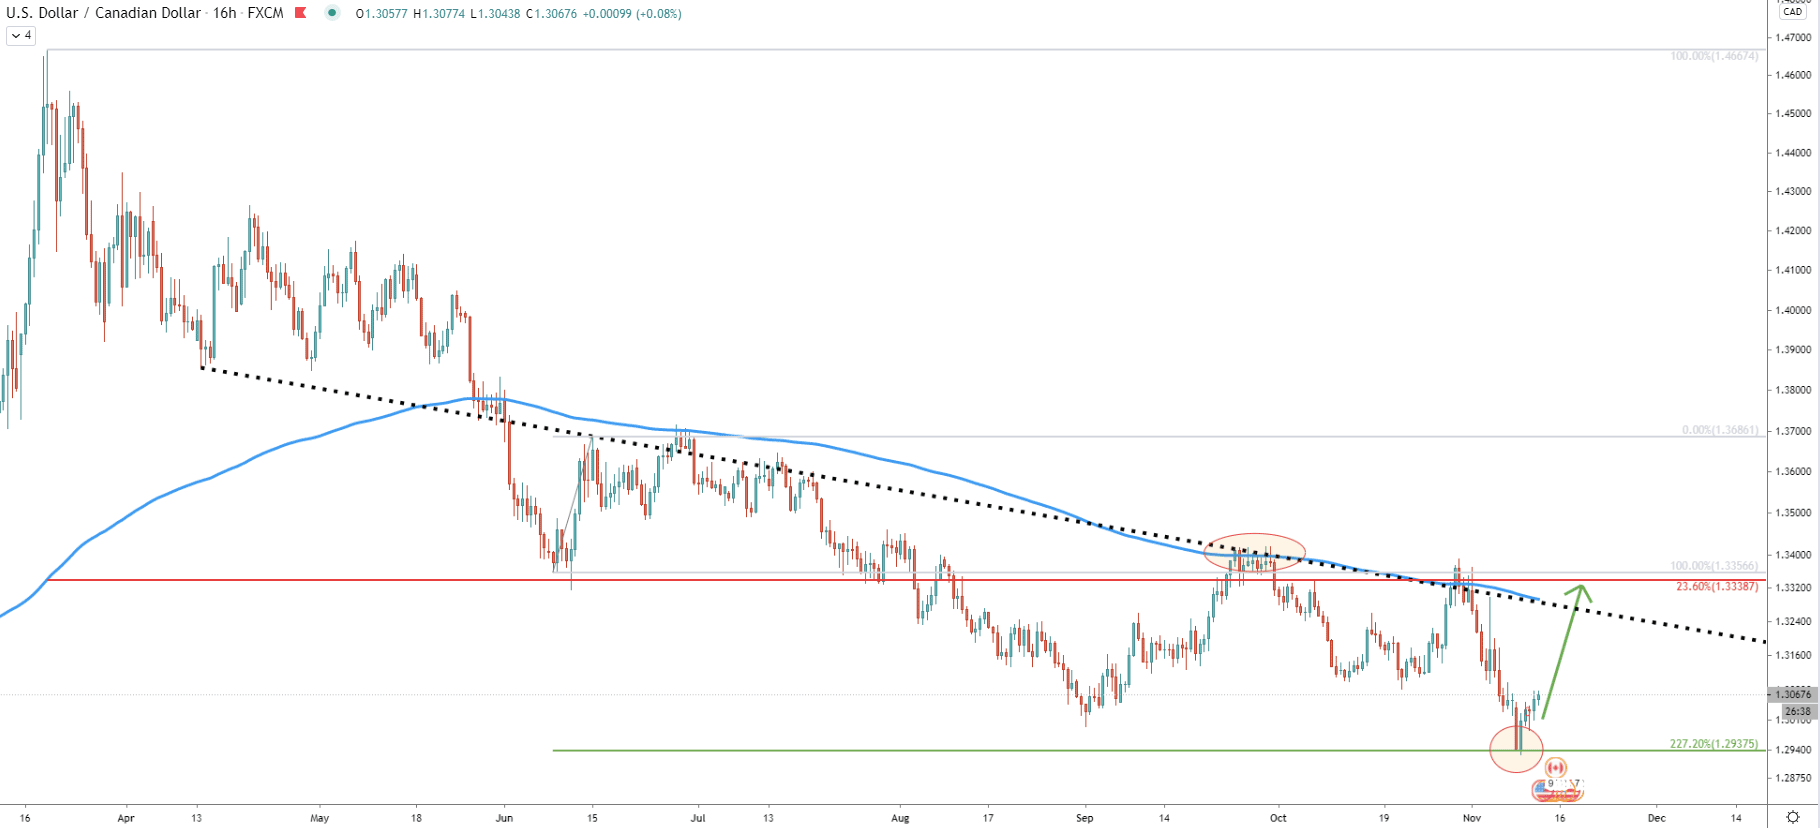
USD/CAD remains below the average-price downtrend trendline as well as 200 Exponential Moving Average. While this should validate the downtrend, another factor is against such a view. This is because USD/CAD rejected yet another Fibonacci support, this time it is 227.2% Fibs applied to the corrective3 wave up after price broke below the 200 EMA.
So there are 2 Fib support levels that were rejected, implying a potential corrective move up or even a trend reversal. As has been mentioned already, the key resistance is located near 1.3300, which on this chart is now also confirmed by 23.6% Fibs.
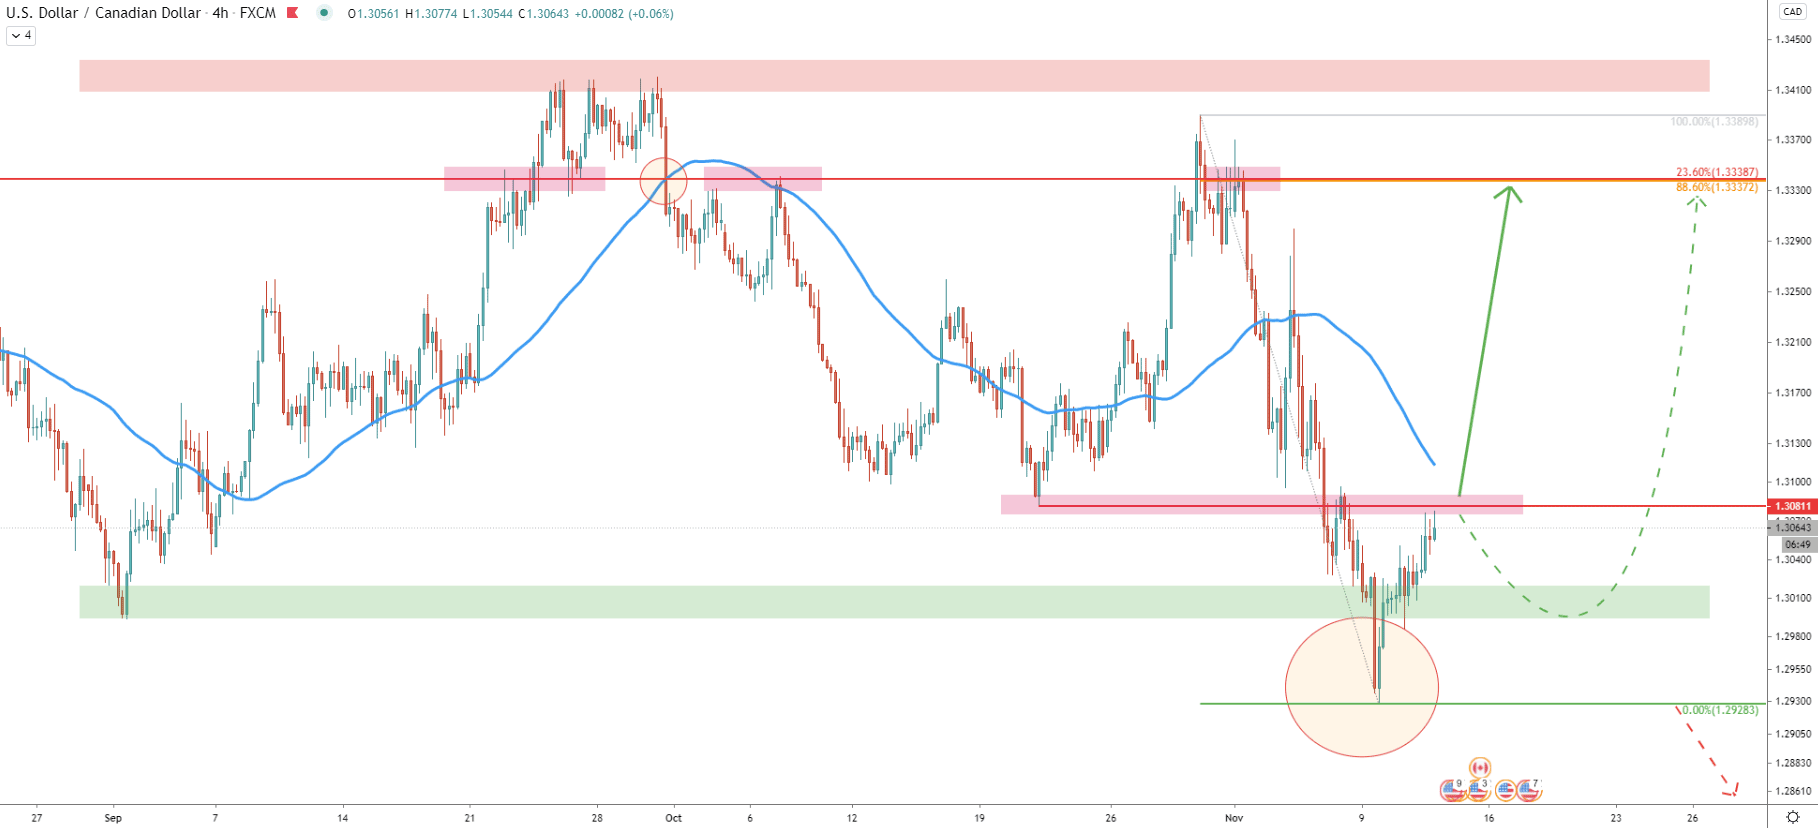
On the 4-hour chart, it becomes more obvious that USD/CAD could have entered a consolidation phase, as the price is stuck between 1.3400 resistance and 1.3000 support areas since September this year. Although there was an attempt to break below the 1.3000 support, it ended up with a fast upside move.
Currently, USD/CAD is facing the resistance, which is based at the 1.3080 area and previously acted as the support. This might put some selling pressure, resulting in a pullback, before/if uptrend will take place. But upon break and close above the 1.3080 as well as the 50 EMA, buyers are likely to step in.
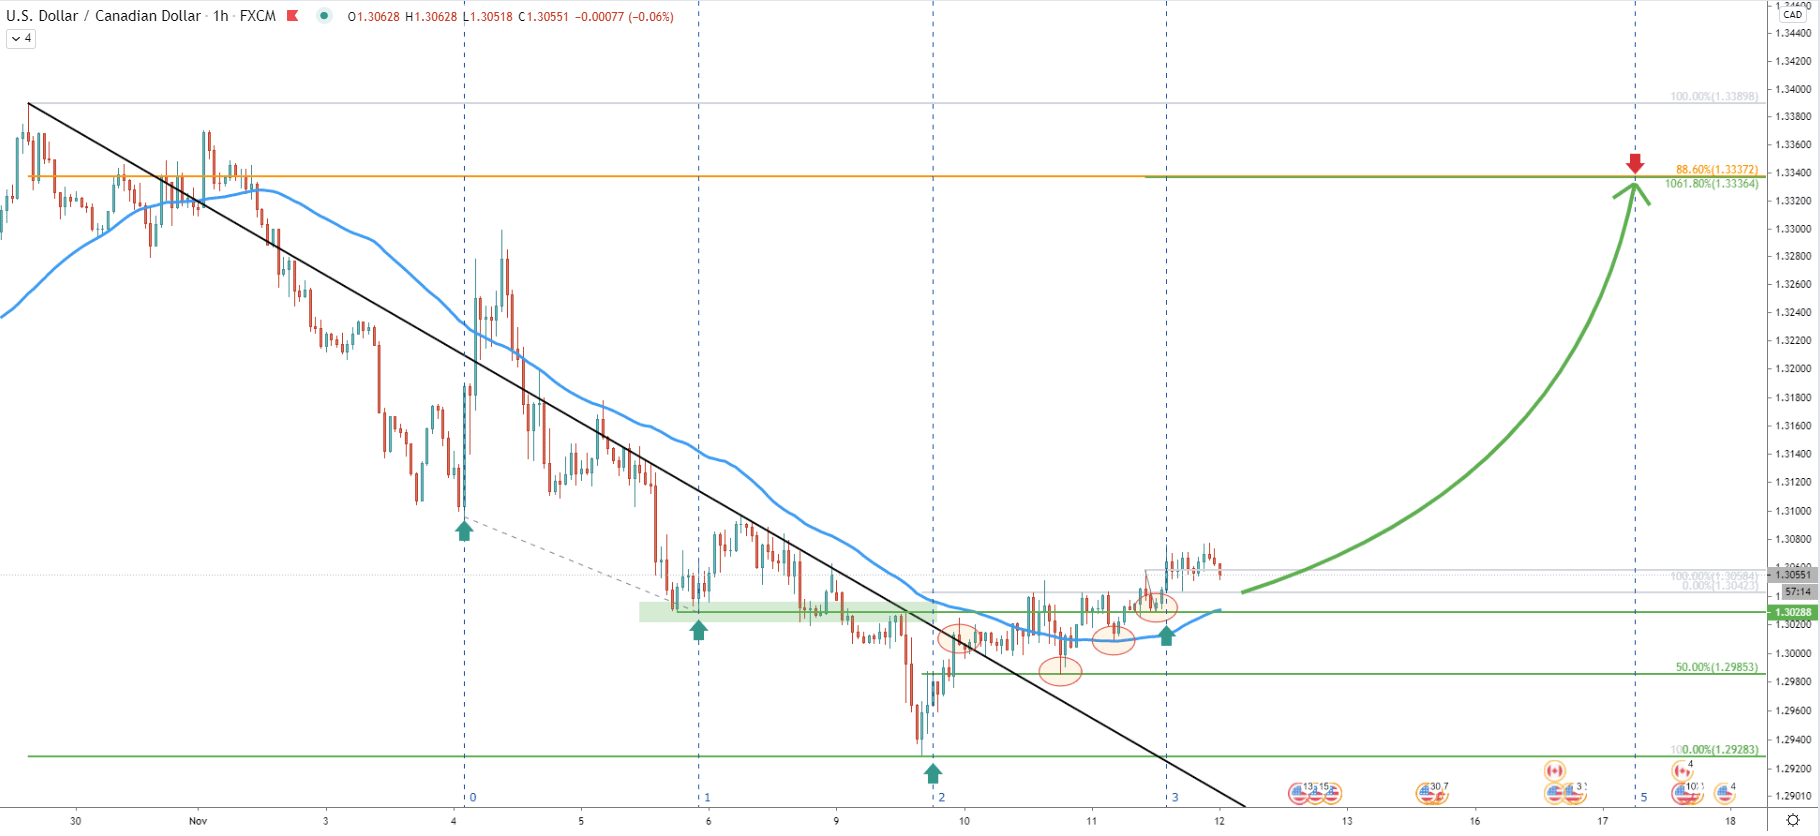
The downtrend trendline and the resistance at 1.3028 have been broken. Then, the price has corrected down, and cleanly rejected 50% Fibs at 1.2985 followed by the rejection of 200 EMA. Higher highs and higher lows are starting to appear on a lower timeframe, while the new Fibonacci cycles have just begun.
There was a clean bounce off the 1.3028 support, which was used to apply Fibs. It can be seen that the 1.3337 level corresponds to 88.6% and 1061.8% Fibs, yet again making the 1.3330 resistance area extremely important. Taking into consideration the next Fibonacci cycle, this potential uptrend might last only 4-5 trading days, because the current cycle ends on November 17.
USD/CAD seems to have entered a consolidation phase on higher as well as the lower timeframe. Currently, the price is at the bottom of that range, while rejecting multiple Fibonacci support levels. This goes to show that there is not enough selling power, and it can result in a 300 pip upside move, towards the top of the range.
As per this analysis, there are at least 4 different Fibonacci retracement levels pointing out to the 1.3330 resistance area. Perhaps this zone could be considered as an upside target in the next 4-5 trading days.
As per the 4-hour chart, a break below the 1.2928 low, will immediately invalidate the bullish outlook, and USD/CAD should be expected to continue trading downwards.
Support: 1.3028, 1.300, 1.2985, 1.2928
Resistance: 1.3081, 1.3335