
Published: October 21st, 2021
After prolonged bullish pressure, the US Dollar started to lose its momentum against the basket of currencies. On the other hand, sight deposits have increased by +0.2 bn CHF, which indicates that SNB is focusing on buying Dollars and Euros. All of these are signs of inflation in the US economy. In this situation, CHF and Gold should move up as the safe-haven nature.
The US CPI is currently at 5%, the record high level since 1990, except for the 2008 Summer. On the other hand, European inflation moved below the 1.9% level while European services correlating with longer-term inflation moved down to +0.7%. Meanwhile, USD/CHF broke below the neckline of the potential Head and Shoulder pattern in the daily chart that may push bears to get the chance of the current market sentiment.
Let’s see the upcoming price direction from the USD/CHF technical analysis:
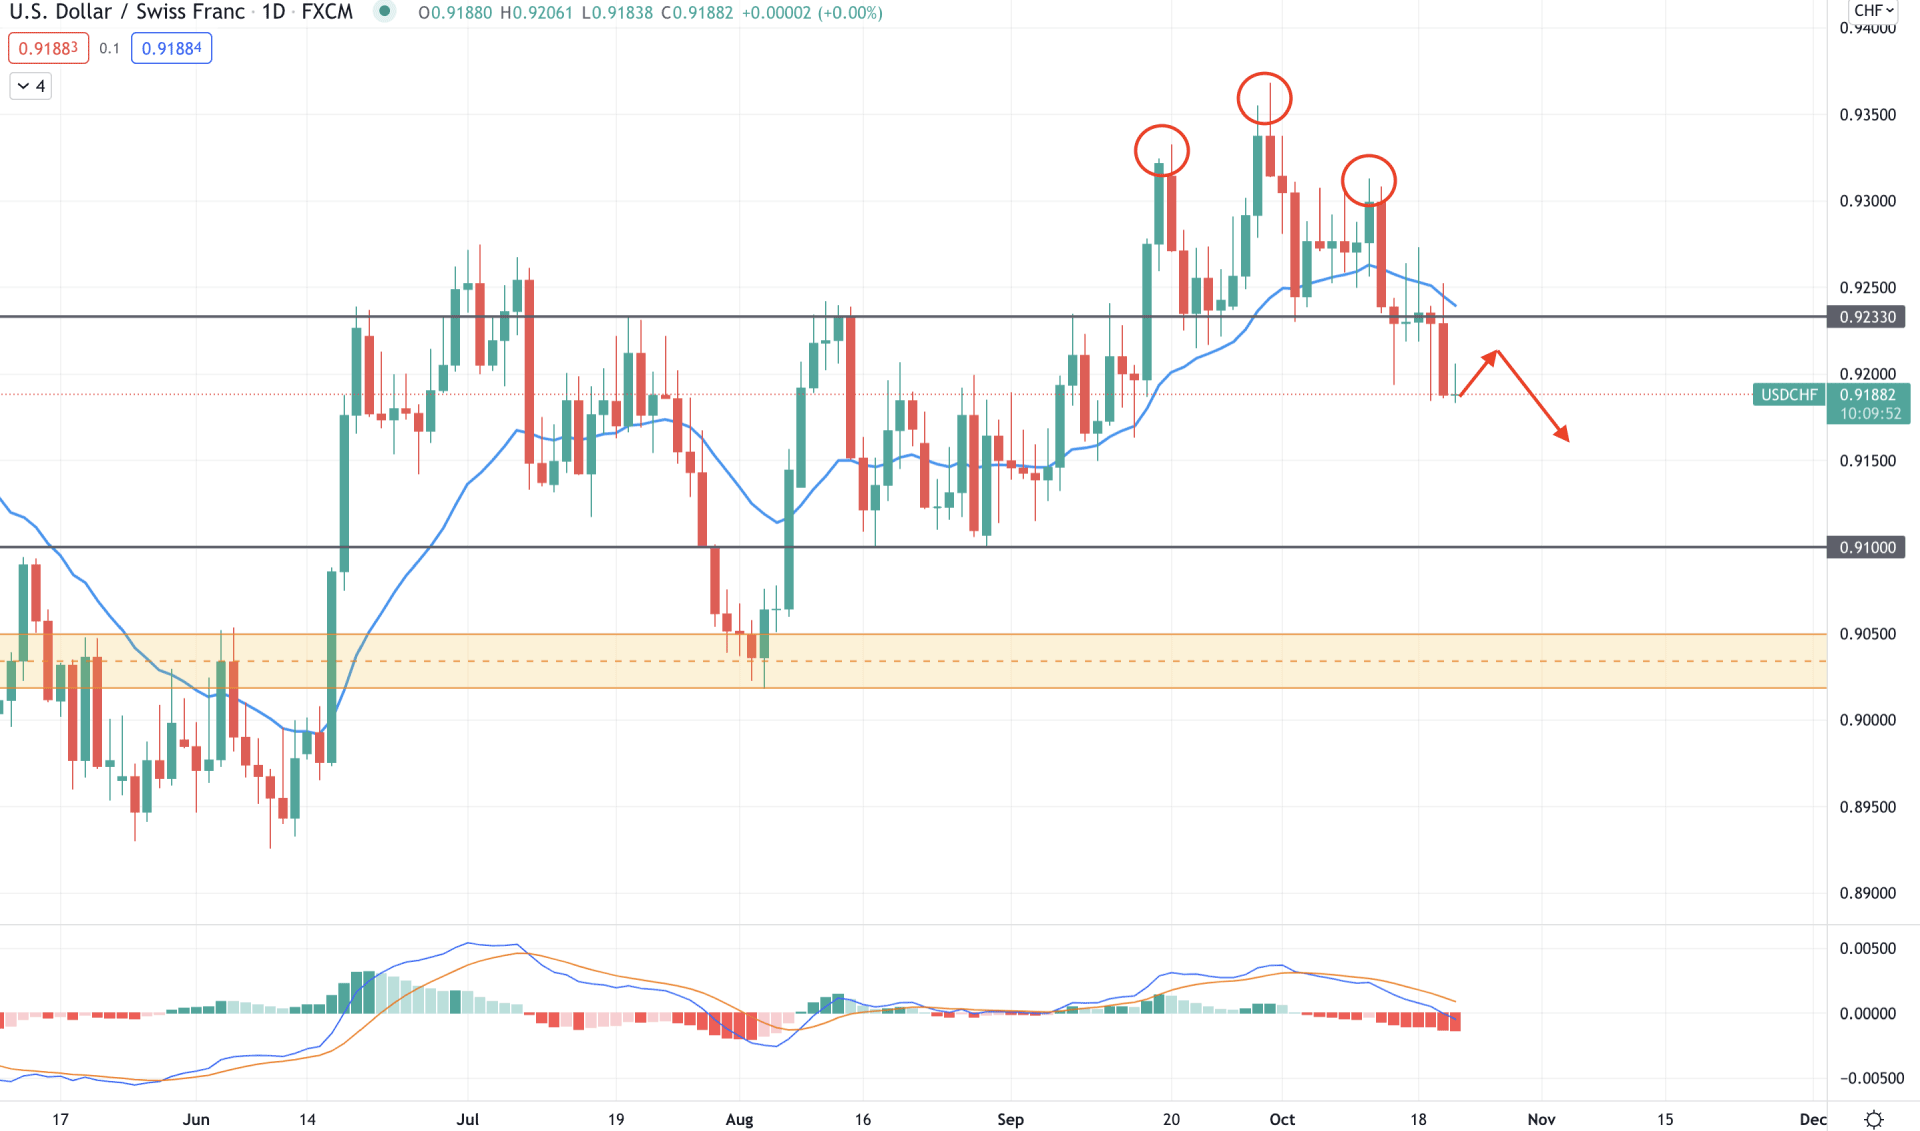
USD/CHF bulls became aggressive from mid-June that made a sharp bullish move towards the 0.9233 level. Later on, the price corrected lower and formed a new demand zone at 0.9050 to 0.9019 area from where a new bullish swing appeared. After that, however, bulls became weaker above the 0.9330 level in the most recent price and formed a Head and Shoulder pattern.
The above image shows how the price broke below the neckline with an impulsive bearish pressure while the dynamic 20 EMA works as minor support. Meanwhile, in the indicator window, MACD Histogram turned bearish and made new lows. Therefore, as the price is trading below the 0.9233 necklines, it is more likely to show a bearish pressure in the coming days.
Based on the daily context, the bearish pressure may extend below 0.9100 key support level to grab the liquidity. On the other hand, any bullish daily close above the current resistance of 0.9233 may invalidate the current bearish possibility and take the price towards the 0.9368 swing high.
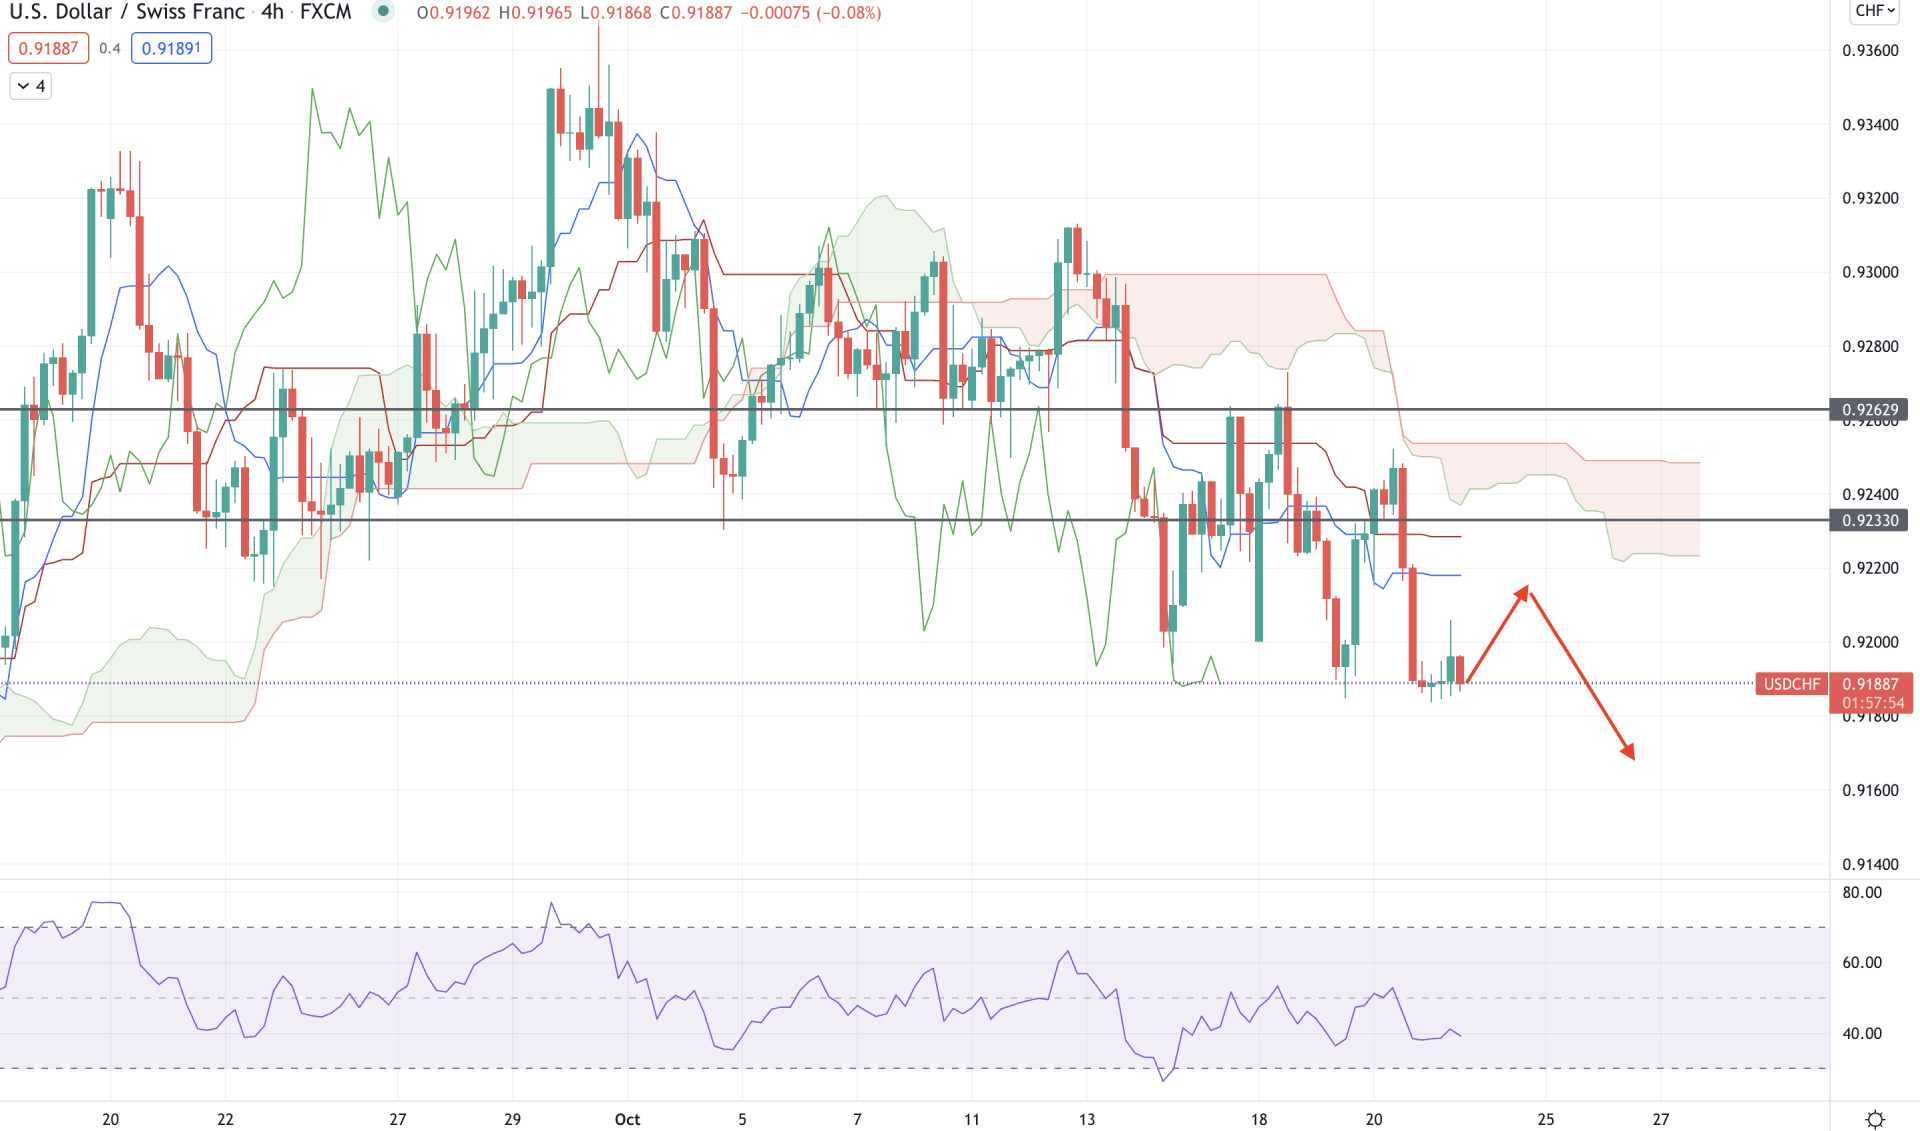
According to the Ichimoku Kinko Hyo, USD/CHF initiated a bearish trend after breaking below the 0.7262 intraday event level. Later on, the price tested the level and moved below the dynamic Kijun Sen. Meanwhile, in the future cloud, Tenkan Sen is below the Kijun Sen with a substantial gap and aiming lower.
The above image shows how the price corrects below the Kumo Cloud, where the dynamic Tenkan Sen and Kijun Sen are flat. In the indicator window, RSI is below the 60 levels and aiming lower, another sign of a possible bearish pressure in the price.
Based on the H4 context, USD/CHF is more likely to come lower towards the 0.9100 level in the coming days. On the other hand, a bullish H4 candle above the 0.9262 level may alter the current market structure and higher the price towards the 0.9320 area.
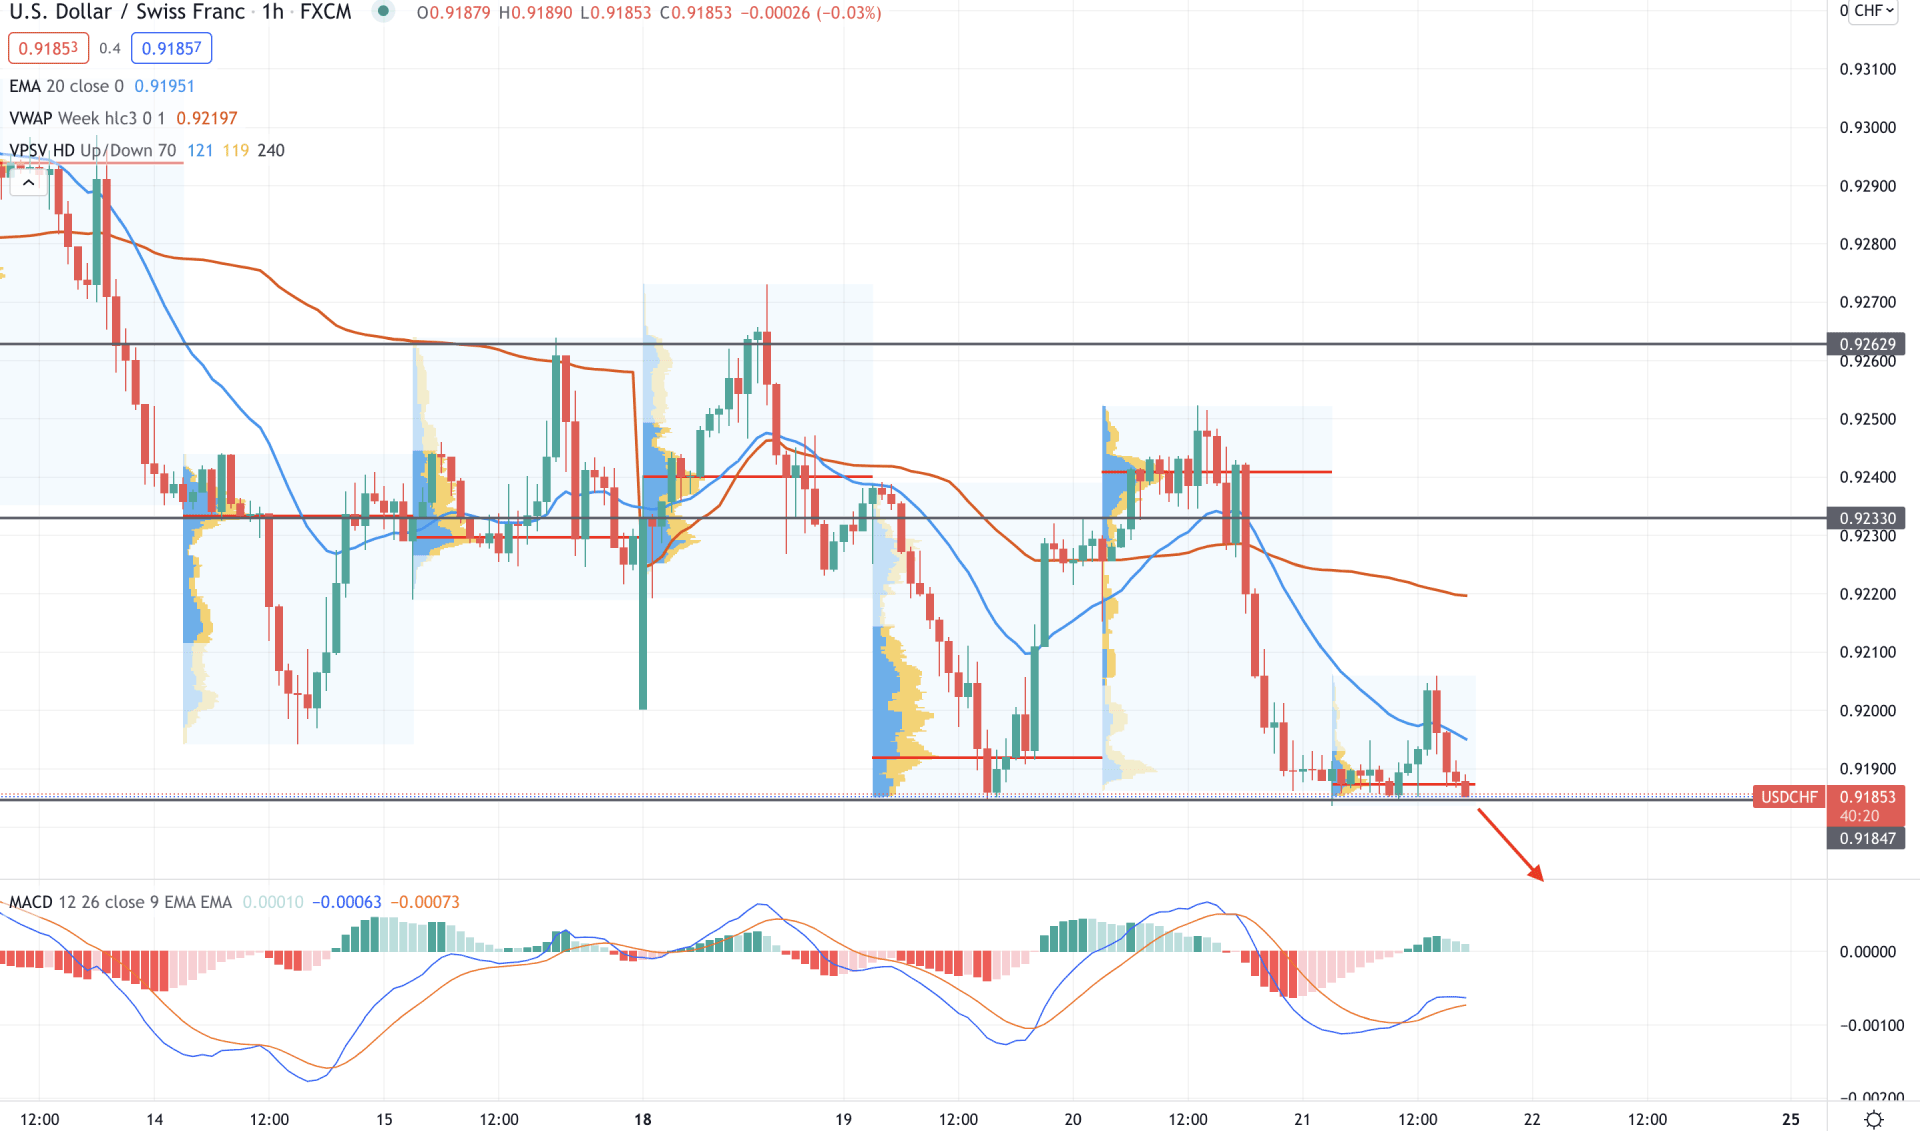
In the intraday chart, USD/CHF is facing an extreme bearish pressure as the price came below the 0.9233 level with an impulsive bearish pressure and found a bottom at 0.9185 level. After that, however, bulls tried to take the price above the dynamic 20 EMA but bears managed to take the price lower on the next candle.
The above image shows that the price is trading below the 0.9187 intraday high-volume level where the 20 EMA is working as minor resistance. On the other hand, the gap between the price and dynamic VWAP is extended, where a bullish correction is possible. Meanwhile, MACD Histogram is bullish but moving to the zero level.
Based on the H1 context, a solid bearish H1 close below the 0.9185 level may initiate an intense selling pressure in the price towards the 0.9100 level. On the other hand, any bullish correction and bearish rejection from the dynamic VWAP would be another selling opportunity with a better risk and reward ratio. However, if the price moves above the 0.9233 level with a bullish H1 close, it may initiate a broader correction before aiming higher.
As per the current market condition, bears may control the USD/CHF and bring the price lower towards the 0.9100 level. On the other hand, investors should closely monitor how the price reacts on the 0.9233 level. Any bullish H4 close with a massive green body may alter the current market structure and invalidate the Head and Shoulder pattern.


