
Published: March 25th, 2020
Last week, the Bitcoin felt quite strong and managed to produce a good recovery after the March 12 drop. The bottom has been formed at $3782 and price went up to the recent high at $6900 area. It was 82.44% pullback, which is very healthy growth during a short period of time. But will BTC/USD continue to rise or perhaps there is more downside pressure to come?
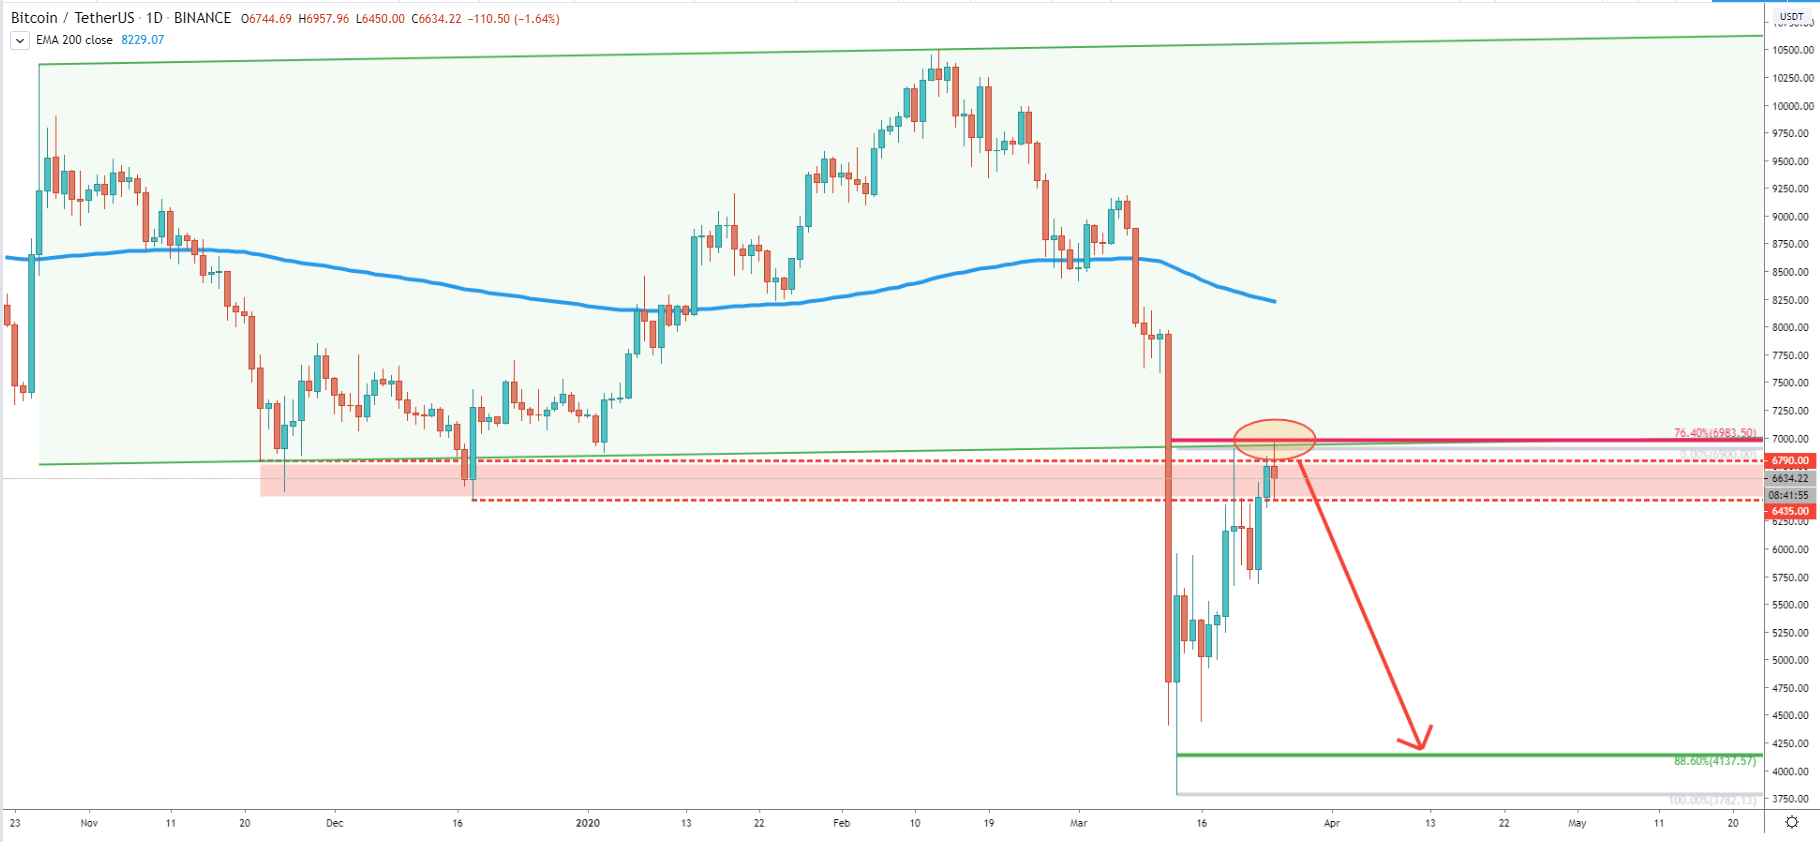
We can see on the Daily chart, that BTC/USDT has reached 76.4% Fibonacci retracement resistance level applied to the December - March wave up. The $0.6983 resistance level has been rejected cleanly, along with the lower trendline of the broken ascending channel. BTC remains below the 200 Exponential Moving Average, which says that long term uptrend hasn’t started just yet.
Many are wondering if BTC will recover at all, or if we should expect a decline towards $1000 or even lower. It seems unreasonable for the BTC to experience such a huge drop in price, although considering the recent economic crisis everything is possible. While BTC remains under selling pressure, there might be at least one more wave down. It could be the last wave only if the support will be rejected. The key support is seen at the 88.6% retracement level, which is $4137. If and when there will be a bounce off this price, we can start speaking of a long term uptrend. But in any case, this level could be a very strong demand price and must be monitored very closely if reached.
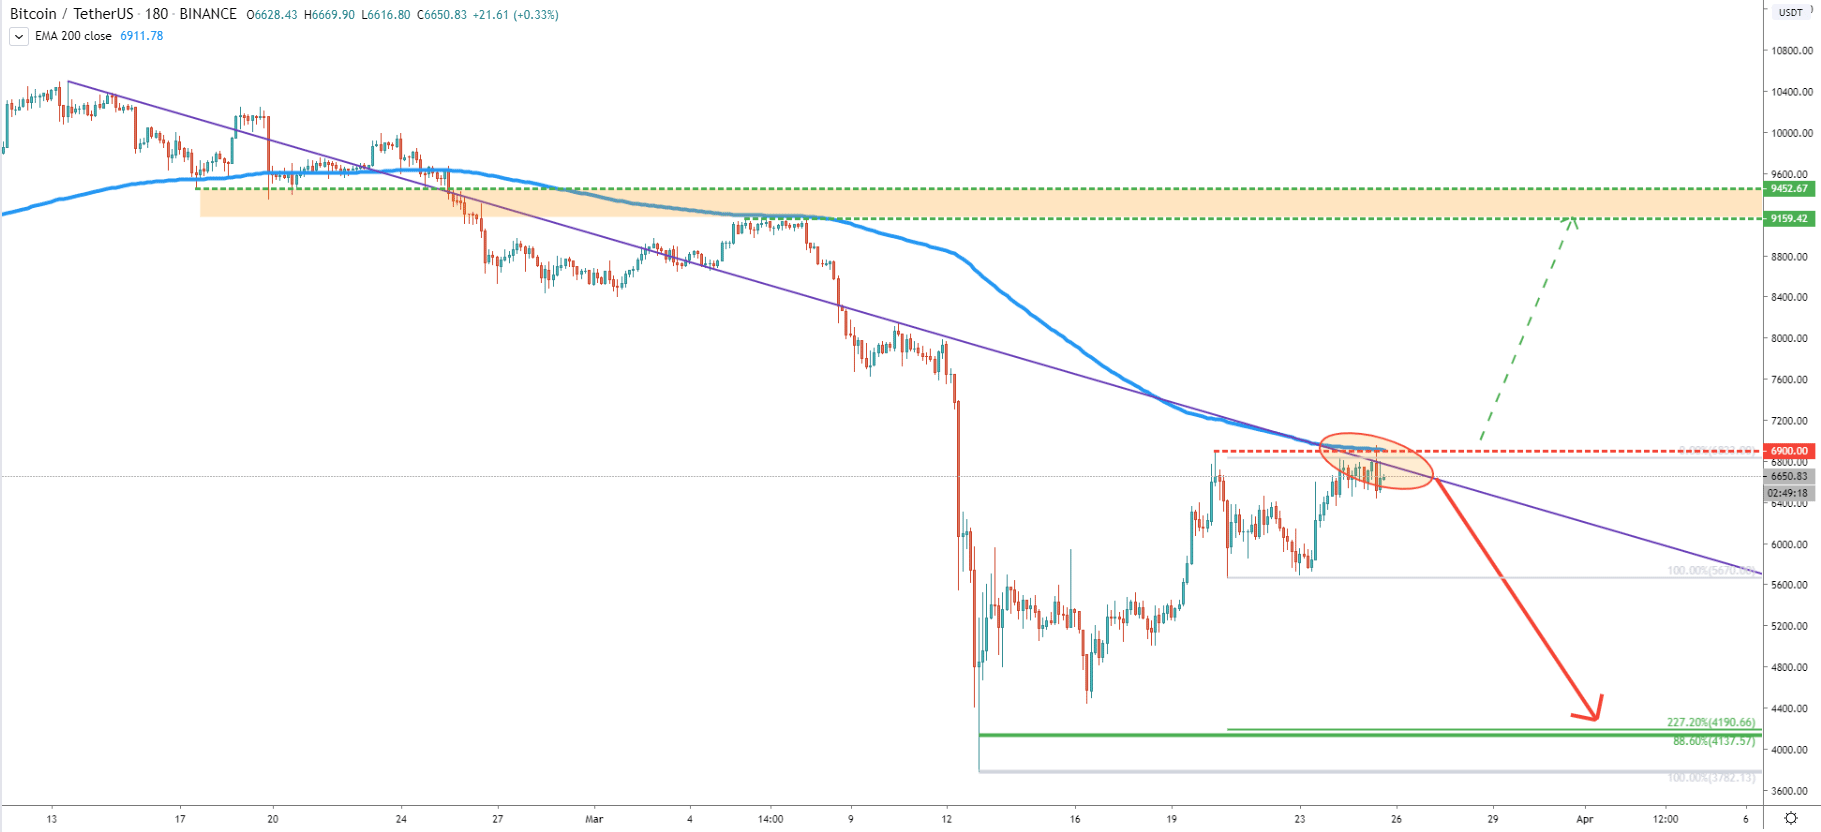
On the 3h chart, BTC/USDT rejected very strong obstacles. First is the 200 EMA and second is the downtrend trendline. Remember that on the Daily chart it also rejected a 76.4% Fibonacci retracement level. All this shows that buyers are not ready yet and the price is expected to move lower. But at the same time, if there will be a daily break and close above current resistance as well as $7k psychological level, this might, in fact, result in a trend reversal.
But while we expect yet another wave down, our support on a Daily chart, is also confirmed by 227.2% Fibonacci retracement level on a 3h chart. Both of them are near the $4200 area.
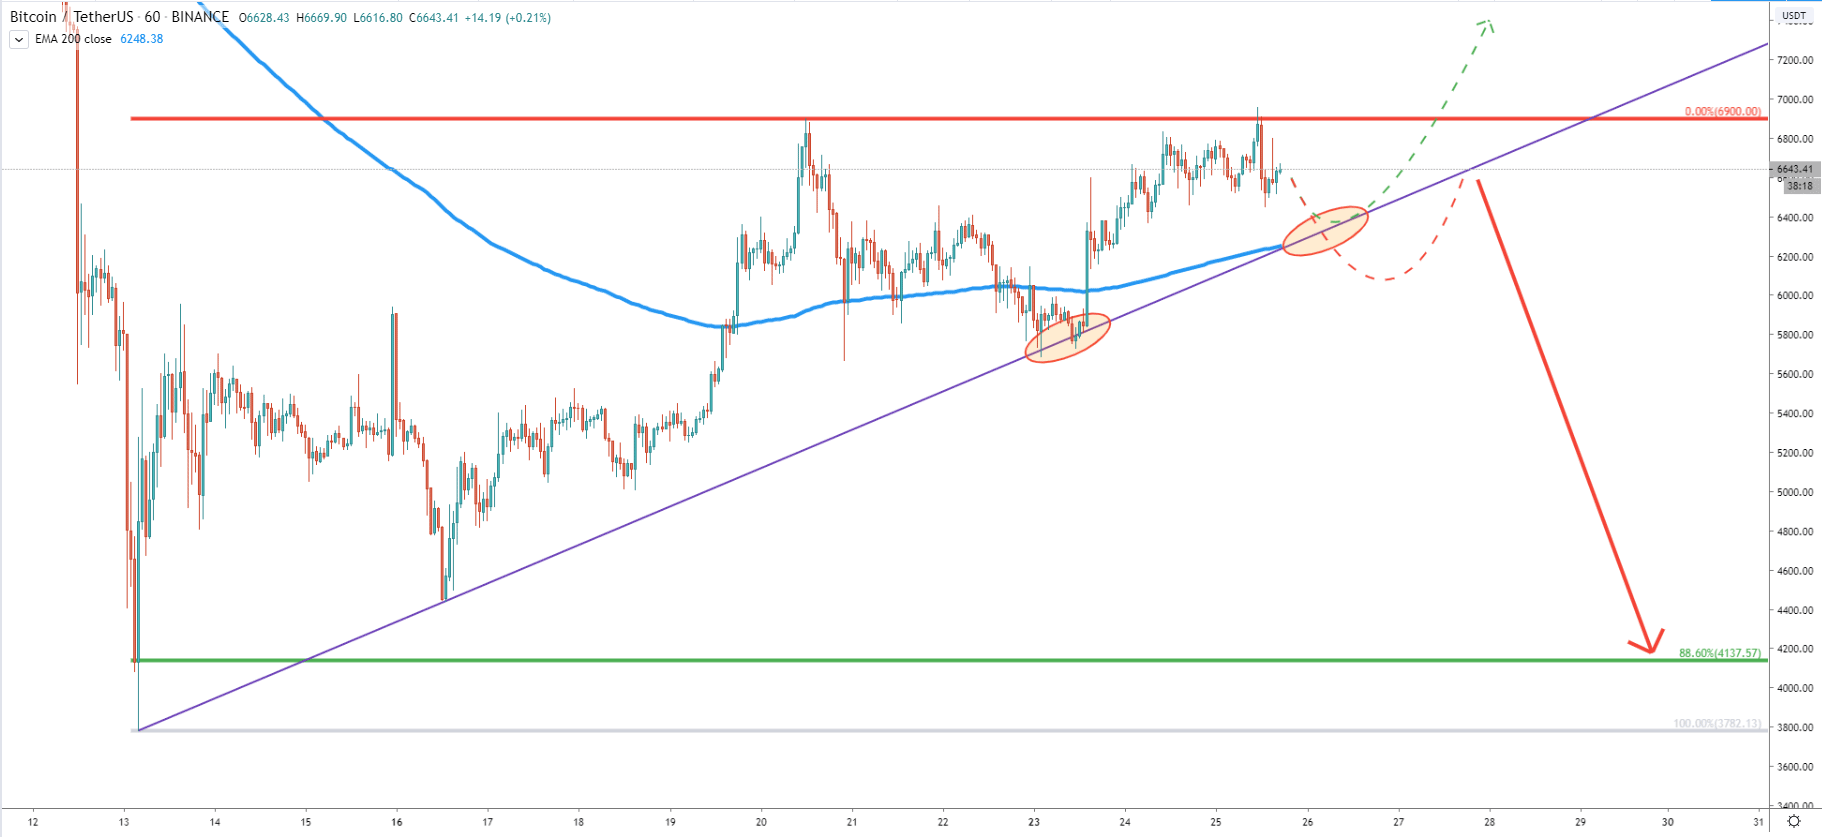
The 1h chart shows potential scenarios of price development in the short term. Here we can expect the price to move down towards the 200 EMA and the uptrend trendline. Speculators are likely to get activated upon a break below these indicators. Then some consolidation can take place, but eventually, price should start moving towards a $4200 demand zone.
Bitcoin doesn’t show much of the strength to confirm trend reversal just yet. It remains below resistance and expected to move down once again. Perhaps this might be the final wave down, before/if the long term uptrend continues. But considering the upcoming BTC halving, we can expect the uptrend to start in the near future. The most attractive buying price at this point could be near $4200 level.
Key support is located at the 88.6% Fibonacci retracement level, which is $4140
Speaking of the long term, the probability of the uptrend is extremely high. If BTC will hold the uptrend trendline, along with the 200 EMA, we can expect a further price increase. At the same time, if a $7k level will be cleared, this could also mean that BTC/USD is ready for an uptrend.
Support: $6000, $4200
Resistance:$6900, $7000


